Option Trading with Option chain part -3Example of an Option. Suppose that Microsoft (MFST) shares trade at $108 per share and you believe they will increase in value. You decide to buy a call option to benefit from an increase in the stock's price. You purchase one call option with a strike price of $115 for one month in the future for 37 cents per contract ...
Ans: Options contracts are of two types; Call options and Put options. However, they can differ based on their underlying assets and expiration date.
TATASTEELPP trade ideas

Good momentum stock, gave clean rally, pulled back Good momentum stock, gave clean rally, pulled back and consolidated forming narrow ranges ready for B.O ( The output of the BO is based on mkt condition)
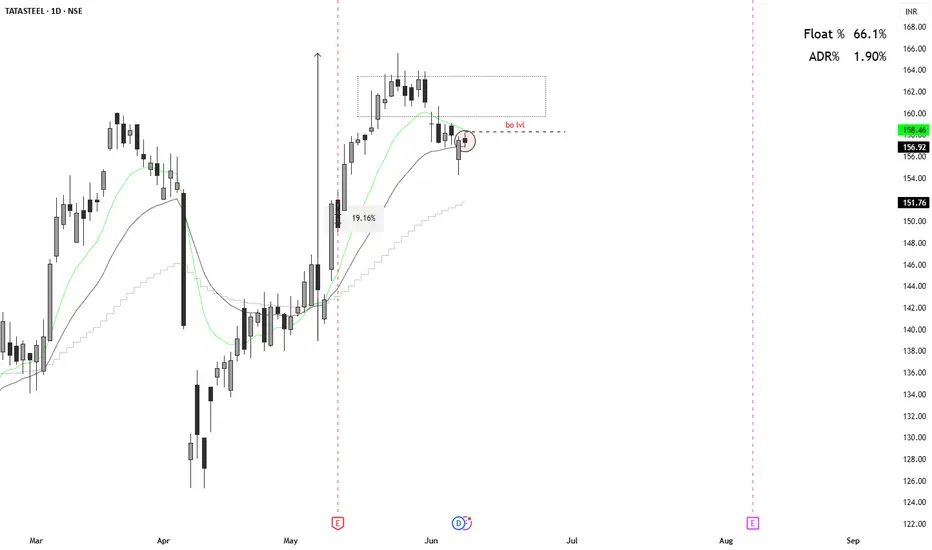
TATA STEEL: At a make-or-break level• Tata steel is trading between two different channel system for the last one year.
• On 19th May It broke out from channel system 1
• On 25th May it broke the channel system 2 with good volume.
• There after the market is sideways and there is a volume contraction is observed.
• Weekly candle is indication a bearish piersing
• A fake BD below level 160 could lead the price on channel system 2 and EMA 21 around 156.5
• A free fall might happen there after.
• Go long only if a strong bullish marubuzo closing above 166.
• Wait and watch the show!!!

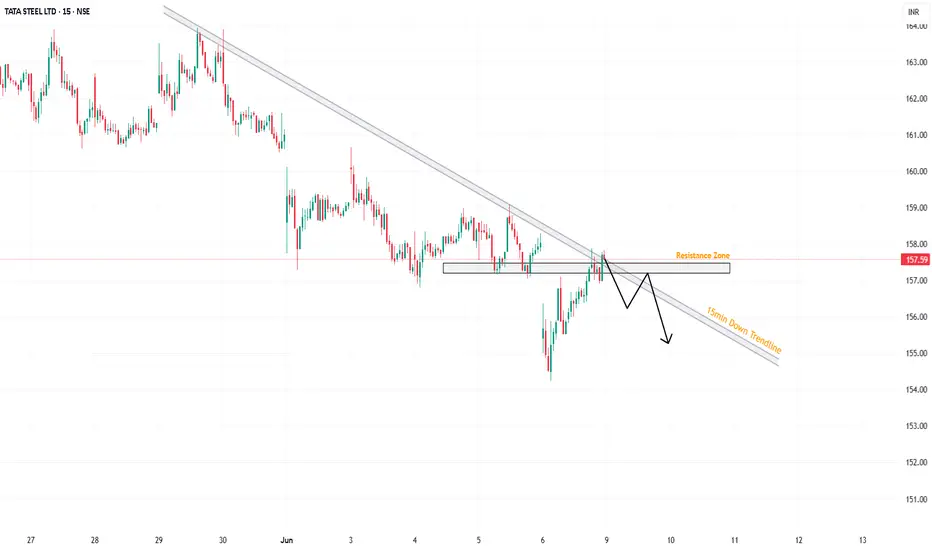
TATASTEEL | 15 min Idea – 10 June 2025 / SWING📌 TATASTEEL | 15 min Idea – 7 June 2025
Bias: Neutral to Bearish
CMP: 157.59
Market Structure
• Price is hovering just below a resistance zone near 158.5–159.5.
• Mild downward pressure with lower highs forming.
Levels
│ R1 158.50 │ R2 159.50
│ S1 156.50 │ S2 154.80
Trade Plan
🟢 Breakout Long → Entry on 15‑min close > 158.60.
Targets 159.80 / 161.00 | SL 157.20.
🔴 Breakdown Short → Entry on 15‑min close < 156.30.
Targets 155.00 / 153.50 | SL 157.90.
Notes
• Volume faded near resistance – signs of exhaustion.
• Sideways consolidation suggests wait for breakout trigger.
Set alerts at 158.60 and 156.30; manage risk ≤ 1% per trade.
#PriceAction #TATASTEEL #15min #GLOBALTRADESECURITIES
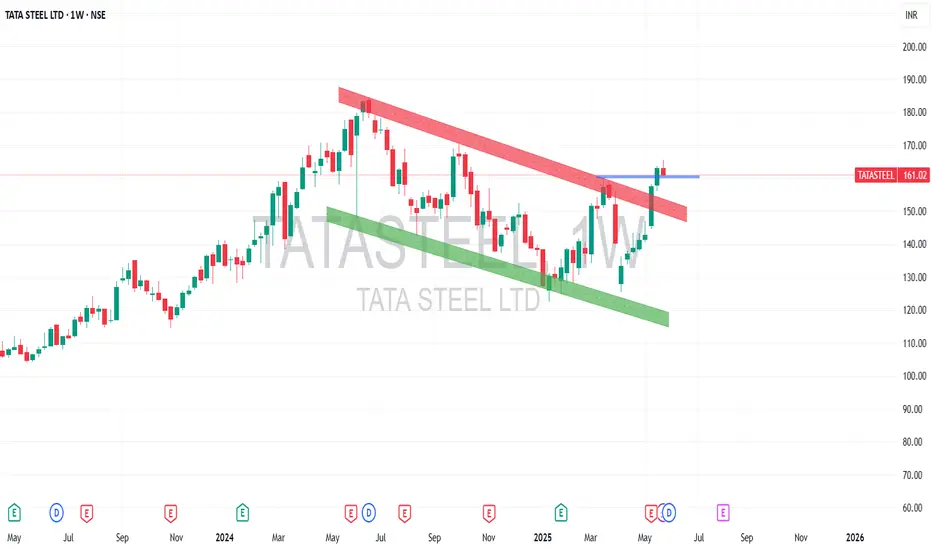
Tata Steel: Breaking Out with Strong Q4 Momentum🔍Technical Overview
Tata Steel has been range-bound between ₹20–₹80 for over a decade. In 2021, it broke above the ₹80 resistance, which then acted as support in 2022. The stock rallied to ₹184 by June 2024, then it came to ₹120.
A descending channel formed during this correction, characterized by lower highs and lower lows. This pattern was decisively broken in May 2025, coinciding with strong Q4 results. The stock surpassed its recent lower high and is now trading at ₹163.
Key Levels:
Resistance: ₹170 (Target 1), ₹180 (Target 2), ₹190 (Target 3)
Support: ₹160, ₹150, and a major demand zone at ₹120
The breakout, supported by robust financials, suggests a bullish trend continuation.
💰Q4 FY25 Key Financial Highlights:
Tata Steel's Q4 FY25 performance showed significant improvement compared to the previous quarter:
Total Income: ₹56,218 Cr (vs ₹53,648 Cr in Q3 FY25)
Total Expenses: ₹49,659 Cr (vs ₹47,745 Cr in Q3 FY25)
Total Operating Profits: ₹6,559 Cr (vs ₹5,903 Cr in Q3 FY25)
Profit Before Tax: ₹2,200 Cr (vs ₹1,672 Cr in Q3 FY25)
Profit After Tax: ₹1,201 Cr (vs ₹295 Cr in Q3 FY25)
Diluted Normalized EPS: ₹1.04 (vs ₹0.26 in Q3 FY25)
Compared to Q4 FY24, while revenue saw a slight decline, net profit more than doubled, indicating improved operational efficiency.
🧾Fundamental Insights
Cost Efficiency: The significant profit increase is attributed to reduced input costs, particularly in raw materials like coking coal and iron ore.
Dividend Declaration: The company announced a dividend of ₹3.60 per share, reflecting confidence in its financial health.
Market Position: Tata Steel's strategic cost management and operational efficiency have positioned it favorably in the steel industry, even amidst global challenges.
📊Conclusion
Tata Steel's technical breakout, coupled with strong Q4 financials, indicates a positive outlook. Investors should monitor key support and resistance levels as the stock navigates its upward trajectory.
Disclaimer: lnkd.in
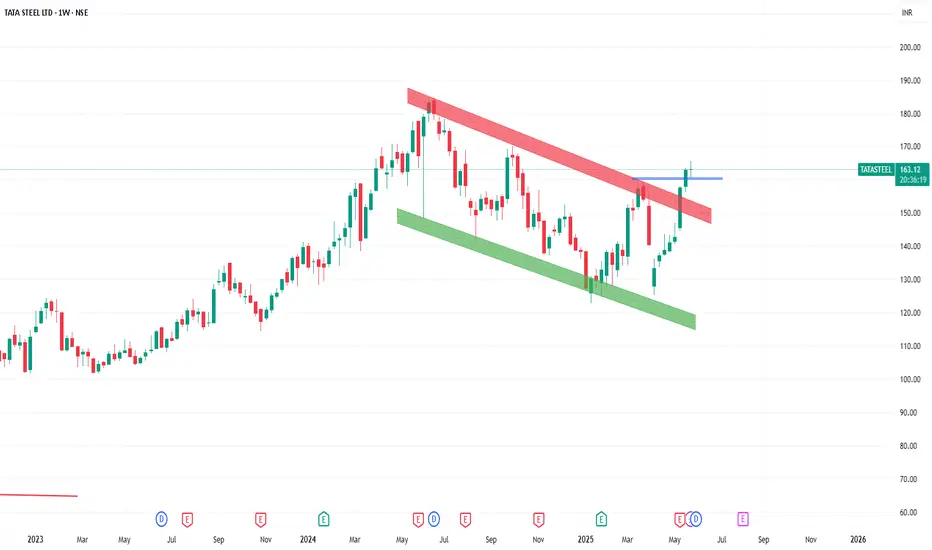
Tata Steel: Breaking Out with Strong Q4 Momentum🔍 Technical Overview
Tata Steel has been range-bound between ₹20–₹80 for over a decade. In 2021, it broke above the ₹80 resistance, which then acted as support in 2022. The stock rallied to ₹184 by June 2024, then it came to ₹120.
A descending channel formed during this correction, characterized by lower highs and lower lows. This pattern was decisively broken in May 2025, coinciding with strong Q4 results. The stock surpassed its recent lower high and is now trading at ₹163.
Key Levels:
Resistance: ₹170 (Target 1), ₹180 (Target 2), ₹190 (Target 3)
Support: ₹160, ₹150, and a major demand zone at ₹120
The breakout, supported by robust financials, suggests a bullish trend continuation.
💰 Q4 FY25 Key Financial Highlights:
Tata Steel's Q4 FY25 performance showed significant improvement compared to the previous quarter:
Total Income: ₹56,218 Cr (vs ₹53,648 Cr in Q3 FY25)
Total Expenses: ₹49,659 Cr (vs ₹47,745 Cr in Q3 FY25)
Total Operating Profits: ₹6,559 Cr (vs ₹5,903 Cr in Q3 FY25)
Profit Before Tax: ₹2,200 Cr (vs ₹1,672 Cr in Q3 FY25)
Profit After Tax: ₹1,201 Cr (vs ₹295 Cr in Q3 FY25)
Diluted Normalized EPS: ₹1.04 (vs ₹0.26 in Q3 FY25)
Compared to Q4 FY24, while revenue saw a slight decline, net profit more than doubled, indicating improved operational efficiency.
🧾 Fundamental Insights
Cost Efficiency: The significant profit increase is attributed to reduced input costs, particularly in raw materials like coking coal and iron ore.
Dividend Declaration: The company announced a dividend of ₹3.60 per share, reflecting confidence in its financial health.
Market Position: Tata Steel's strategic cost management and operational efficiency have positioned it favorably in the steel industry, even amidst global challenges.
📊 Conclusion
Tata Steel's technical breakout, coupled with strong Q4 financials, indicates a positive outlook. Investors should monitor key support and resistance levels as the stock navigates its upward trajectory.
⚠️ Disclaimer
This report is for informational purposes only and does not constitute investment advice. Investors should conduct their own research or consult with a financial advisor before making investment decisions.
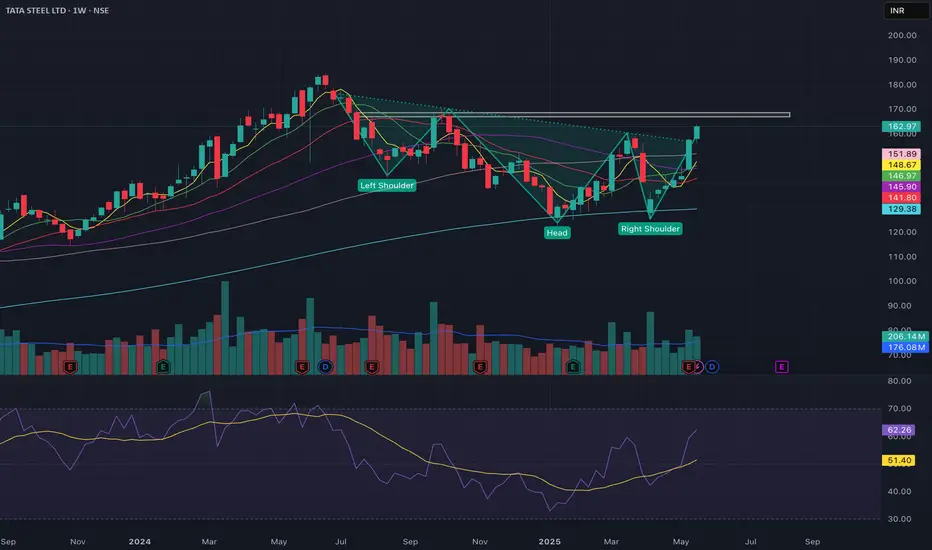
TATASTEEL ready to reach 200Inv H&S patterns observed in W.
Taken support at the MA.
RSI divergence with strength above 50.
Resistance at 170 beyond which target of 200.
Divergence Trading Divergence occurs when the stochastic oscillator's peaks or troughs disagree with the price. For instance, if the stochastic makes lower highs while the price is rising, it indicates a bearish divergence. Likewise, higher stochastic lows against lower price lows indicate a bullish divergence.

RSI Divergence Part 3RSI divergence happens when the price and the RSI move in opposite directions. This signals that the current trend may be losing momentum and could reverse soon. For example, if the price keeps rising but the RSI starts falling, it could mean the uptrend is weakening.

RSI DivergenceRSI divergence happens when the price and the RSI move in opposite directions. This signals that the current trend may be losing momentum and could reverse soon. For example, if the price keeps rising but the RSI starts falling, it could mean the uptrend is weakening.

Explanation of MACDThe Moving Average Convergence Divergence (MACD) is a technical indicator used in trading to analyze the strength, direction, and momentum of a trend. It's calculated using two exponential moving averages (EMAs) and a signal line, helping traders identify potential entry and exit points.

Technical Analysis class1 1Technical analysis is a means of examining and predicting price movements in the financial markets, by using historical price charts and market statistics. It is based on the idea that if a trader can identify previous market patterns, they can form a fairly accurate prediction of future price trajectories.

RSI Divergence Part 2RSI divergence happens when the price and the RSI move in opposite directions. This signals that the current trend may be losing momentum and could reverse soon. For example, if the price keeps rising but the RSI starts falling, it could mean the uptrend is weakening.

More About RSIRSI is a tool that aids traders in capturing market momentum by measuring the fluctuation in prices. Traders rely on RSI to spot oversold and overbought markets and determine the right time to enter a trade. RSI helps traders identify whether a stock is either overbought or oversold.

RSI and RSI Divergence Part 2RSI (Relative Strength Index) is a momentum indicator that measures recent price changes to assess if an asset is overbought or oversold. RSI divergence occurs when the price of an asset and its RSI move in opposite directions, potentially indicating a trend reversal or weakening trend. There are two main types: bullish divergence (price makes lower lows while RSI makes higher lows) and bearish divergence (price makes higher highs while RSI makes lower highs).

Advanced Divergence Trading AnalysisA positive divergence means price is making lower lows while an indicator/oscillator is making higher highs. On the other hand, a negative divergence happens when price is making higher highs while an indicator/oscillator is forming lower lows.

Price Action Trading Price action trading is a strategy where trades are made solely based on an asset's price movements, without relying on indicators or external analysis.

Option and Database tradingOptions data providers collect specific data points that can later be used to determine price movements over time. These price changes in the stock market help investors and brokers decide which stocks might be ideal to sell or buy given current market conditions.

Tata Steel : Too much volatility due to Tariff news !Tata Steel Share prices is reacting sharply to every tariff-related headline lately.
📉 Downside?
It’s bouncing off its 200W-EMA, with strong support at ₹115–122 — and ₹100–105 below that.
⚠️ BUT one negative tariff update… and we could see sub-₹100 levels.
📈 Upside?
Faces resistance at ₹142–146, followed by ₹155–160 & then ₹165–170. So, short-term upside looks capped.
🔍 Valuation Check:
PE is ~58 😬 (vs 5-year avg of 17),
ROCE ~7% — nearly half of its peers.
📌 Bottom Line:
Too much noise + weak fundamentals = Best to stay away until tariff clarity emerges.
#TataSteel #StockMarket #Tariffs #Investing #NiftyMetals #TradingAlert #StockMarket #bharatelectronics #Investing #MarketUpdate #Stocks #stoxsense #learntradingwithsudhir

PCR analysisPCR (Polymerase Chain Reaction) is a molecular biology technique used to amplify specific DNA sequences, enabling the creation of millions of copies from a small sample, used in various applications like diagnostics, research, and forensics.

Breakout Alert: Tata Steel and Mazagon Dock Power Up for a Surge◉ Tata Steel NSE:TATASTEEL
● The stock price has recently broken out of a falling broadening wedge pattern, signaling a potential upward movement.
● With the government's plans to impose taxes on steel imports, the stock could experience a rally in the near future.
◉ Mazagon Dock NSE:MAZDOCK
● The price has formed a bullish Pole & Flag pattern on the chart.
● Following a fresh breakout, the stock is expected to continue its upward trajectory.

Tata Steel - Swing TradeNSE:TATASTEEL today looked good technically on the back of China announcing that it would restructure its steel industry to cut its total output. The latest move by China is expected to reduce the dumping of cheap steel into the Indian market, which would act as a major positive for domestic steel companies.
About:
NSE:TATASTEEL is Asia's first integrated private steel company set up in 1907. The company has a presence across the entire value chain of steel manufacturing from mining and processing iron ore and coal to producing and distributing finished products. The company has a target to increase domestic steelmaking capacity to 30 MnTPA by 2025.
Trade Steup:
It Made Good Short Term Base on Daily Charts and Taking Support of 50 DSMA and MACD Trending Upwards Now Looking Good for a Swing Trade.
F&O Activity:
Long Buildup Seen in Futures With 140 PE Gaining Significant OI Addition.
Target (Take Profit):
Around 158 for Positional Trader and 200 DSMA for Swing Trader
Stop Loss:
Entry Candle Low for Swing Trader and 50 DSMA for Positional Trader.
📌Thank you for exploring my idea! I hope you found it valuable.
🙏FLLOW for more
👍BOOST if useful
✍️COMMENT Below your views.
Meanwhile, check out my other stock ideas on the right side until this trade is activated. I would love your feedback.
Disclaimer: "I am not SEBI REGISTERED RESEARCH ANALYST AND INVESTMENT ADVISER."
This analysis is intended solely for informational and educational purposes only and should not be interpreted as financial advice. It is advisable to consult a qualified financial advisor or conduct thorough research before making investment decisions.

Tata Steel Potential Breakout Candidate.📈 Tata Steel - Trading Plan
🎯 Trade Setup:
🔹 Entry: ₹159 (Preferably on a daily closing basis)
🔹 Stop Loss (SL): ₹145 (Daily closing basis) (-8.81%)
🔹 Target 1: ₹184 (+15.72%)
🔹 Risk-to-Reward (R:R): 1:1.78
📊 Why This Stock?
✅ Above 50 DMA & Consolidating Above 200 DMA – Signs of strength after prolonged weakness.
✅ Gap Up & Trading Near Resistance – Potential breakout opportunity if volume supports.
✅ Metal Index Breakout – Recently broke out of a base, trading just below 200 DMA.
✅ Weekly Candles Showing Strength – Wide-range candles indicate demand.
✅ Improving RSI – Momentum gaining strength.
⚠️ Risks to Consider
❌ Overall Trend Still Bearish – Market structure remains Lower Highs, Lower Lows.
❌ Metal Index Below 200 DMA – A strong close above it adds more conviction.
❌ Volume Needs Improvement – A breakout without volume can be weak.
📌 Safe Trading Approach
🔹 Ultra Safe Traders: Wait for a weekly close above ₹159.
🔹 Confirmation Traders: Enter only after Metal Index closes above 200 DMA with volume.
🔹 Breakout Traders: Ensure a clean breakout with strong volume before entry.
📢 Disclaimer: This is not a trade recommendation. Please do your own due diligence and manage your risk accordingly. 🚀
