What to do in TCS if we are Holding?What to do in TCS if we are Holding?
Market Sentiment :
- Extremely week: Due to AI disruption Theory
Technical:
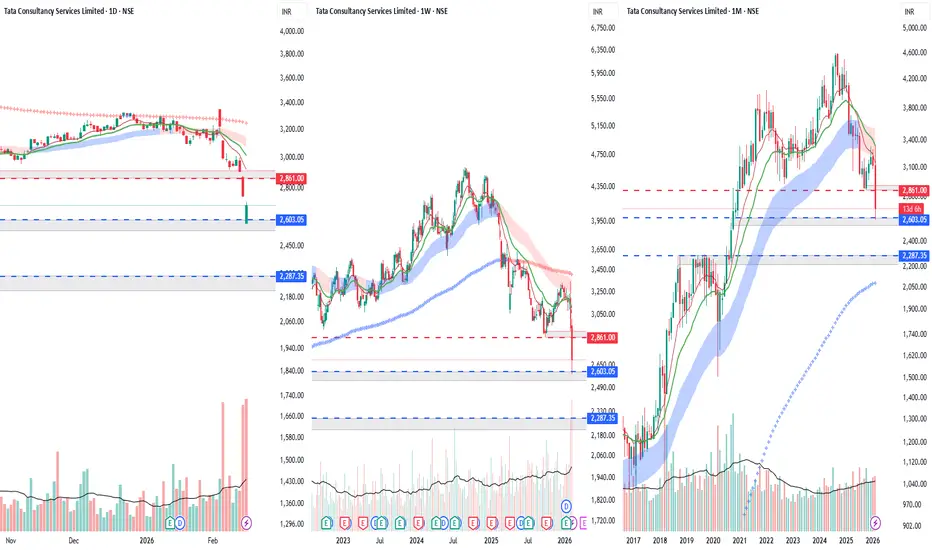
- Extremely Week: Daily, Weekly, Monthly Lower Lows formation
Should We Enter at this Level?
- No New Entry suggested unless we see Daily close above 20EMA
But I am already Hold
Tata Consultancy Services Limited
No trades
Next report date
—
Report period
—
EPS estimate
—
Revenue estimate
—
131.90 INR
485.53 B INR
2.55 T INR
1.02 B
About Tata Consultancy Services Limited
Sector
Industry
CEO
Kunchitham Krithivasan
Website
Headquarters
Mumbai
Founded
1968
IPO date
Aug 25, 2004
Identifiers
2
ISIN INE467B01029
Tata Consultancy Services Limited (TCS) is engaged in providing information technology (IT) services, digital and business solutions. The Company's segments include banking, finance and insurance services (BFSI); manufacturing; retail and consumer packaged goods (CPG); telecom, media and entertainment, and others, such as energy, resources and utilities, hi-tech, life science and healthcare, s-Governance, travel, transportation and hospitality, and other products. Its services portfolio consists of IT and assurance services, business intelligence and performance management, business process services, cloud services, connected marketing solutions, consulting, engineering and industrial services, enterprise solutions, IT infrastructure services, mobility products and services and platform solutions. Its software offerings include Digital Software and Solutions, TCS BaNCS and TCS MasterCraft, among others. It serves industries, including insurance, healthcare, retail, telecom and others.
Related stocks
Derivatives and Options TradingWhat Are Derivatives?
A derivative is a financial contract whose value is derived from an underlying asset. The underlying asset can be:
Stocks
Bonds
Commodities (gold, oil, wheat)
Currencies
Interest rates
Market indexes (like the S&P 500 or Nifty 50)
In simple terms, a derivative does not


TCS 1 Month Time Frame 📌 Approx Current Price (Feb 2026)
• TCS price recently traded around ₹2,700–₹2,950 on NSE.
📉 Important 1-Month Levels — Support (Buy Zones)
• S1 ~ ₹2,910–₹2,915 — first support & pivot area.
• S2 ~ ₹2,880–₹2,880 — secondary support (near recent lows).
• S3 ~ ₹2,840–₹2,850 — deeper support zone if


TCS - Point of accumulation and reversal for Long TermTCS chart showing where price is heading towards on the downside and a promising area to look for Long term accumulation or Swing trade.
Until then its likely best to short it on pull backs for short trades.
But the overall views is on the accumulation zone and to not panic while its falling, at lea

TCS – Heavy Breakdown | Key Support Under Threat Amid IT Sector TCS has witnessed a decisive breakdown, signaling a clear shift in market structure. The recent decline is not just a technical event but aligns closely with the broader weakness seen across the IT sector.
Ongoing pressure from global cues — including uncertainty around US interest-rate cuts, cauti

analysis for tcs on date 16 jan 26 , not tips to buy or sellanalysis done on 16 jan 2026 , only for research analysis to predicts moves and levels, there is no any recomendation to buy and sell on marked lvl its only part of analysis , for any trade taken via watching this analysis will be risky .

Mastering Technical Analysis: From Charts to Consistent Decision1. The Core Philosophy of Technical Analysis
Technical analysis is built on three foundational principles:
Price discounts everything
News, fundamentals, expectations, fear, and greed are all embedded in price. A chart is a real-time emotional record of market participants.
Prices move in trends

TCS - The Last SupperDate 04.02.2026
TCS
Timeframe : Weekly Chart
Revenue Breakup
(1) BFSI : 32.6%
(2) Consumer Business : 15.9%
(3) Life Sciences & Healthcare : 10.9%
(4) Technology & Services : 8.6%
(5) Manufacturing : 8.5%
(6) Communication & Media : 6.9%
(7) Energy, Resources and Utilities : 5.6%
(8) Regional Ma

See all ideas
Summarizing what the indicators are suggesting.
Neutral
SellBuy
Strong sellStrong buy
Strong sellSellNeutralBuyStrong buy
Neutral
SellBuy
Strong sellStrong buy
Strong sellSellNeutralBuyStrong buy
Neutral
SellBuy
Strong sellStrong buy
Strong sellSellNeutralBuyStrong buy
An aggregate view of professional's ratings.
Neutral
SellBuy
Strong sellStrong buy
Strong sellSellNeutralBuyStrong buy
Neutral
SellBuy
Strong sellStrong buy
Strong sellSellNeutralBuyStrong buy
Neutral
SellBuy
Strong sellStrong buy
Strong sellSellNeutralBuyStrong buy
Displays a symbol's price movements over previous years to identify recurring trends.
Frequently Asked Questions
The current price of TCS is 2,708.20 INR — it has decreased by −2.17% in the past 24 hours. Watch Tata Consultancy Services Limited stock price performance more closely on the chart.
Depending on the exchange, the stock ticker may vary. For instance, on BSE exchange Tata Consultancy Services Limited stocks are traded under the ticker TCS.
TCS stock has fallen by −10.02% compared to the previous week, the month change is a −17.54% fall, over the last year Tata Consultancy Services Limited has showed a −31.00% decrease.
We've gathered analysts' opinions on Tata Consultancy Services Limited future price: according to them, TCS price has a max estimate of 4,810.00 INR and a min estimate of 1,775.00 INR. Watch TCS chart and read a more detailed Tata Consultancy Services Limited stock forecast: see what analysts think of Tata Consultancy Services Limited and suggest that you do with its stocks.
TCS stock is 1.82% volatile and has beta coefficient of 1.09. Track Tata Consultancy Services Limited stock price on the chart and check out the list of the most volatile stocks — is Tata Consultancy Services Limited there?
Today Tata Consultancy Services Limited has the market capitalization of 9.74 T, it has decreased by −8.58% over the last week.
Yes, you can track Tata Consultancy Services Limited financials in yearly and quarterly reports right on TradingView.
Tata Consultancy Services Limited is going to release the next earnings report on Apr 15, 2026. Keep track of upcoming events with our Earnings Calendar.
TCS earnings for the last quarter are 37.14 INR per share, whereas the estimation was 36.00 INR resulting in a 3.16% surprise. The estimated earnings for the next quarter are 37.21 INR per share. See more details about Tata Consultancy Services Limited earnings.
Tata Consultancy Services Limited revenue for the last quarter amounts to 670.87 B INR, despite the estimated figure of 668.43 B INR. In the next quarter, revenue is expected to reach 686.96 B INR.
TCS net income for the last quarter is 106.57 B INR, while the quarter before that showed 120.75 B INR of net income which accounts for −11.74% change. Track more Tata Consultancy Services Limited financial stats to get the full picture.
Tata Consultancy Services Limited dividend yield was 1.66% in 2024, and payout ratio reached 44.71%. The year before the numbers were 1.42% and 43.69% correspondingly. See high-dividend stocks and find more opportunities for your portfolio.
As of Feb 16, 2026, the company has 607.98 K employees. See our rating of the largest employees — is Tata Consultancy Services Limited on this list?
EBITDA measures a company's operating performance, its growth signifies an improvement in the efficiency of a company. Tata Consultancy Services Limited EBITDA is 682.86 B INR, and current EBITDA margin is 26.49%. See more stats in Tata Consultancy Services Limited financial statements.
Like other stocks, TCS shares are traded on stock exchanges, e.g. Nasdaq, Nyse, Euronext, and the easiest way to buy them is through an online stock broker. To do this, you need to open an account and follow a broker's procedures, then start trading. You can trade Tata Consultancy Services Limited stock right from TradingView charts — choose your broker and connect to your account.
Investing in stocks requires a comprehensive research: you should carefully study all the available data, e.g. company's financials, related news, and its technical analysis. So Tata Consultancy Services Limited technincal analysis shows the sell today, and its 1 week rating is sell. Since market conditions are prone to changes, it's worth looking a bit further into the future — according to the 1 month rating Tata Consultancy Services Limited stock shows the strong sell signal. See more of Tata Consultancy Services Limited technicals for a more comprehensive analysis.
If you're still not sure, try looking for inspiration in our curated watchlists.
If you're still not sure, try looking for inspiration in our curated watchlists.