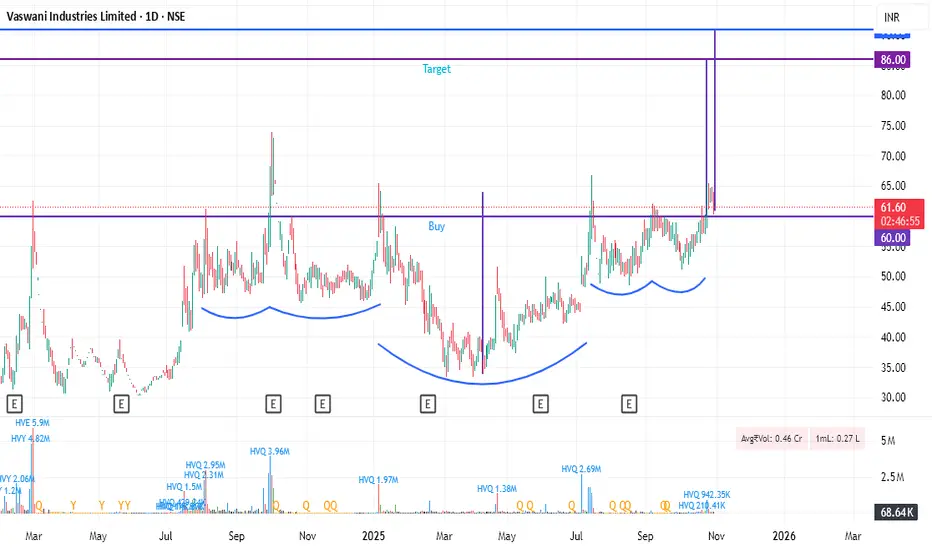
VASWANI LONG - INVERSE H&SVASWANI INDUSTIRES LIMITED is forming inverse head and shoulder pattern on daily and weekly timeframe suggesting a bullish pattern.
The Neckline is around levels 60-65 and once the stock passes these levels, the up move crossing 52w high of 66.84 and ATH levels of 73.88.
A lot of investors and t
3.38 INR
86.04 M INR
4.12 B INR
13.06 M
About Vaswani Industries Limited
Sector
Industry
Website
Headquarters
Raipur
Founded
2003
ISIN
INE590L01019
FIGI
BBG00171QW62
IPO date
Apr 29, 2011
IPO offer price
1.11 USD
Vaswani Industries Ltd. engages in the manufacture of sponge iron, steel billets, ingots and power generation. It operates through the following segments: Iron and Steel, Power, Real Estate, and Agri Division. The Iron and Steel segments includes sponge iron for making steel billets and ingots. The Power segment involves power generation from waste heat recovery boilers and atmospheric fluidization bed combustion boilers. The company was founded on July 22, 2003 and is headquartered in Raipur, India.
Related stocks
Vaswani Industries LtdVASWANI – The stock is currently trading within an ascending channel pattern and is consolidating near the upper resistance of the channel.
A bullish Marubozu formed a solid green candle with little to no wick, indicating strong buying pressure. Additionally, a bullish engulfing candle fully cover

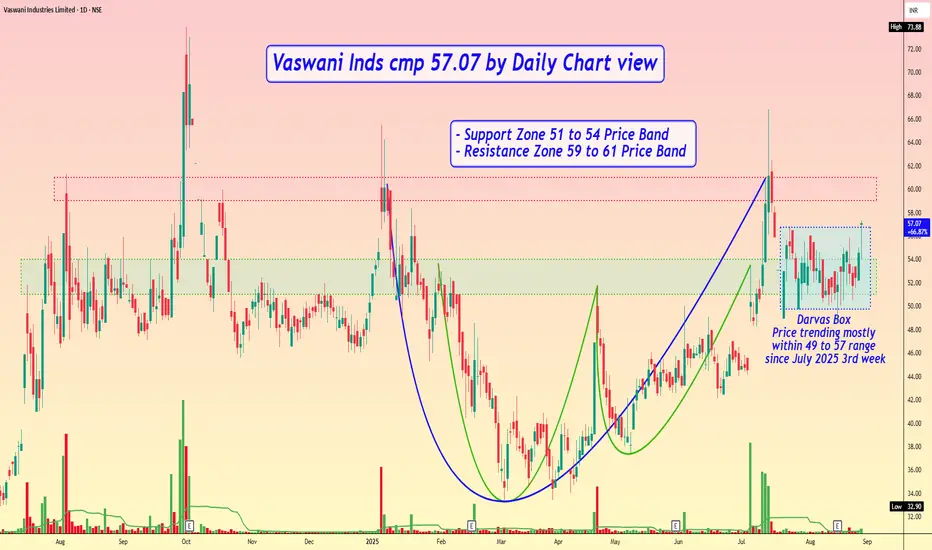
Vaswani Inds cmp 57.07 by Daily Chart viewVaswani Inds cmp 57.07 by Daily Chart view
- Support Zone 51 to 54 Price Band
- Resistance Zone 59 to 61 Price Band
- Volumes are in good sync with average traded quantity
- Bullish Rounding Bottoms made by Support Zone neckline
- Another Large Bullish Rounding Bottom made by Resistance Zone neckli
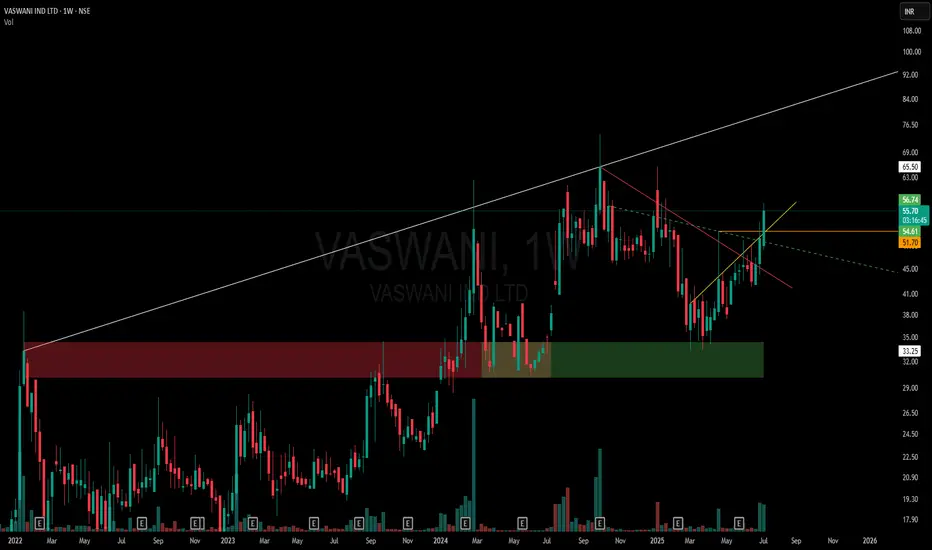
One-Sided Broadening Pattern | Pure Price Action Storytelling🔹 White Line: Captures the expanding higher-high resistance zone — part of the broader one-sided broadening pattern. Each new high is breaching the prior, giving the top side its expanding identity.
🔹 Horizontal Zone (Red to Green Shift): What once acted as a strong supply zone now flipped to a dem
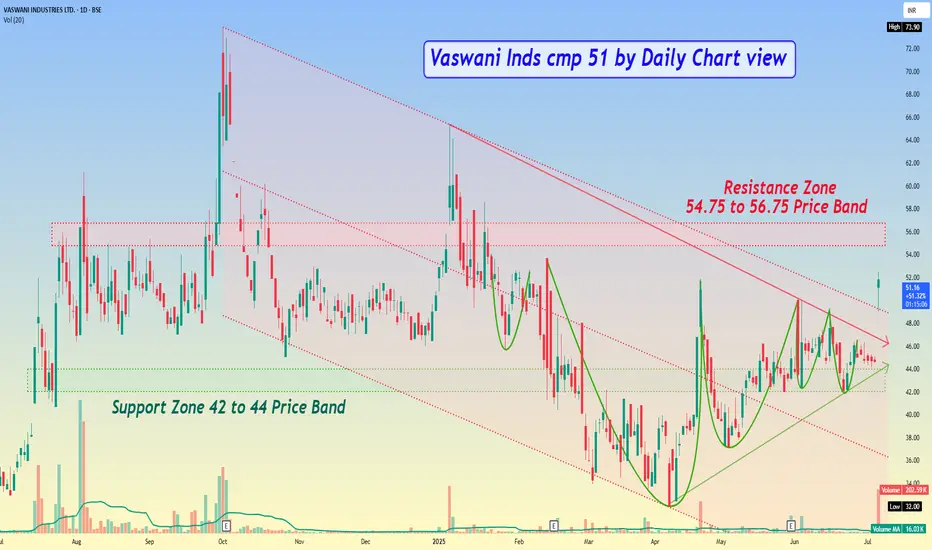
Vaswani Inds cmp 51 by Daily Chart viewVaswani Inds cmp 51 by Daily Chart view
- Support Zone 42 to 44 Price Band
- Resistance Zone 54.75 to 56.75 Price Band
- *Falling Parallel Price Channel Breakout done today*
- Bullish Rounding Bottoms with considerate VCP pattern too
- Heavy Volumes surge today way above average traded quantity
-
Vawani Ind C&H Break outTis Scrip has consolidated for long under cup and Handle pattern and has given a break out of the Handle.
Trade can be initiated once it crosses today's High.
Target and SL are given in Chart.

VASWANI1. Trend: Bullish
2. Set up: Rounding pattern Breakout
3. Strength: Strong (UC today)
4. RR: Lucrative

Bullish Breakout for this stock the stock has broken out of the all time high level of 38.45 . Today the stock had hit an upper circuit of 55.05 , we can expect more upward momentum in the coming days .

See all ideas
Summarizing what the indicators are suggesting.
Oscillators
Neutral
SellBuy
Strong sellStrong buy
Strong sellSellNeutralBuyStrong buy
Oscillators
Neutral
SellBuy
Strong sellStrong buy
Strong sellSellNeutralBuyStrong buy
Summary
Neutral
SellBuy
Strong sellStrong buy
Strong sellSellNeutralBuyStrong buy
Summary
Neutral
SellBuy
Strong sellStrong buy
Strong sellSellNeutralBuyStrong buy
Summary
Neutral
SellBuy
Strong sellStrong buy
Strong sellSellNeutralBuyStrong buy
Moving Averages
Neutral
SellBuy
Strong sellStrong buy
Strong sellSellNeutralBuyStrong buy
Moving Averages
Neutral
SellBuy
Strong sellStrong buy
Strong sellSellNeutralBuyStrong buy
Displays a symbol's price movements over previous years to identify recurring trends.
Frequently Asked Questions
The current price of VASWANI is 54.36 INR — it has decreased by −3.69% in the past 24 hours. Watch Vaswani Industries Limited stock price performance more closely on the chart.
Depending on the exchange, the stock ticker may vary. For instance, on BSE exchange Vaswani Industries Limited stocks are traded under the ticker VASWANI.
VASWANI stock has risen by 2.22% compared to the previous week, the month change is a −13.78% fall, over the last year Vaswani Industries Limited has showed a 11.51% increase.
VASWANI reached its all-time high on Oct 1, 2024 with the price of 73.90 INR, and its all-time low was 1.47 INR and was reached on Feb 26, 2014. View more price dynamics on VASWANI chart.
See other stocks reaching their highest and lowest prices.
See other stocks reaching their highest and lowest prices.
VASWANI stock is 5.49% volatile and has beta coefficient of 0.83. Track Vaswani Industries Limited stock price on the chart and check out the list of the most volatile stocks — is Vaswani Industries Limited there?
Today Vaswani Industries Limited has the market capitalization of 1.77 B, it has increased by 12.20% over the last week.
Yes, you can track Vaswani Industries Limited financials in yearly and quarterly reports right on TradingView.
VASWANI net income for the last quarter is 13.43 M INR, while the quarter before that showed 54.71 M INR of net income which accounts for −75.45% change. Track more Vaswani Industries Limited financial stats to get the full picture.
No, VASWANI doesn't pay any dividends to its shareholders. But don't worry, we've prepared a list of high-dividend stocks for you.
As of Nov 27, 2025, the company has 328 employees. See our rating of the largest employees — is Vaswani Industries Limited on this list?
EBITDA measures a company's operating performance, its growth signifies an improvement in the efficiency of a company. Vaswani Industries Limited EBITDA is 295.61 M INR, and current EBITDA margin is 6.10%. See more stats in Vaswani Industries Limited financial statements.
Like other stocks, VASWANI shares are traded on stock exchanges, e.g. Nasdaq, Nyse, Euronext, and the easiest way to buy them is through an online stock broker. To do this, you need to open an account and follow a broker's procedures, then start trading. You can trade Vaswani Industries Limited stock right from TradingView charts — choose your broker and connect to your account.
Investing in stocks requires a comprehensive research: you should carefully study all the available data, e.g. company's financials, related news, and its technical analysis. So Vaswani Industries Limited technincal analysis shows the sell today, and its 1 week rating is neutral. Since market conditions are prone to changes, it's worth looking a bit further into the future — according to the 1 month rating Vaswani Industries Limited stock shows the buy signal. See more of Vaswani Industries Limited technicals for a more comprehensive analysis.
If you're still not sure, try looking for inspiration in our curated watchlists.
If you're still not sure, try looking for inspiration in our curated watchlists.