Veranda learning solutions Let's dive into the **technical analysis** of **Veranda Learning Solutions Ltd.** based on typical technical indicators. Since I don't have live market data, I'll guide you through a structured analysis framework. You can use real-time data from a stock charting tool to apply these indicators.
---
### **Technical Analysis of Veranda Learning Solutions Ltd. (VERANDA)**
#### **1. Support and Resistance Levels**
- **Support Levels:**
- These are price zones where the stock has historically found buying interest or has reversed direction.
- **Example Support Levels:** Look for recent lows. If Veranda Learning has recently bounced at ₹250 or ₹230, these could be key support levels. If the price breaks below these, it may signal further downside risk.
- If the stock is approaching these levels and starts to bounce back, these can act as buy signals.
- **Resistance Levels:**
- Resistance is where the stock has faced selling pressure in the past. If the stock has faced difficulty breaking through ₹280, ₹290, or ₹300, these levels could act as resistance.
- A breakout above these resistance levels could signal strong bullish momentum.
#### **2. Moving Averages (MA)**
- **50-day Moving Average (MA):**
- The 50-day moving average helps assess short-term price trends. If the stock is trading above this level, it generally indicates bullish momentum in the short term.
- **Example:** If the stock is at ₹270 and the 50-day MA is ₹265, this would signal short-term bullishness.
- **200-day Moving Average (MA):**
- The 200-day moving average is used for identifying the long-term trend. If the stock is trading above it, it suggests a long-term bullish trend. If below, the stock may be in a long-term downtrend.
- **Example:** If the stock is at ₹270 and the 200-day MA is at ₹260, it confirms a long-term bullish trend.
#### **3. RSI (Relative Strength Index)**
- **RSI Levels:**
- **Above 70:** Indicates the stock is potentially overbought, suggesting a pullback or consolidation could occur.
- **Below 30:** Indicates the stock is potentially oversold, suggesting it may be due for an upward move or reversal.
- **Current Example:**
- If the RSI is **above 70**, the stock could be in overbought territory, suggesting it might face a correction.
- If the RSI is **below 30**, it suggests oversold conditions, potentially indicating a buying opportunity.
#### **4. MACD (Moving Average Convergence Divergence)**
- **Bullish Signal:** When the MACD line crosses above the signal line, it suggests bullish momentum.
- **Bearish Signal:** When the MACD line crosses below the signal line, it suggests bearish momentum.
- **Current Example:**
- If the MACD is currently above the signal line, it signals potential upward momentum for the stock.
- If the MACD is below the signal line, it might indicate a downtrend or consolidation.
#### **5. Volume Analysis**
- **Increasing Volume:** When the stock rises with increasing volume, it suggests strong buying interest, confirming the trend.
- **Decreasing Volume:** If the stock rises or falls with decreasing volume, it may signal weakening momentum, either bullish or bearish.
- **Current Example:**
- If Veranda Learning is rising with increasing volume, it confirms the strength of the upward move.
- If the stock price rises but volume is decreasing, it could suggest that the rally is losing momentum and may not be sustainable.
#### **6. Candlestick Patterns**
- **Bullish Patterns:** Look for **Hammer**, **Bullish Engulfing**, or **Morning Star** patterns during a downtrend. These could signal a reversal to the upside.
- **Bearish Patterns:** Patterns like **Shooting Star**, **Evening Star**, or **Bearish Engulfing** near resistance could signal a reversal to the downside.
- **Current Example:**
- If a **Bullish Engulfing** pattern forms near a support level, it may signal a reversal to the upside.
- If a **Shooting Star** or **Evening Star** forms near a resistance level, it could indicate a potential reversal to the downside.
#### **7. Fibonacci Retracement Levels**
- Fibonacci retracement levels are often used to identify potential support or resistance areas during pullbacks or price corrections. Key levels include **23.6%, 38.2%, 50%,** and **61.8%**.
- **Current Example:**
- If the stock has moved from ₹230 to ₹300, check for retracement levels. The **38.2% retracement** might be around ₹280, and the **50% retracement** could be around ₹265.
- These levels could act as support during a pullback if the stock is in an uptrend.
---
**Disclaimer:**
- I am not a SEBI-registered professional or licensed financial advisor.
- All analysis, recommendations, and opinions provided are based solely on historical price data, patterns, and general market trends.
- Any action you take on the basis of this information is at your own risk. Please consult with a licensed financial advisor before making any investment decisions.
- Technical analysis cannot guarantee future results and may not be accurate in predicting market movements.
- Market conditions and stock prices can be influenced by many factors, including external events, news, and economic data, which are beyond the scope of this analysis.
VERANDA trade ideas
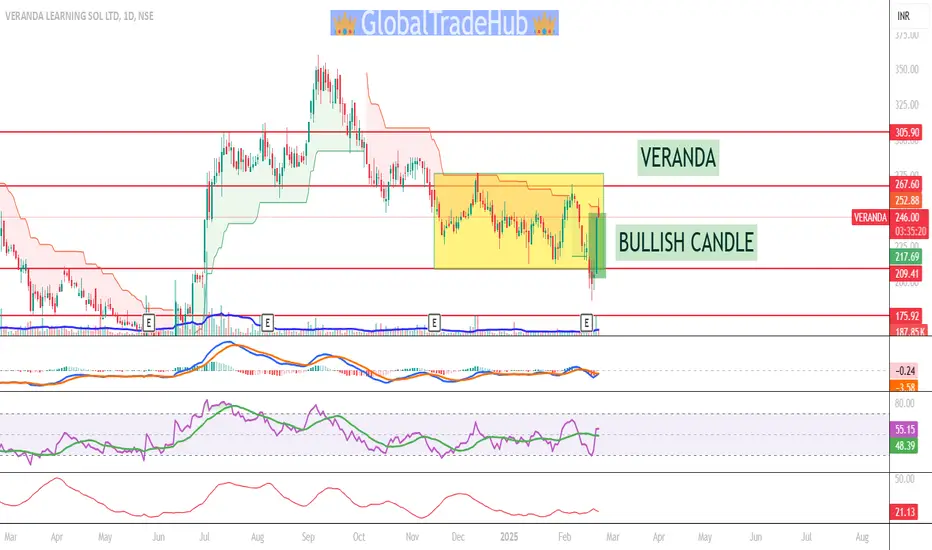
VERANDA - Breakout and RetestPrice breakout triangle and came back inside the triangle and it formed hammer like candle now (Weekly Timeframe). We should consider entering a trade only if a strong green candle forms in the next session. On the daily timeframe, it appears to be forming a morning star-like structure.

VERANDA LEARNING SOL - Swing TradeForming Triangle structure since 2022 and it breakout this month and price is near all time high. We can enter now or wait for price drop. SL should be 300.
Disclaimer: This is for education purpose only

HEAD AND SHOULDER ,CHANNEL OR BOX PATTERN 1W - Head & Shoulder
1M - Channel or Box Pattern
If they break the channel or box, then good movement upside

VERANDA Giving a Good BreakotVeranda Learning Solutions Ltd. engages in the sale of comprehensive learning programs. It offers training programs in test preparation for all competitive exams in India and abroad. The company was founded on November 21, 2018 and is headquartered in Chennai, India.
Keep Stoploss at 278 and I'm for a first target of 10% and the Trail it with 10 or 20 EMA...

VERANDA Approaching Breakout from Descending Channel
✅ The stock has been trading within a descending channel, with the price now approaching the upper boundary near 300. A breakout above this trendline could signal a reversal of the downtrend.
✅ The RSI is trending upwards around 66, indicating growing bullish momentum. The recent price action suggests a potential shift in market sentiment.
✅ If the stock breaks above the upper trendline, it could target higher levels, with 350 as a potential resistance. Traders should look for a confirmed close above the trendline to validate the breakout.

Resistance Breakout - VERANDAPlease look into the chart for a detailed understanding.
Consider these for short-term & swing trades with 2% profit.
For BTST trades consider booking
target for 1%-2%
For long-term trades look out for resistance drawn above closing.
Please consider these ideas for educational purpose
Please note that, if there are some big targets, those are drawn thinking for long term.

Trend Reversal!! Stage 2 Uptrend!!🟢1W charts indicate capitulation & volume explosion near 180
🟢Veranda taken support @166 & has entered stage two uptrend
🟢It has given buy signal at 198.85 on VSA Momentum indicator.
🟢Will buy at CMP & add more on declines near 176. SL= 159 WCB
🟢Above neckline resistance of 224 it will start fresh uptrend

BUY TODAY SELL TOMORROW for 5% DON’T HAVE TIME TO MANAGE YOUR TRADES?
- Take BTST trades at 3:25 pm every day
- Try to exit by taking 4-7% profit of each trade
- SL can also be maintained as closing below the low of the breakout candle
Now, why do I prefer BTST over swing trades? The primary reason is that I have observed that 90% of the stocks give most of the movement in just 1-2 days and the rest of the time they either consolidate or fall
Trendline Breakout in VERANDA
BUY TODAY SELL TOMORROW for 5%

VERANDA- Look for short termBuy 200-208,
Keep SL- 190 on closing basis.
Target-230,240,250
Note:- Only for educational purposes.

BUY TODAY SELL TOMORROW for 5%DON’T HAVE TIME TO MANAGE YOUR TRADES?
- Take BTST trades at 3:25 pm every day
- Try to exit by taking 4-7% profit of each trade
- SL can also be maintained as closing below the low of the breakout candle
Now, why do I prefer BTST over swing trades? The primary reason is that I have observed that 90% of the stocks give most of the movement in just 1-2 days and the rest of the time they either consolidate or fall
Trendline Breakout in VERANDA
BUY TODAY SELL TOMORROW for 5%


veranda close is important weekly chartkeep this chart on ur list if closes above marked levels on friday on weekly charts
consider it as buying above 215 levels weekly chart close
stop loss is most imp even more then target so dont forgot to keep below 175
do follow for more learning

Keep eyes on VERANDAPrice making L L while Rsi making H H and also price break the resistance down trend line and price close above this line after touching 35+ times. Price can go upside from these levels.THIS IS ONLY FOR EDUCATION PURPOSE. Kharedne se pehele apna analysis kare.

Double bottom pattern || Veranda LearningStock has taken a support and formed a double bottom or W pattern. Buy at CMP of 285 with a target of 330 and SL at 260. A 1:2 risk reward ratio!

VERANDA - Ichimoku Bullish Breakout Stock Name - Veranda Learning Solutions Ltd
Ichimoku Cloud Setup :
1). Today's close is above the Conversion Line
2). Future Kumo is Turning Bullish
3). Chikou span is slanting upwards
All these parameters are showing bullishness at Current Market Price
and more bullishness AFTER crossing 318
#This is not Buy and Sell recommendation to any one. This is for education purpose and a helping hand to learn trading in Market.
# Cloud Trading
# Ichimoku Cloud
# Ichimoku Followers
I hope you all like my analysis.
Please do share your thoughts into comment section.
Please give a like, it motivates me to do analysis.

VERANDA - Ichimoku Bullish Breakout Stock Name - Veranda Learning Solutions Ltd
Ichimoku Cloud Setup :
1). Today's close is above the Conversion Line
2). Future Kumo is Turning Bullish
3). Chikou span is slanting upwards
All these parameters are showing bullishness at Current Market Price
and more bullishness AFTER crossing 303.
#This is not Buy and Sell recommendation to any one. This is for education purpose and a helping hand to learn trading in Market.
# Cloud Trading
# Ichimoku Cloud
# Ichimoku Followers
I hope you all like my analysis.
Please do share your thoughts into comment section.
Please give a like, it motivates me to do analysis.
