V-Mart Retail LtdDate 11.03.2025
V-Mart Retail
Timeframe : Weekly
Technical Remarks :
1 Currently under corrective phase of wave c
2 Between 2800-2400 is very good buy zone for mid term to long term holding
3 Currently at make or break zone having 200 weekly exponential moving average + support & resistance zone
4 Could bounce from here as well, for traders they can keep same stoploss as mentioned at point 4 & can go for long side trade
About Company :
Revenue Mix
V-Mart: 84%
Unlimited: 15%
Lime Road: 1%
Category-wise Revenue Mix
Apparel: 80%
Non-Apparel: 10%
FMCG: 10%
Store Counts
Tier 1 City: 110
Tier 2: 55
Tier 3: 263
Tier 4: 60
Key statistics
1 Monthly Footfall – 3.6Mn across 488 stores
2 Registered Customer Base – 34Mn (Offline First)
3 Channel Sales Mix – 98% offline, 2% online
4 Metros / Tier 1 : Non-Metros – 30% : 70%
Holding Pattern
Promoter 44.29%
DII 32.45 %
FII 17.32 %
Public 5.94 %
Regards,
Ankur
V-Mart Retail Ltd
No trades
Trade ideas

Diwali Muhurat Pick - VMartDiwali Pick -1 -- VMart ::
Multiyear Breakout in progress and currently consolidating
Breaking out 4580 levels can fetch 10 to 20 percent possible upmove

VMART GOOD FOR SWING VMART good above 4500 on Closing Basis.
Momentum indicators are Bullish.
Taken support From Trendline on Daily Time Frame.
Weak Below 4200 on CLB.
Ready For Upside 5000-5500+
For Educational Purpose only.

Flag and Pole Pattern in V-mart RetailNSE:VMART a Flag and Pole pattern is forming in V-mart Retail, it is in an Uptrend Currently and High Possibility that it will break the pattern and continue the upward trend.
If a Bullish flag pattern Breaks Out above 4500, the stock may move toward the pattern target after the breakout which is 5420. Keep a Stop Loss of 4050.
NSE:VMART is engaged in the business of Value Retailing through the chain of stores situated in various cities in India. It will Announce results in a few days of Q2
🙋♀️🙋♂️If you have any questions about this stock, feel free to reach out to me.
📌Thank you for exploring my idea! I hope you found it valuable.
🙏FLLOW for more
👍BOOST if useful
✍️COMMENT Below your views.
Meanwhile, check out my other stock ideas below until this trade is activated. I would love your feedback.
Disclaimer: This analysis is intended solely for informational and educational purposes and should not be interpreted as financial advice. It is advisable to consult a qualified financial advisor or conduct thorough research before making investment decisions.

VMART Long IDEAVMART broke channel and now making Invested H&S.
It is in accumulation stage, good time to take pilot postion for Long term Investors.
Targets are given in chart
VMart - Breakout - Crucial levelsVMart : Long term
Weekly Flag Breakout
At resistance zone, sustaining 4500 levels would take this to much newer heights

VIEW ON VMART RETAILRecord high closing
In spite of market today's fall stock has closed in green
If it gets at lower levels then accumulate it
Target 4200
Stop loss 3910
I am just representing my views
For educational purpose only.

Short Term Trading Idea in V-Mart Retail for 15% UpsideHi,
NSE:VMART has given a Bullish Flag Breakout on Daily charts with very good volume.
MACD is also on the bullish side on Daily, Weekly and Monthly time frames. RSI is also on the bullish side on daily, weekly and monthly time frames.
In the current market scenario, I am expecting that the bullish momentum will continue.
Complete price projection like entry, stop loss and targets mentioned on the charts for educational purpose.
Don't Forget to Follow me to get all the updates.
Please share your feedback or any queries on the study.
Disclaimer: Please consult your financial advisor before making any investment decision.

VMARTThe stock is giving a solid comeback from the bear grip. Enter with a small qty
NOTE: I'm not a SEBI REG. Study before investing.


VMART - good above 2400 VMART - can this be the new age DMART ?
Well that we will learn with time, however looking at other consumption stocks
this stock may see traction post budget.
One can enter between 2400 to 2600 and average up on its way ahead.
Strict Stop Loss of 2350
It also has given multiyear RSI breakout.
Disclaimer : Educational content. Budget theme. Exercise caution and do your own research !!


Investment/Trade Idea in V-Mart Retail Ltd.(weekly Chart)Buy @ CMP , Sl @ 1595 , Target @ 4000
Q4FY22 result:
V-Mart’s results were a mixed bag wherein revenue was below our estimates while profitability was better than anticipated.
On a favourable base, revenue grew 30% YoY to ₹ 458.8 crore. Newly acquired 74 Unlimited Stores in September contributed 16% to Q4 sales.
Gross margins improved 510 bps YoY to 34.9% owing to lower discounting and timely price hikes taken (~15-17%) to offset RM inflation. Higher employee and other expense due to integration of Unlimited format led to 140 bps expansion in EBITDA margins to 11.0%.
Higher depreciation and interest expense owing to integration of Unlimited business led the company to report a net loss of ₹ 2.6 crore.
Shareholding pattern (in %) Mar 23 Jun 23 Sep 23 Dec 23
Promoters 44.3 44.3 44.3 44.3
FII 14.2 14.8 14.3 14.3
DII 28.9 28.6 29.7 31.5
Others 12.6 12.3 11.7 9.8
N.B : I wanted to emphasize that the views I express are strictly personal and should not be construed as advice. It is crucial to consult with your financial advisor before making any trades or investment decisions. The complexity and unpredictability of financial markets underscore the importance of seeking professional guidance tailored to your individual financial circumstances and goals.


reverse head and shoulderThis chart formed reverse head and shoulder pattern we will wait for breakout with huge volume.

Long term invest
Pure price action buying signal after very long time ago this stock shown the uptrend also given the day candle close on 200 moving average

VMart is looking very strongIn this Bear market vmart is looking strong
rsi breakout
ema supporting
very high volume in lower time frame

Vmart bull harmonic It just technical view ,
Rsi divergence and harmonic gartely 886
1590 around harmonic completed,
This harmonic now activated.
T1 - 2028
T2 - 2250

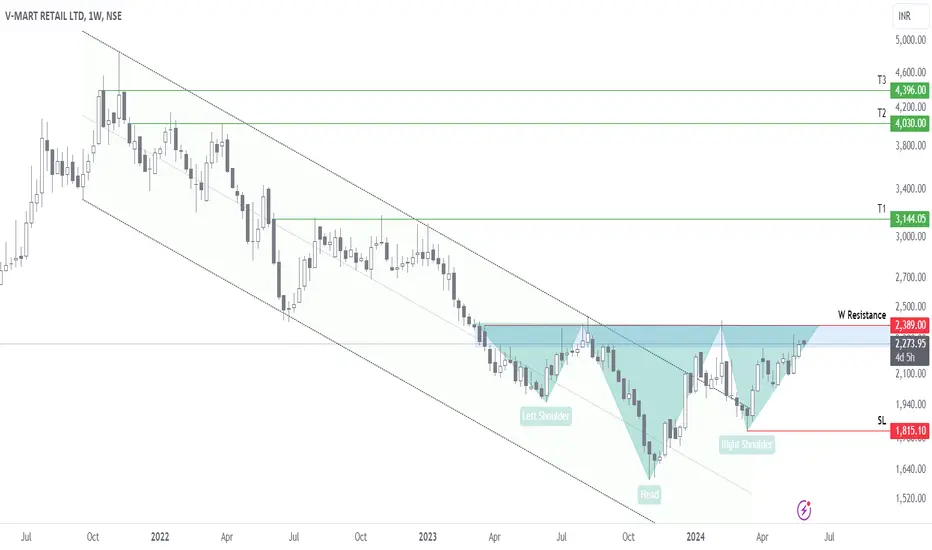
V-MART Corrective dip and Long term Consolidation VMART has retraced to 2/3rd Levels from its ATH and currently forming its potential right Shoulder on long term charts with neck line at multi month Support area. VMART has also established reversal as it could build momentum in primary uptrend channel. This hints that price can reach and test long term 1/2 retracement zone in near term with targets of 2473.45 which can give 35% swing trade opportunities from current price levels.

VMART: Going against Index trendWhen Indices are making new highs, it is going down. There seems no chance of going it up significantly before August 2024. It will bounce back either after touching lows made during COVID Lockdown or it reaches to its 2014-2017 levels.

vmart intadayvmart looking good creating bullish price action with higher low that sign of strenth make resistane on 1700 above 1700 it will going up

Positional or Longterm Opportunity in VMartGo Long above 2184.1 for Targets of 2874.25, 3334.35, and 3564.4 with SL 1954.05
Reasons to go Long :
1. On a Weekly timeframe if we draw the Fibonacci retracement tool from the recent swing low (point A) to the recent swing high (point B) then we see stock took support from the 0.618 Fibonacci level.
2. In addition to this a bullish candlestick pattern Bullish Engulfing pattern is formed around the 0.618 Fibonacci level.
3. Also there is a strong Trendline (marked with green color), from which the stock is taking support and moving up.

VMART - Reversal on the cardsVmart - Price action suggests reversal.
Looks good for short to medium term.
Can be added on dips.
SL 2050
Tgt 2500/3000+
