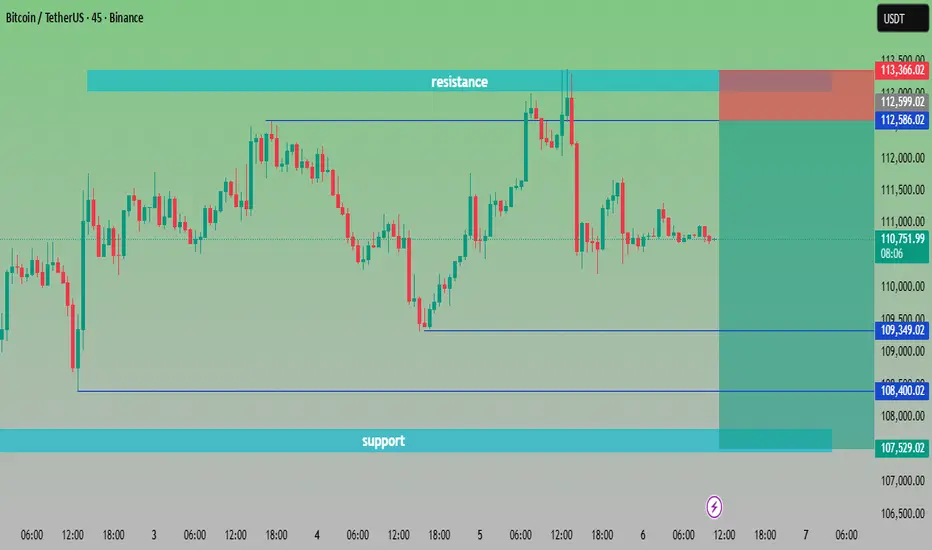
“BTC/USDT at Crossroads | Key Levels to Watch🔎 Chart Analysis – BTC/USDT (45m)
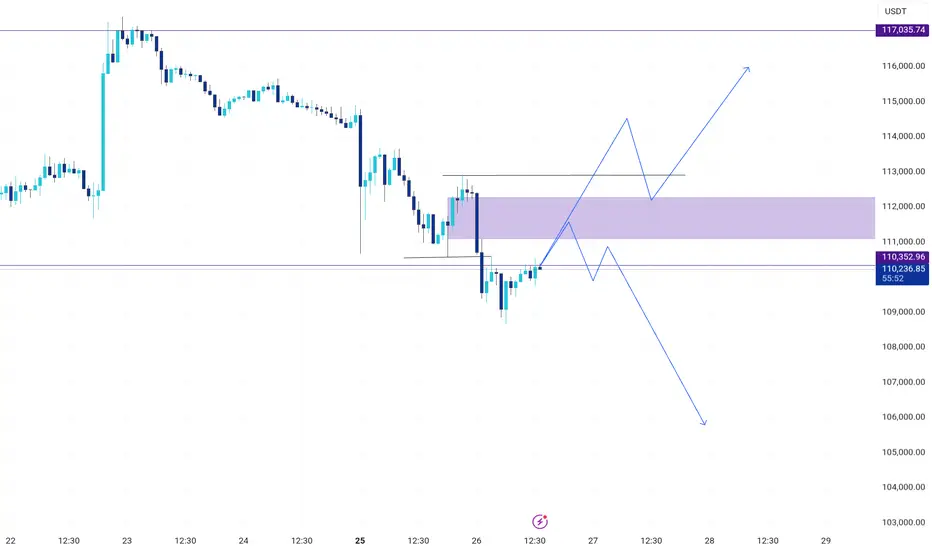
Resistance Zone: Around 112,586 – 113,200 USDT. Price has tested this area multiple times but failed to break out, confirming strong selling pressure.
Support Zone: Around 107,529 – 108,400 USDT. Buyers have consistently defended this zone, making it a key demand area.
Current Price: 110,720 USDT, sitting in the middle of support and resistance.
📌 Scenarios:
Bullish Case 🟢🚀 – If BTC breaks above 112,586 USDT, momentum could push toward 113,500+ USDT.
Bearish Case 🔴📉 – If BTC fails to hold 109,349 USDT, price may retest the deeper support around 107,500 USDT.
⚖️ Trading Plan Idea:
Long Entry: Above 112,600 breakout ✅
Short Entry: Below 109,300 breakdown ❌
Target Zones:
Upside 🎯 → 113,500+
Downside 🎯 → 107,500
BTCDOWNUSDT trade ideas
Part 2 Master Candlestick PatternTypes of Options and Market Participants
1. Call Options (Right to Buy)
A Call Option gives the holder the right to buy an asset at a strike price. Investors use calls when they expect prices to rise.
Example: Buying a TCS ₹3,000 Call at ₹100 premium means you profit if TCS rises above ₹3,100 before expiry.
2. Put Options (Right to Sell)
A Put Option gives the holder the right to sell at a strike price. Used when expecting prices to fall.
Example: Buying Infosys ₹1,500 Put at ₹50 premium pays off if Infosys drops below ₹1,450.
3. Option Market Participants
Hedgers: Reduce risk by using options as insurance. (e.g., farmer hedging crop price, or investor protecting stock portfolio).
Speculators: Bet on price movements to earn profits.
Arbitrageurs: Exploit price differences across markets.
Writers (Sellers): Earn premium by selling options but take on higher risks.
Psychology & Discipline in Option Trading
Trading is not just math. It’s mindset.
Fear of Missing Out (FOMO): Leads to impulsive trades.
Over-Leverage: Options tempt traders with small premiums, causing overtrading.
Discipline: Setting stop-loss, position sizing, and risk management is crucial.
Patience: Most successful option traders focus on probability, not prediction.

[SeoVereign] BITCOIN BEARISH Outlook – September 03, 2025Let me first take a look at the situation of Bitcoin.
Currently, the situation of Bitcoin is not very good.
These days, it has been continuing to decline, based on 124,400.
Unfortunately, I expect there will be a little more decline this time as well.
The first is the double top.
If you check around 111,760, you can see that a double top has formed.
Accordingly, we can expect a downward trend, and since the bottom trigger in between has also broken downward, I believe this has been clearly confirmed.
The second is that the arbitrary wave M wave is forming a length ratio of 1.618 of the N wave.
This part could be carefully counted by attaching names according to Elliott Wave theory, but as those who have been reading my articles for a long time would know, I consciously do not count waves in detail.
I judge that focusing only on the length ratio is better.
The third is the downward break of the trendline.
The trendline refers to the trendline that can be found when connecting 108,400 and 110,240.
Since this trendline has been broken downward, I think Bitcoin could see a short-term decline.
Lastly, although it is not certain so it is a bit ambiguous to say, the movement that has been forming since August 29 at 21:30 could be seen as a Shark pattern.
This part is somewhat ambiguous to define as a harmonic because the range is formed ambiguously, but I thought it would be better to write it down, so I am informing you.
By comprehensively judging the above matters, I estimated the final TP to be around 107,778.
All the grounds in this article have been carefully drawn on the chart, so I think there will be no significant difficulty in reading.
I will continue to track this idea, and as the movement develops, I will deliver additional information to you through updates of this idea.
Thank you for reading.

Inflation and Its Impact on Markets1. Understanding Inflation
1.1 Definition
Inflation is the rate at which the general level of prices for goods and services rises, eroding the purchasing power of money. If the inflation rate is 6% annually, an item costing ₹100 this year will cost ₹106 the next year, assuming all else remains equal.
1.2 Causes of Inflation
Economists generally classify inflation into two broad categories:
Demand-Pull Inflation – Occurs when aggregate demand in an economy outpaces aggregate supply. Example: rising consumer spending, government expenditure, or investment that pushes up prices.
Cost-Push Inflation – Triggered when production costs rise (e.g., due to higher wages, raw material costs, or supply chain disruptions), and businesses pass these costs onto consumers.
Other causes include monetary expansion (too much money chasing too few goods), structural bottlenecks, taxation policies, or geopolitical crises that disrupt supply chains.
1.3 Types of Inflation
Creeping Inflation: Mild (1–3% annually), often seen as healthy for growth.
Walking Inflation: Moderate (3–10% annually), may start hurting purchasing power.
Galloping Inflation: Double-digit inflation, destabilizes economies.
Hyperinflation: Prices rise uncontrollably (e.g., Zimbabwe, Venezuela).
Stagflation: Inflation combined with stagnation in economic growth and high unemployment (1970s U.S. example).
Deflation: Persistent fall in prices, often damaging as it discourages spending and investment.
1.4 Measuring Inflation
Common indicators include:
Consumer Price Index (CPI): Tracks retail prices of a basket of goods and services.
Wholesale Price Index (WPI): Measures price changes at the wholesale level.
Producer Price Index (PPI): Monitors prices from the producer’s perspective.
GDP Deflator: Broader measure of inflation in an economy.
2. Inflation and Its Impact on Financial Markets
Inflation has a multi-dimensional impact on different segments of financial markets. Let’s examine them one by one.
2.1 Impact on Stock Markets
Stocks represent ownership in companies, and inflation affects corporate earnings, investor sentiment, and valuation multiples.
Corporate Profits:
Rising inflation increases costs of raw materials, wages, and borrowing. If companies cannot pass these costs to consumers, their profit margins shrink.
Valuation Multiples:
Higher inflation leads to higher interest rates (central banks hike rates to control inflation). As rates rise, the present value of future cash flows declines, leading to lower stock valuations (P/E ratios fall).
Sectoral Impact:
Winners: Commodity producers (oil, metals, agriculture), energy firms, FMCG companies with strong pricing power.
Losers: Consumer discretionary, technology, and financials (due to margin pressure and higher cost of capital).
Investor Sentiment:
Inflation creates uncertainty. Equity markets often turn volatile during inflationary phases as investors reassess growth prospects.
Example: In the 1970s U.S., inflation was extremely high due to oil shocks, and stock markets delivered poor real returns.
2.2 Impact on Bond Markets
Bonds are highly sensitive to inflation because they provide fixed income.
Interest Rates and Yields: When inflation rises, central banks raise policy rates. This pushes bond yields up, causing bond prices to fall.
Real Returns: Inflation erodes the real return of fixed-income instruments. For example, if a bond yields 5% but inflation is 7%, the real return is –2%.
Inflation-Indexed Bonds: Governments issue instruments like TIPS (Treasury Inflation-Protected Securities) in the U.S. or Inflation-Indexed Bonds in India to protect investors.
Conclusion: High inflation is generally negative for bondholders, except for inflation-linked securities.
2.3 Impact on Currency Markets
Inflation has direct implications for currency values in the forex market.
Currency Depreciation: High inflation erodes purchasing power and often leads to depreciation of a country’s currency.
Interest Rate Differential: Central banks raise rates to curb inflation, which can temporarily strengthen a currency due to higher returns on domestic assets.
Trade Balance: Inflation makes exports costlier and imports cheaper, widening trade deficits, further pressuring the currency.
Example: Turkish lira has depreciated sharply in recent years due to persistently high inflation.
2.4 Impact on Commodity Markets
Commodities as Hedge: Commodities like gold, oil, and agricultural goods often perform well during inflationary periods, as they are tangible assets.
Input Cost Pressures: Rising commodity prices themselves fuel inflation, creating a feedback loop.
Energy Prices: Oil price shocks are among the most common triggers of global inflation.
2.5 Impact on Real Estate
Real estate is often seen as a hedge against inflation.
Positive Effects: Property values and rental incomes tend to rise with inflation, protecting investors.
Negative Effects: High interest rates increase mortgage costs, reducing affordability and slowing demand.
Commercial Real Estate: Long-term leases may lag inflation, impacting yields for landlords.
3. Inflation and Central Bank Policies
Central banks, such as the Federal Reserve (U.S.), European Central Bank (ECB), and Reserve Bank of India (RBI), play a pivotal role in managing inflation.
3.1 Tools of Monetary Policy
Interest Rate Hikes: To cool demand.
Open Market Operations: Controlling money supply.
Cash Reserve Ratio / Statutory Liquidity Ratio: Used by RBI to regulate liquidity.
Forward Guidance: Communicating policy stance to manage expectations.
3.2 Inflation Targeting
Many central banks adopt formal inflation targets (e.g., 2% in the U.S. and Eurozone, 4% in India) to maintain price stability.
3.3 Dilemma for Policymakers
Too Aggressive Tightening: Risks slowing growth or causing recession.
Too Soft: Risks runaway inflation.
4. Historical and Global Case Studies
4.1 The U.S. in the 1970s – Stagflation
Oil price shocks triggered high inflation + low growth.
Stock markets stagnated, bonds suffered, commodities soared.
4.2 Zimbabwe (2000s) – Hyperinflation
Prices doubled every few hours.
Currency lost value, people resorted to barter trade.
Financial markets collapsed.
4.3 India (2010–2013) – High Inflation Phase
CPI and WPI inflation soared due to food and fuel prices.
RBI raised rates multiple times, slowing growth.
Equity markets remained volatile, bond yields spiked.
4.4 Pandemic & Post-Pandemic (2020–2023)
Global supply chain disruptions + fiscal stimulus led to inflation surge.
Central banks responded with aggressive rate hikes.
Stock markets turned volatile, real estate demand shifted, commodity prices spiked.
5. Inflation and Investor Strategies
Investors cannot control inflation, but they can adapt strategies to protect their wealth.
5.1 Hedging Against Inflation
Commodities: Gold, silver, oil, agricultural products.
Real Assets: Real estate, infrastructure.
Equities: Companies with strong pricing power, dividend-paying stocks.
Inflation-Protected Bonds: TIPS, index-linked government securities.
5.2 Portfolio Diversification
Balancing equities, bonds, commodities, and alternative assets reduces the risk of inflation eroding overall portfolio value.
5.3 Sector Rotation
Moving investments into inflation-friendly sectors (energy, utilities, consumer staples) during high inflationary phases.
6. Broader Economic and Social Implications
Purchasing Power: Consumers struggle as essential goods (food, fuel) become costlier.
Wage-Price Spiral: Workers demand higher wages → businesses increase prices → further inflation.
Inequality: Inflation hurts low-income households more, as they spend a larger share of income on essentials.
Political Instability: Persistent inflation can lead to social unrest, protests, and government changes.
7. Conclusion
Inflation is a double-edged sword. Controlled inflation is a sign of a healthy, growing economy, ensuring that demand is strong and businesses are profitable. But when inflation becomes excessive or unpredictable, it erodes purchasing power, distorts investment decisions, destabilizes financial markets, and undermines trust in economic management.
Its impact on markets is wide-ranging:
Stocks face pressure due to higher costs and lower valuations.
Bonds lose value as yields rise.
Currencies depreciate if inflation is uncontrolled.
Commodities and real estate often benefit, acting as hedges.
For policymakers, investors, and ordinary citizens, understanding inflation is essential. It is not merely an economic indicator but a force that shapes market dynamics, business strategies, and household decisions. In an interconnected global economy, inflation in one part of the world can ripple across continents, influencing global capital flows and market stability.

BTC LONG AND HAVING SUPPORT OVER THE CHANNEL Chart Overview
• Pair/Timeframe: BTC/USDT – 4H
• Exchange: Bitget
• Pattern: Breakout from a falling wedge / descending channel, shifting momentum bullish.
• Indicators:
• EMA 9 (yellow) and EMA 20 (blue) are crossing bullishly.
• Volume spike supports the breakout.
⸻
Price Action
• BTC broke out of the descending trendline (blue) and retested support before moving higher.
• Currently trading at 110,780 USDT (+1.46%).
• Strong bullish momentum is visible with higher lows forming since Aug 31.
⸻
Trade Setup
• Entry: Around breakout zone (near 110,000 – 110,500).
• Stop Loss (SL): Below 108,500 zone (highlighted red zone).
• Targets:
• TP1: 114,658 USDT
• TP2: 115,980 USDT
⸻
Key Levels
• Immediate Support: 109,383 – 108,534
• Major Support Zone: 107,200 – 107,386
• Immediate Resistance: 111,998 – 113,217
• Target Resistance: 114,658 (TP1) and 115,980 (TP2)
• High Reference: 117,340 – 117,345
⸻
✅ Summary: BTC has broken out of a falling wedge on the 4H chart with strong bullish confirmation. If price sustains above 110k, it could move toward 114.6k (TP1) and 116k (TP2). Losing 108.5k support would invalidate this bullish setup.

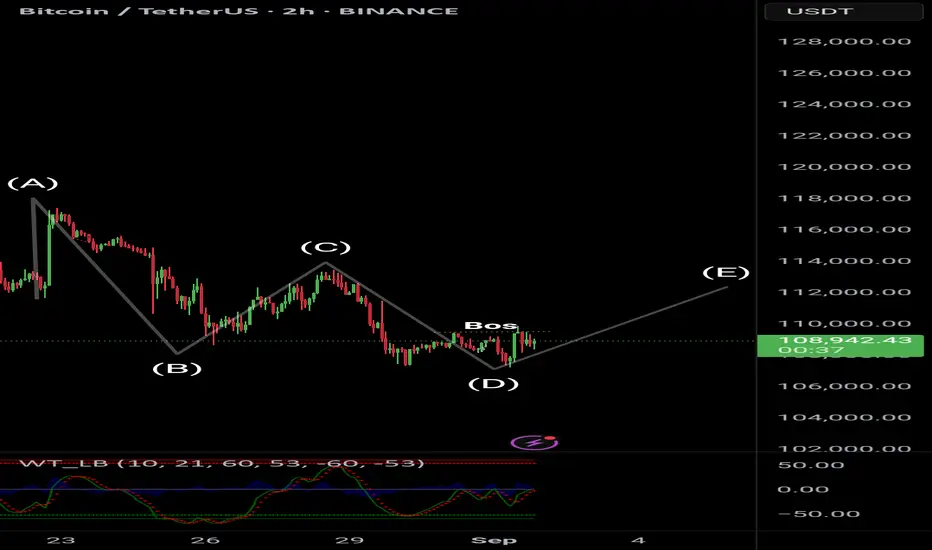
BTC/USDT – Elliott Wave Structure with BOS ConfirmationBTC/USDT – Elliott Wave Structure with BOS Confirmation
On the 2H timeframe, Bitcoin is showing a clear Elliott Wave corrective pattern:
Wave A → B → C → D completed
BOS (Break of Structure) confirms a potential shift towards a bullish reversal.
Price is consolidating near the $108,800 level, preparing for a possible move towards the Wave E target zone.
Key Observations:
Momentum indicators showing a potential bullish divergence.
Holding above the $108,000 support zone strengthens the bullish outlook.
Next resistance levels are at $110,000 – $112,000.
Trade Idea:
Entry: Around $108,800 (confirmation on bullish candle close)
Target Levels:
TP1: $110,500
TP2: $112,000
Stop Loss: Below $107,500 to manage risk.
Bias: Bullish as long as price sustains above the recent Wave D low.
Would you like me to include Fibonacci retracement levels in this description for more technical depth?
ChatGPT can make mistakes. Check important info. See Cookie
Btc long 1H TimeframeKey Observations:
1. Chart Type & Indicators:
• Timeframe: 1 Hour (1H)
• Indicators: EMA 9 (yellow), EMA 20 (blue) for short-term trend tracking.
2. Price Action:
• Current Price: 109,260 USDT
• Recently bounced sharply after a strong dip, showing bullish recovery.
3. Pattern:
• There’s a visible ascending triangle (orange lines), which usually indicates bullish continuation if price breaks upward.
• Price has broken out of the small ascending trendline with momentum.
4. Trade Setup (Long):
• Entry Zone: Around 109,260 USDT
• Target (TP):
• First resistance near 111,998 USDT
• Next major resistance around 113,217–113,431 USDT
• Stop Loss (SL): Around 107,200–107,386 USDT
5. Volume:
• Noticeable increase in buy volume at the breakout, confirming bullish pressure.
⸻
✅ Summary:
This is a long position setup based on breakout from an ascending structure. If BTC holds above the 109,000–108,500 support zone, it has potential to test 112k–113k levels. Stop loss is placed below the recent swing low (~107.2k).

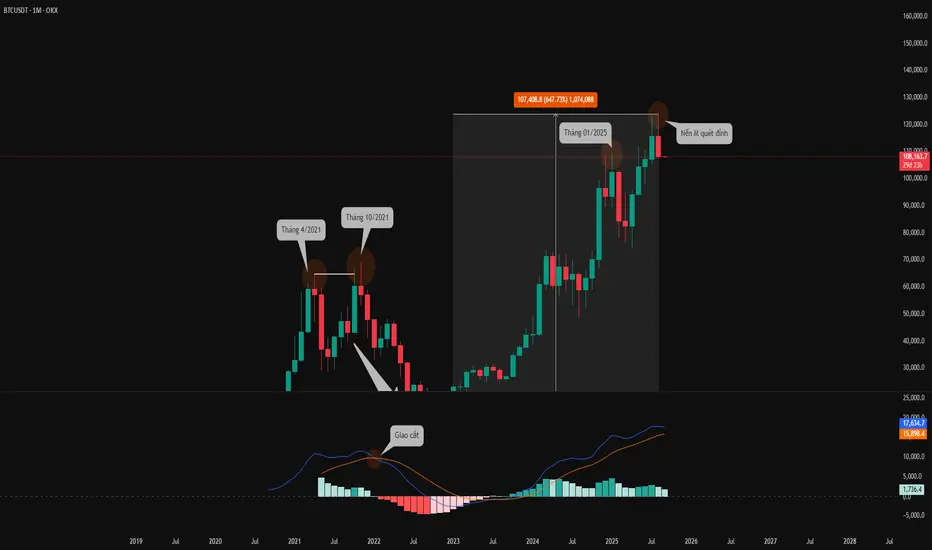
Warning: A possible “crash” incoming?! 🔴 Warning: A possible “crash” incoming?! The key factor will be revealed at the end of this post
Bitcoin Market Update – 09/01/2025 👇
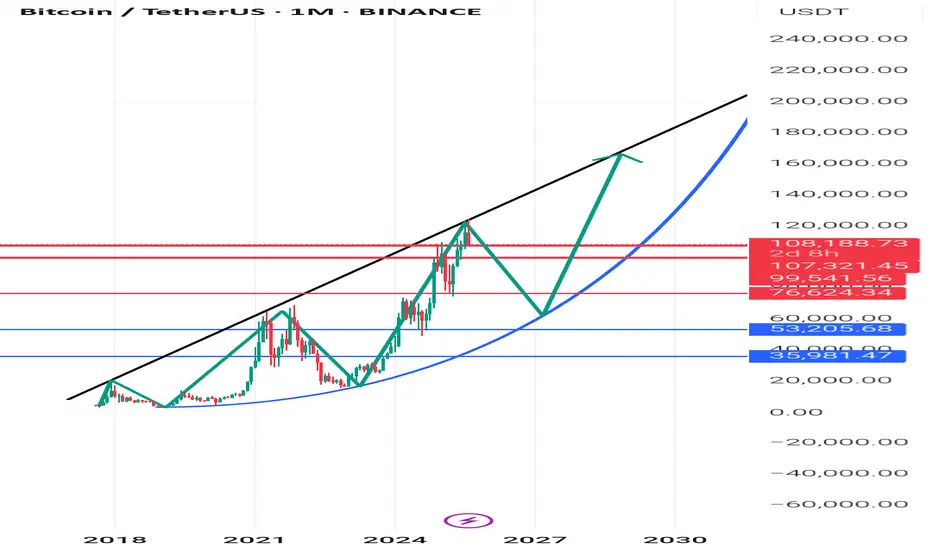
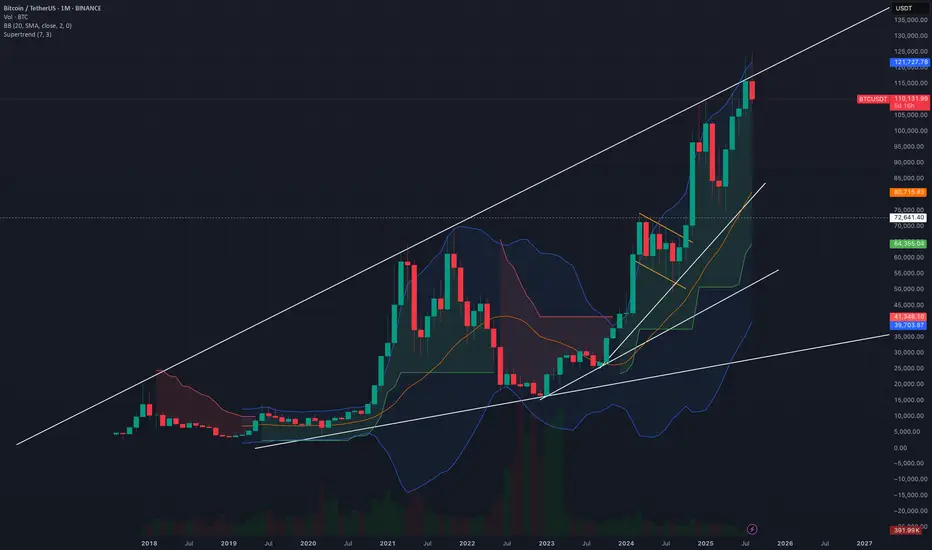
On the monthly timeframe, Bitcoin has surged ~647% from the wave bottom in January 2023 up to now. The long-term trend is still bullish. This current bull wave looks healthy, with strong upswings followed by short-term corrections.
However, here’s the factor I want to warn you about:
1️⃣ The Bitcoin monthly candle closed red this morning, almost engulfing the previous one, and more importantly, it just made a liquidity sweep at the top. History (see orange-marked zones) shows that whenever the monthly candle sweeps the high, a correction usually follows—sometimes small, sometimes very deep.
⚠️ Especially note October 2021: after Bitcoin swept the high, it went on to lose 70% of its value, dragging the whole market into a downtrend.
2️⃣ Looking at the current conditions: if the MACD on the monthly timeframe makes just one bearish cross, a downtrend could begin immediately.
Of course, timing, liquidity flow, and macro cycles all differ. Personally, I remain extremely bullish on the market long term. Corrections are necessary to set up the next massive wave.
No one can predict the future with certainty. But we can prepare defensive strategies for the worst-case scenarios.
🌱 Wishing everyone a green and refreshing new week ✅
Short-term trading strategies will be updated later today.
👉 Stay tuned everyone!
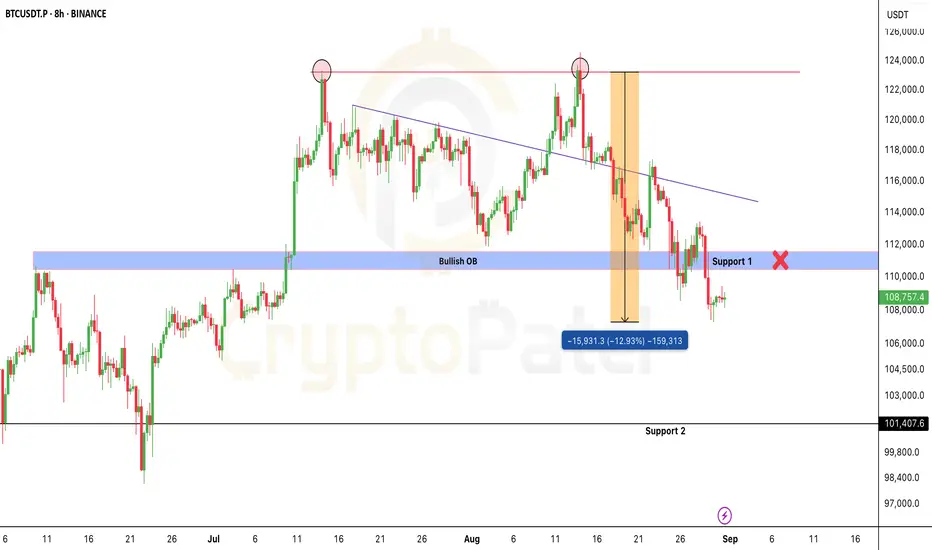
Bitcoin Chart Analysis And Bearish overview #BTC Bearish Outlook
Bitcoin stays bearish below $113,400.
No H4 close above = downtrend intact, targeting the $100K psychological level.
Break $100K support, and liquidity near $90K becomes the next magnet.
Key levels:
$113,400 → HTF resistance
$100,000 → Psychological support
$90,000 → Demand zone
Already 13% down from our short entry, hope you caught the move. 🫡
NFA & DYOR
Bitcoin Entering in 3 Year bearish phaseAs i told you earlier, this bitcoin chart is clearly indicating us that bitcoin is entering in long time 3 yr. Upcoming bearish phase and i think it's started now.
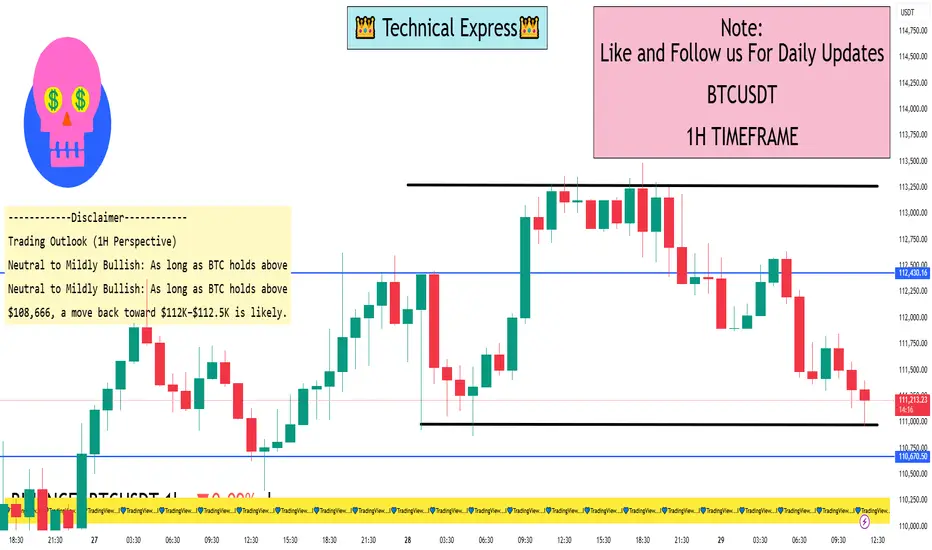
BTC/USDT 1 Hour View1-Hour Technical Snapshot
Key Levels
Support Zones:
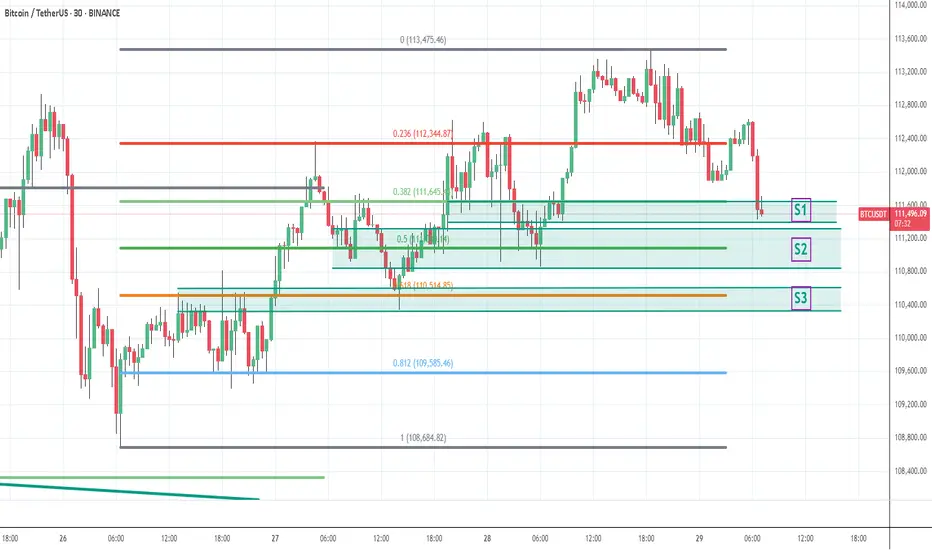
~$110,000–$110,600 — viewed as a critical short-term support / demand area. It’s where BTC could stabilize if the current slide continues
~$108,666 — a deeper support level; a break below this risks a pullback toward $101,000, near the 200-day moving average
Resistance Zones:
~$112,000–$112,500 — a key resistance or supply area, with potential selling pressure around this range
~$124,474 — the recent monthly closing high and psychologically significant level; clearing this would be a strong bullish confirmation
Market Sentiment & Setup
Bullish Case: BTC sitting near $111,600 is seen by some analysts as a potential entry zone for a bullish continuation pattern (like a bull flag). A break above $115,544 (20-day SMA) could fuel a push toward $125,000
Bearish Risk: If $108,666 support fails, the risk is for a deeper drop toward $101,000, negating the bullish setup
Other indicator-based technical analysis tools (like TradingView’s technical summary) reflect a neutral bias on 1H charts, while longer-term timeframes lean more bullish
BTC - 29th Aug - collect more qty on every dipswe have monthly expiry and max pain at the top around 117K not sure exactly as it keeps changing some times. I expect any of the mentioned support levels to hold since it went up with demand followed by good data from US and positive equity... long BTC with required enough enough margins so no one can liquidate even during sleeping... weak hands loose btc to whales during dips... collect btc qty on dips... take care, cant predict the exact support levels big players thinking .... But every big players buy every dip when good volume seen for sure
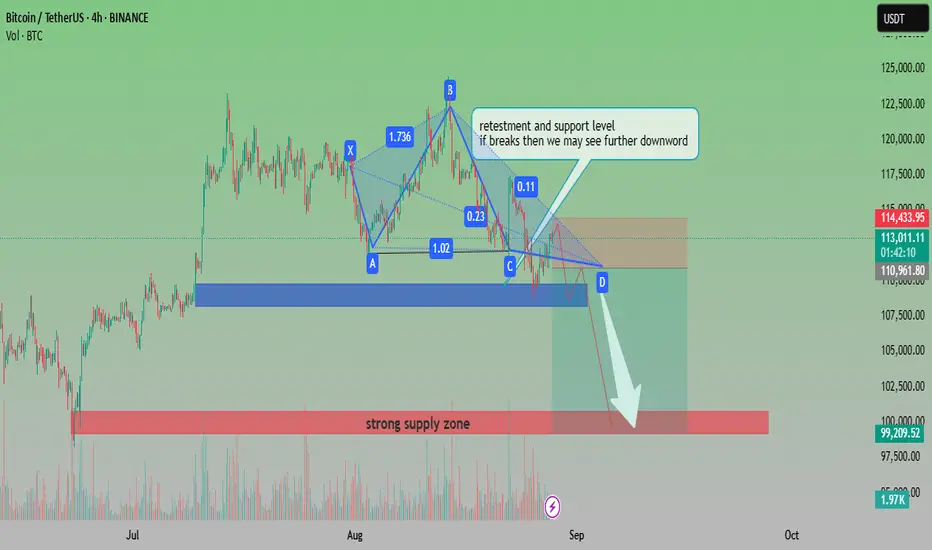
BTCUSDT Bearish Pattern with Key Support RetestAnalysis:
The chart shows Bitcoin (BTCUSDT) forming a harmonic pattern that signals potential bearish continuation. Price is currently retesting a critical support and resistance level around the 113,000–114,000 zone. If this level fails to hold, further downside movement is expected.
Pattern Formation: The harmonic structure (XABCD) suggests a bearish setup.
Support Zone: Around 110,900–111,000, a crucial level to watch.
Downside Target: If support breaks, the price could move toward the 99,000–100,000 strong supply zone.
Volume: A noticeable volume build-up supports potential continuation to the downside.
📉 Outlook: Bearish bias. A breakdown from current retest levels may accelerate selling pressure toward the 100k psychological zone.
Bitcoin Bear OutlookHas the Bitcoin bull run ended? From my outlook, I see a strong push to the downside, followed by a potential retracement back up that could form a head-and-shoulders pattern, adding more confluence to my bearish view.

BTCUSDT.P MEXC H1This BTC/USDT analysis dives into the order flow using Cumulative Volume Delta (CVD) to gauge the real strength behind recent price movements. CVD provides a crucial look "under the hood" by tracking the net difference between aggressive market buys and sells.
Currently, we're observing a potential divergence between price action and CVD. While the price may be showing one thing, the CVD indicates whether conviction from buyers or sellers supports the move. This discrepancy can often be a leading indicator for a potential reversal or trend exhaustion. Let me know your thoughts in the comments!

BTC 1H Long1. Current Price
BTC is trading around 110,879 USDT at the time of the chart.
2. Trendline
• An ascending trendline is drawn from the recent bottom, showing short-term bullish momentum.
• Price is testing support at this trendline.
3. Entry Zone
• Marked slightly above 110,500 USDT.
• Idea: enter long position as price holds above support & trendline.
4. DCA (Dollar-Cost Average) Zone
• Around 109,383.5 USDT.
• If price dips here, it’s a secondary buy zone to improve average entry.
5. Stop Loss (Invalidation)
• “1H Closing Below” ~108,534 USDT.
• If BTC closes below this level on 1H, the long setup is invalid.
6. Targets
• TP1 (Take Profit 1): 114,658 USDT
• TP2 (Take Profit 2): 115,980 USDT
• These are resistance levels where partial or full profits can be booked.
7. Risk-Reward Setup
• Entry around 110,500 → Stop below 108,534 → TP1 at 114,658, TP2 at 115,980.
• This gives a good Risk-to-Reward (RRR > 2) if the setup plays out.
8. EMA Levels
• Multiple EMAs (20/50/100/200) are shown.
• Price is still trading below the EMAs, meaning trend is bearish overall, but this setup is a counter-trend long scalp.
⸻
📌 Summary
• Bullish Scenario: If BTC holds above the entry and trendline, it can push toward 114,658 (TP1) and 115,980 (TP2).
• Bearish Scenario: If BTC breaks below 108,534 on 1H close, the long setup fails, and price may revisit lower supports.

long trade in bitcoinplanning for long at first zone but not aggressive then aggressive swing from the second zone and tp will be current daily lower high and very aggressive position on a weekly biased

BitCoin? a bit down or big downBitcoin is loosing it fizz now and rally may be about to end.
as per chart reading i can see that it is on the resistance levels
and as now world economies are also settling it should be possible that crypto frenzy get no hype and for that Bitcoin may see a down pludge
Possibly for next 2-2.5 Years Bitcoin won't cross the recent highs and may be retesting 72K level or more downside.
Up move will only continue after breaking and closing above this trendline.
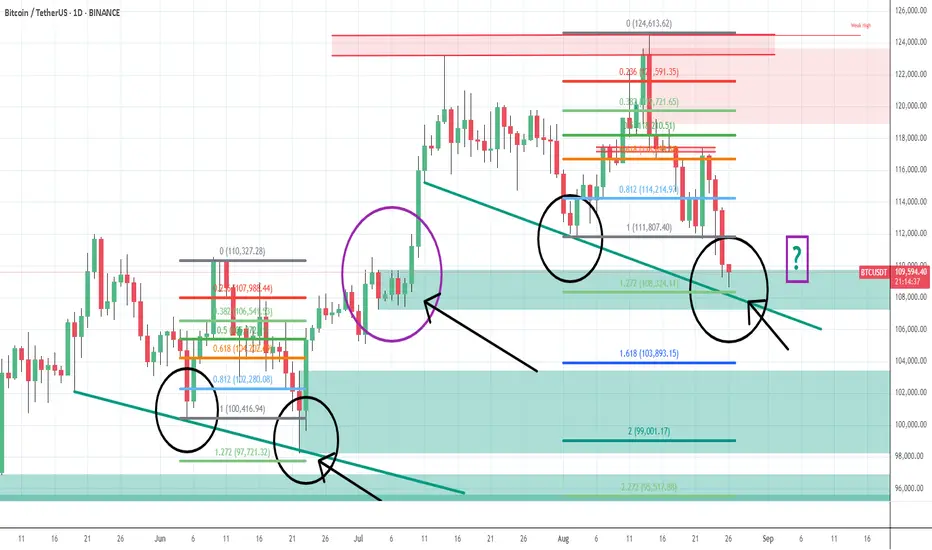
BTC - will bounce and move up only from today low - 26th AugBTC price has reached a crucial technical area from where price will most likely bounce and move up only and wont fall further much. explained in chart with fib levels and what happened in history
[SeoVereign] BITCOIN BEARISH Outlook – August 23, 2025I would like to share my perspective on the Bitcoin short position as of August 23.
The basis for this idea is twofold.
First,
the upward movement in the 118,684 ~ 117,435 range appears to be an impulse.
The reason is that wave 5 forms a 1.272-length ratio of wave 1.
Second,
if you look at the red trendline, you can see that the downside breakout has begun.
Therefore, I believe that adopting a bearish perspective is more reasonable.
The target average price for this position is 114,340.
I hope you achieve good results.
I will continue to track price movements and update this idea to monitor future trends as well.
Thank you.

BTC/USDT Technical Analysis – Key Levels & Trend Outlook📊 BTC/USDT Technical Analysis – Key Levels & Trend Outlook 🚀📉
🔹 Trend Structure
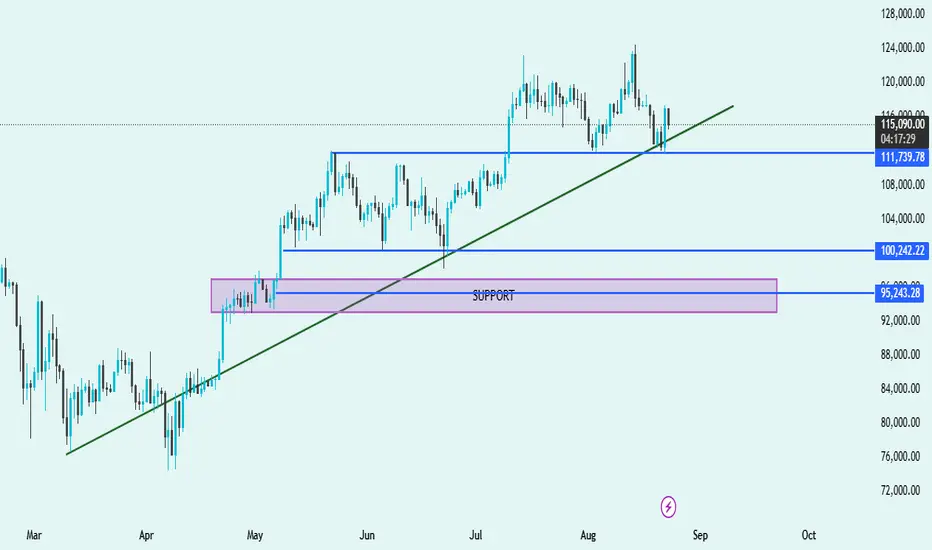
Price is currently trading above the trendline, suggesting bulls are still in control, but momentum has weakened.
🔹 Support Zones
Immediate Support: 🔵 $111,739
Price recently tested this level and bounced, showing demand from buyers.
Key Mid-Support: 🔵 $100,242
Strong historical level where buyers stepped in multiple times.
Major Demand Zone: 🟪 $95,243 – $96,500
Highlighted purple support box; this is a critical accumulation zone where bulls are likely to defend strongly.
🔹 Resistance Levels
Near-term resistance: Around $120,000 – $124,000 (recent swing highs).
A breakout above this zone could fuel a new bullish rally.
🔹 Market Outlook
✅ Bullish Bias as long as price respects the green trendline and stays above $111,739.
⚠️ If the price breaks below $111,739 and the trendline, expect a deeper pullback toward $100,242 or even the major demand zone $95,243.
🚀 A breakout above $120K will signal strong continuation to new highs.
📌 Summary:
Trend: Uptrend ✅
Key Supports: $111,739 → $100,242 → $95,243
Resistance: $120,000 – $124,000
Bias: Bullish above $111K, cautious below 🔻
Bit Coin Sell tradeBit coin became bearish after giving break down of Golden Reversal level . we were expecting it to reverse from Golden Reversal to continue Bullish moment ,
Bit coin instead gave break down of Golden reversal and become bearsish from golden reversal 900 points done .. target 1 and target 2 are marked on the chart . by mistake i post very big sl .. the sl here is 115850
