Bitcoin updated levels we will see 97500-98000 , buy then How to take trades using Harmonic pattern projection Trade setup is explained below :-
Entry : 1st SL point : 0% is recent top or bottom.
Trailing D: 15.1% is work as trailing SL of buy or sell trade if hit then we have to book profit
.If price goes below 2nd D 22.5% to 24.5% range then early traders can make fresh reversals trade after breaking 1st D 15.1% safe traders can reversal trade after breaking Point D 22.5.4% to 24.5% range
Targets :
Target T1 : 36.1% to 38.3%
Target T3 : 49.1% to 52.5%
T3: 60.9% to 64.8% is our 3rd Target since this is reversal zone so must book profit if break then take fresh trade again
Target T4 : 76.4% to 79.7%
Next Targets are 100% , 127.2% ,141.4% and final Target 161.8%.
How to take reversal trade :
If price going upside/ downside then then buy or sell levels appear on Chart ( Automatically show when price reach any reversal zone of harmonic projection ).
Trailing SL:
After reach 1st Target trail SL to just above or below cost ( for example we are holding sell trade from 100 1st Target 110 hit then move trailing sl to 104-105 and move SL as price move upside or Downside)
Re- Entry :
For Re-entry in any pull back Point D ( 15.1% ) is used for re-entry then SL recent high or low Point SL ( 0% ) .
Blue Line is 1st support/ Resistance
Green line is 2nd support/ resistance
Red line is 3rd Support/ resistance
BTCETH.P trade ideas

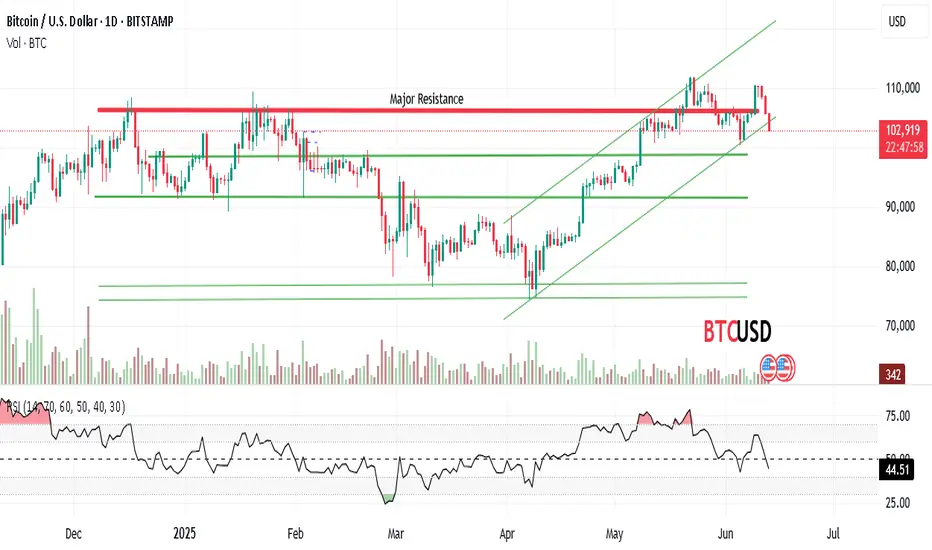
Bitcoin Breakdown? A Long-Term Correction Might Be Brewing
🔻 Positional Sell Call: Bitcoin (BTC/USD)
📍 Entry: ~$102,356
❌ Stop Loss: $106,000 (above the recent weekly high)
🎯 Long-Term Downside Targets (based on weekly chart):
• Target 1: $97,000
• Target 2: $90,000
• Target 3: $83,000
• Extended Target (if correction deepens): $74,000
📊 Technical Breakdown – Weekly Chart View:
• Failed Breakout at ATH Zone:
BTC/USD attempted a breakout above the previous ATH range (~$105,000–$106,800) but faced sharp rejection with high volume — a classic bull trap on the weekly candle.
• Bearish Engulfing Weekly Candle:
The last weekly candle shows a strong bearish engulfing pattern near resistance — often the first sign of a sustained downside move.
• Volume Spike on Selloff:
Increasing volume during the rejection week suggests institutional distribution rather than retail panic — a red flag for bulls.
• Historical Retest Level:
$90,000–$83,000 served as the launchpad in prior moves — now likely to act as the first major demand zone on correction.
📰 Fundamental Headwinds (As of June 2025):
• Whale Distribution Underway:
On-chain data shows whales are booking profits after the recent rally. A sustained transfer from large to smaller wallets is historically followed by major downtrends.
• ETF Euphoria Fades:
The earlier rally was driven by Bitcoin ETF optimism and institutional inflows. With this news now priced in, the market appears to be correcting expectations.
• Macroeconomic Pressure:
The Fed has held rates higher for longer. Risk assets, including crypto, are showing fatigue as liquidity dries up. Bitcoin, being speculative in nature, is vulnerable.
⏳ Time Horizon:
This is a multi-week to multi-month positional trade based on the weekly time frame. Patience is key — wait for structure to evolve before adjusting targets.
⚠️ Risk Management:
• Stop Loss: Firm above $106,000
• Risk/Reward: ~1:3 for Target 2
• Position Size: Use only capital earmarked for swing or long-term trades.
✅ Summary:
Bitcoin has printed a strong weekly rejection from the ATH zone, hinting at a potential long-term correction. With deteriorating technical structure and cooling sentiment post-ETF hype, this is a low-frequency, high-conviction short setup for swing traders.
🧠 Patience is your profit. This isn’t a scalp — it’s a slow bleed.

BTCUSDHello FRIENDS!
if you go and check maximum time BTC more price change in WEEKEND where block change only work.Now the BTCUSD price break an ascending channel down line in D. chart
At the moment, if Price not revers from support line !
So, here I expect a bearish move in this weekend .
BTUSD-short for 25 %price is facing resistance at 109k level with negative divergence
on weekly charts, sequence of changes in events are marked
target and SL marked.
very low risk entry with small SL

BTCUSD SHOWING A GOOD DOWN MOVE WITH 1:7 RISK REWARD BTCUSD SHOWING A GOOD DOWN MOVE WITH 1:7 RISK REWARD
DUE TO THESE REASON
A. its following a rectangle pattern that stocked the market
which preventing the market to move any one direction now it trying to break the strong resistant lable
B. after the break of this rectangle it will boost the market potential for break
C. also its resisting from a strong neckline the neckline also got weeker ald the price is ready to break in the outer region
all of these reason are indicating the same thing its ready for breakout BREAKOUT trading are follws good risk reward
please dont use more than one percentage of your capitalfollow risk reward and tradeing rules
that will help you to to become a bettertrader
thank you

BTC/USD – Bullish Reversal Setup | 15-Min Timeframe📈 Trade Idea: Bitcoin has shown signs of strength after a clear corrective move. Price is attempting a breakout from a consolidation range, signaling a potential bullish reversal for a quick intraday move.
🟢 Entry: 109,501
🔴 Stop-Loss: 108,693
🎯 Target: 110,151
Rationale:
Price forming a base after a structured pullback from a vertical move.
Strong bullish candle initiating from support indicates buyer presence.
Favorable Risk:Reward of approximately 1:1
Ideal for scalpers or short-term momentum traders.
🕒 Timeframe: 15-Minute
💡 Strategy Type: Reversal + Breakout Anticipation
📊 Bias: Bullish (short-term)

BTC 3rd Wave Targeting $195,000! Are You Riding It?Bold, Attention-Grabbing:
🚀 BTC 3rd Wave Targeting $195,000! Are You Riding It?
🔥 Bitcoin Sniper Entry: Next Stop $195K
📈 3rd Wave in Play: BTC Bulls Eyeing $195,000
💣 Bitcoin Explosion Coming — 3rd Wave Toward $195K
🧠 Smart Money Sniping BTC to $195K — Join the Ride

Bitcoin upcoming Long PositionBitcoin Long Trade Analysis - Bitcoin nearing its order block for more HH break. Volumes are decreasing before a big move. Pure case of ICT.

Technical Analysis – BTC/USD Technical Analysis – BTC/USD
📅 Date: June 11, 2025
🔍 Key Observations:
🔴 Resistance Zone – $110,000 to $111,800
Price has tested this resistance block twice (🔴 red arrows) and rejected both times, indicating strong selling pressure in this zone.
Rejection candles show long upper wicks, suggesting failed attempts by bulls to break above.
🟢 Support Zone – $101,800 to $103,500
This demand zone has been respected multiple times (🟢 green arrows), showing a solid base for potential bounces.
Price action previously rallied strongly after touching this level.
📦 Supply to Demand Play
Price made a sharp bullish move from support to resistance (📘 blue box shows the impulsive move).
After reaching resistance, the price is failing to break above, indicating possible exhaustion of bullish momentum.
📉 Potential Move:
🔽 Short-Term Bearish Bias
If price fails to hold current levels and breaks below the small consolidation (after blue box), we may see a drop to ~$105,583 (🔵 purple line = key level).
If that breaks, next likely destination is the support zone around $102,000 (⬇️ downward arrow path).
⚠️ Risk Notes:
🔁 Watch for any false breakouts or liquidity grabs above resistance.
📉 If bearish momentum increases below $105,583, sellers may take control in the short term.
✅ Trade Idea (Hypothetical):
Sell/Short near resistance (⚠️ confirmation needed like bearish engulfing or failed breakout)
Target 1: $105,583
Target 2: $102,000 zone
Stop-loss: Above $111,800 (invalidates setup)
📌 Summary:
BTC/USD is currently stuck between a well-defined resistance and support range. Unless bulls break above $111,800 with strong momentum, the structure favors a potential pullback toward the demand zone. ⚖️

Buy bitcoin positional Target 114500-115500,SL 108000How to take trades using Harmonic pattern projection Trade setup is explained below :-
Entry : 1st SL point : 0% is recent top or bottom.
Trailing D: 15.1% is work as trailing SL of buy or sell trade if hit then we have to book profit
.If price goes below 2nd D 22.5% to 24.5% range then early traders can make fresh reversals trade after breaking 1st D 15.1% safe traders can reversal trade after breaking Point D 22.5.4% to 24.5% range
Targets :
Target T1 : 36.1% to 38.3%
Target T3 : 49.1% to 52.5%
T3: 60.9% to 64.8% is our 3rd Target since this is reversal zone so must book profit if break then take fresh trade again
Target T4 : 76.4% to 79.7%
Next Targets are 100% , 127.2% ,141.4% and final Target 161.8%.
How to take reversal trade :
If price going upside/ downside then then buy or sell levels appear on Chart ( Automatically show when price reach any reversal zone of harmonic projection ).
Trailing SL:
After reach 1st Target trail SL to just above or below cost ( for example we are holding sell trade from 100 1st Target 110 hit then move trailing sl to 104-105 and move SL as price move upside or Downside)
Re- Entry :
For Re-entry in any pull back Point D ( 15.1% ) is used for re-entry then SL recent high or low Point SL ( 0% ) .
Blue Line is 1st support/ Resistance
Green line is 2nd support/ resistance
Red line is 3rd Support/ resistance

Bitcoin is just 2% away from a new all-time high —will it break?Bitcoin is just 2% away from a new all-time high — will it break or fake? 🚀
BTC is currently trading near $109K–$110K, only 2% below the $112K ATH level.
Strong supports: $94,000 / $80,000
Bullish Case:
If BTC breaks $110K–$112K with strong volume + a bullish weekly close → we could see a rally toward: $135K → $150K
Bearish Case:
If BTC rejects at $110K–$112K, a deep retracement below $100K is possible. Watch for strong support at $100K and $80K levels.
My Personal Take:
I'm bullish overall — but since we’re this close to ATH, I’m opening a short trade with 3% stop loss targeting near $100K.
👉 Not financial advice — do your own research. The crypto market is highly volatile.
Watch this level closely — next big BTC move may be starting NOW. 👀

BTC on verge of a major BreakoutBTC if closes above 108330 then we will see an ATH . Resistance is expected at 114565 but if we close above then we will see 131550. I am not expecting mkt to change direction anymore even if it touches 114565 maybe slight retracement or sideways for a couple of days only but we will soon see 131550.

BTCUSD buying setupWe can see a good move to upper side in bitcoin :-
1.support
2.sellers trap
3.moving avrage setup

BTC/USD-Bullish Continuation 📍 Entry: 106,015
📈 Long Bias
Bitcoin is showing a healthy pullback after a strong upward move, offering a potential buy-the-dip setup in the $106K zone.
✅ Setup Highlights:
Higher low structure holding above $105,800
Strong bullish impulse followed by a corrective retracement
Buyer interest seen near the previous resistance-turned-support
🛑 Stop Loss: Below $105,500
🎯 Target: $107,400+ for initial TP
📊 Risk/Reward: ~1.5+


I am back with my BITCOIN prediction!! New all time high.....As per my analysis bitcoin is ready to break the roof top with it's long term rocket booster🚀.
Price takes the higher time frame liquidity and give nice push towards upside.
So the next resistance is consider as new all time high and get on the if you want.
Time is ticking, 3,2,1 suiiiiii🚀.
Just making fun with you guys.
Don't just follow mine blindly.
As you guys know the ongoing clash between musk and Trump.
I am with musk, so dollar will get hit( because of Trump).
They will show dollar is soo good. But America is falling.
You may ask, Trump is supporting the bitcoin, it will affect if he fails?
Yes I agree. It will affect a bit with some noise of market condition. Because
Trump is just a news,( like if you throw a stone into a water it will waves with sudden, overtime water will become to it own shape( fundamental is important) , bitcoin is also like water).
Consider that America is falling, new power is rising IYKYK.
This happens many times in the history ( rising and falling of empires).
I can say bit more , but this is enough to make a decision.
These are all my opinion, not a financial advise.
Comment your thoughts and share some of your knowledge with me.
I am ready to learn.

BTCUSDHello FRIENDS!
The BTCUSD price formed an ascending channel pattern in D. chart
At the moment, Price revers from support line!
So, if cross the resistance line than I expect a Bullish move .

BITCOIN FAILED HEAD & SHOULDERHere mentioning THREE things
First HEAD & SHOULDER PATTERN FAILED
Second fib .7 is not broken and bounced back
Third taken reversal from previous boBOTTOM which is in blue color.
this one is not my buy/sell call.

Bitcoin short upcoming Bitcoin is continuing its downside push. Huge press till dollar index makes shorts.

Bitcoin sell given near 106000, made low 100400 near huge profitHow to take trades using Harmonic pattern projection Trade setup is explained below :-
Entry : 1st SL point : 0% is recent top or bottom.
Trailing D: 15.1% is work as trailing SL of buy or sell trade if hit then we have to book profit
.If price goes below 2nd D 22.5% to 24.5% range then early traders can make fresh reversals trade after breaking 1st D 15.1% safe traders can reversal trade after breaking Point D 22.5.4% to 24.5% range
Targets :
Target T1 : 36.1% to 38.3%
Target T3 : 49.1% to 52.5%
T3: 60.9% to 64.8% is our 3rd Target since this is reversal zone so must book profit if break then take fresh trade again
Target T4 : 76.4% to 79.7%
Next Targets are 100% , 127.2% ,141.4% and final Target 161.8%.
How to take reversal trade :
If price going upside/ downside then then buy or sell levels appear on Chart ( Automatically show when price reach any reversal zone of harmonic projection ).
Trailing SL:
After reach 1st Target trail SL to just above or below cost ( for example we are holding sell trade from 100 1st Target 110 hit then move trailing sl to 104-105 and move SL as price move upside or Downside)
Re- Entry :
For Re-entry in any pull back Point D ( 15.1% ) is used for re-entry then SL recent high or low Point SL ( 0% ) .
Blue Line is 1st support/ Resistance
Green line is 2nd support/ resistance
Red line is 3rd Support/ resistance

Bitcoin (BTC/USD) 1H Chart Analysis – Double Top Signals BearishPattern Formed: DOUBLE TOP
⚠️ Bearish Reversal Pattern Spotted!
📍 Formed near 111,794.8
⬆️ Price tested the top twice and failed – strong resistance confirmed!
Key Zones:
🔶 SUPPLY ZONE (Resistance):
🟧 111,794.8 - 111,829.8
🔼 Expect selling pressure here!
🔷 SUPPORT Zone (Broken!):
🔻 Price fell below this level, confirming a bearish breakout
🟩 TARGET ZONE:
🎯 102,500.0
✅ This is the likely drop target based on the pattern
🧊 Other minor supports:
* 102,820.6
* 102,750.8
* 102,227.0.
Indicators:
📈 Trend Line
* Supported the price during the uptrend
* ❌ Now broken — indicates momentum shift
📉 EMA 70 (Red Line)
* Current Price (108,238.6) is below EMA 70 = 109,245.0
* Indicates bearish pressure.
Trade Setup:
🔽 Short Entry Idea: After support break
🛑 Stop Loss: 111,829.8
🎯 Take Profit: 102,500.0
⚖️ Risk-Reward looks attractive!
Summary:
📉 Bearish bias confirmed by:
* Double Top pattern
* Supply zone rejection
* Support break
* EMA crossover
🚨 Traders Watch Out: Bears are in control — next major stop likely at 102,500.0!


Bitcoin sell 106500-700 SL 109300 Target 98900-98500How to take trades using Harmonic pattern projection Trade setup is explained below :-
Entry : 1st SL point : 0% is recent top or bottom.
Trailing D: 15.1% is work as trailing SL of buy or sell trade if hit then we have to book profit
.If price goes below 2nd D 22.5% to 24.5% range then early traders can make fresh reversals trade after breaking 1st D 15.1% safe traders can reversal trade after breaking Point D 22.5.4% to 24.5% range
Targets :
Target T1 : 36.1% to 38.3%
Target T3 : 49.1% to 52.5%
T3: 60.9% to 64.8% is our 3rd Target since this is reversal zone so must book profit if break then take fresh trade again
Target T4 : 76.4% to 79.7%
Next Targets are 100% , 127.2% ,141.4% and final Target 161.8%.
How to take reversal trade :
If price going upside/ downside then then buy or sell levels appear on Chart ( Automatically show when price reach any reversal zone of harmonic projection ).
Trailing SL:
After reach 1st Target trail SL to just above or below cost ( for example we are holding sell trade from 100 1st Target 110 hit then move trailing sl to 104-105 and move SL as price move upside or Downside)
Re- Entry :
For Re-entry in any pull back Point D ( 15.1% ) is used for re-entry then SL recent high or low Point SL ( 0% ) .
Blue Line is 1st support/ Resistance
Green line is 2nd support/ resistance
Red line is 3rd Support/ resistance
