Bitcoin sell given near 118500 , now start buying on dip Bitcoin sell recommended near 118500 , maximum targets hit on downside, now start buying on dip near support , both side levels given on chart
Trade ideas

BTC/USDTrading BTC/USD at an entry price of 113,414, with a stop-loss at 112,666 and an exit price at 114,900, is a well-defined trade setup designed to capture a bullish price movement while managing risk effectively. The trade aims to take advantage of potential upward momentum in Bitcoin, with a target profit of around 1,486 points and a risk of approximately 748 points. This results in a favorable risk-to-reward ratio of about 1:2, which is an essential element of disciplined trading.
The entry price at 113,414 is selected based on market analysis, possibly indicating a breakout above a short-term resistance or confirmation of a bullish trend. Traders often rely on technical indicators such as moving averages, RSI, MACD, or support-resistance levels to identify optimal entry points. Entering at this level suggests confidence that BTC/USD will continue moving upward toward the target.
The stop-loss at 112,666 is placed strategically below a key support area to limit losses if the market reverses. It acts as a protective mechanism, ensuring that unexpected volatility or bearish moves do not lead to significant capital loss. Setting a stop-loss is crucial, especially in cryptocurrency trading, where price swings can be sharp and sudden.
The exit price at 114,900 is a predefined take-profit level where the trader plans to close the trade to secure gains. This level may coincide with a resistance zone or a calculated price target based on technical patterns like Fibonacci extensions.
This trade setup reflects a disciplined approach by having clear entry, exit, and risk management. By following the plan strictly and avoiding emotional decisions, the trader increases the chances of achieving consistent profits while minimizing potential losses in the highly volatile BTC/USD market.

BTC is bullishPrice is coming to retest 109k-111k zone. It can bounce back from here to create new high. Check for structural shift before taking a long trade.

Bitcoin Price Prediction 2025–2030 | Future Bitcoin ForecastBitcoin Price Prediction 2025–2030 | Future Bitcoin Forecast & Trends
Key Takeaways
Current Status: Bitcoin trades around $115,300, consolidating after a July 2025 peak of $123,270. Institutional inflows and ETF adoption fuel optimism.
Market Performance: BTC gained 120.84% over the past year from Jan 1 2024, to Jan 1 2025, with 17/30 green days in July 2025, showing strong bullish sentiment despite short-term volatility.
Technical Analysis: Price action remains above key EMAs, with the SuperTrend indicator signalling a buy. A potential breakout above $120,000 could target $125,000, with an immediate resistance at $123,200
Price Prediction July 2025: BTC reached $120,000–$122,000, with pullbacks to $117,000, aligning with short-term consolidation forecasts.
Future Outlook: Rising institutional adoption and halving effects could push BTC to $150,000–$170,000 by late 2025, with long-term targets of $270,000 by 2030.
Where Will Bitcoin Price Head Next?
Bitcoin’s price action in August 2025 reflects a market balancing greed and caution. Trading near $115,300, BTC is consolidating within a falling wedge bullish pattern on the daily timeframe, supported by strong institutional buying and ETF inflows. The Fear & Greed Index is around 72, signalling greed, while 57% green days in July highlight sustained bullishness. However, macro risks like geopolitical tensions or policy shifts could trigger corrections. Let’s dive into the technicals to gauge BTC’s next move.
Technical Analysis
EMA Alignment: BTC trades above the 20-day ($118,145), 50-day ($112,990), 100-day ($107,713), and 200-day EMAs, confirming bullish momentum. The 50-day EMA rising below the price supports potential upside.
SuperTrend Indicator: The SuperTrend remains in buy mode, with support near $117,000. This suggests continuation if BTC holds this level.
Consolidation Pattern: Price action forms a minor descending channel on the daily chart, with resistance at $120,000. A breakout could target $125,000.
Volume Trends: On-balance volume (OBV) is rising, confirming volume-backed bullish moves. However, RSI at 59–62 hints at mild exhaustion, warranting caution.
Bitcoin Price Prediction Daily
BTC is likely to trade between $119,300 and $114,000 over the next 24–48 hours. A hold above $117,000 could push toward $120,000–$122,000, while a break below risks a dip to $113,000, near the 50-day EMA.
Bitcoin Price Prediction Weekly
This week, BTC may test resistance at $120,899. A breakout could eye $125,000, but failure to clear this level might lead to a pullback to $114,800, a key support.
Bitcoin Price Prediction (July 2025)
July saw BTC peak at $123,236, with prices ranging from $117,000 to $122,000. Consolidation between $117,000 and $120,000 occurred, driven by profit-taking after a strong rally.
Bitcoin Price Prediction (August 2025)
August could see BTC challenge $125,000–$127,000 if it breaks $120,000. Support at $117,000–$118,500 remains critical. A deeper correction to $113,000 is possible if macro pressures intensify.
Future Outlook
Bitcoin’s trajectory remains bullish, driven by institutional adoption and its fixed supply. Spot Bitcoin ETFs are projected to hold 7% of the circulating supply by late 2025, with assets under management reaching $190 billion. The April 2024 halving, reducing block rewards to 3.125 BTC, continues to tighten supply, historically correlating with price surges.
Recent news, including MicroStrategy’s ongoing BTC accumulation and Standard Chartered’s $200,000 target for 2025, underscores optimism. However, risks persist. Geopolitical events, like the Israel-Palestine conflict spiking social volume in 2024, or regulatory shifts like Trump’s Tariff Announcements, could induce volatility.
A drop below $116,000 might trigger a correction to $110,000–$100,000, aligning with the 100-day EMA. In the long run, many crypto analysts expect Bitcoin to reach around $710,000 by 2030, seeing it as a form of digital gold. Cathie Wood’s optimistic prediction goes as high as $1.5 million.
By 2027–2030, increasing adoption in emerging markets as a hedge against inflation could drive demand. If BTC holds above $100,000, technicals suggest a path to $600,000 by decade’s end. Investors should monitor ETF inflows, whale accumulation, and macro trends while managing risk, as crypto markets remain volatile.
Disclaimer: Price predictions are speculative. Conduct your own research before investing.

Bitcoin bottoming out starts !?!At 115,008, this is why I believe the process of bottoming out of #bitcoin has started.
It's the confluence of trendlines (blue) and 50 DEMA (pink) at the 113,000-114,000 area. Any volatile spike down to the 109,000 level is a good area to accumulate, if it may happen.
Any weekly close below 109,000 is a problem for bullish traders!

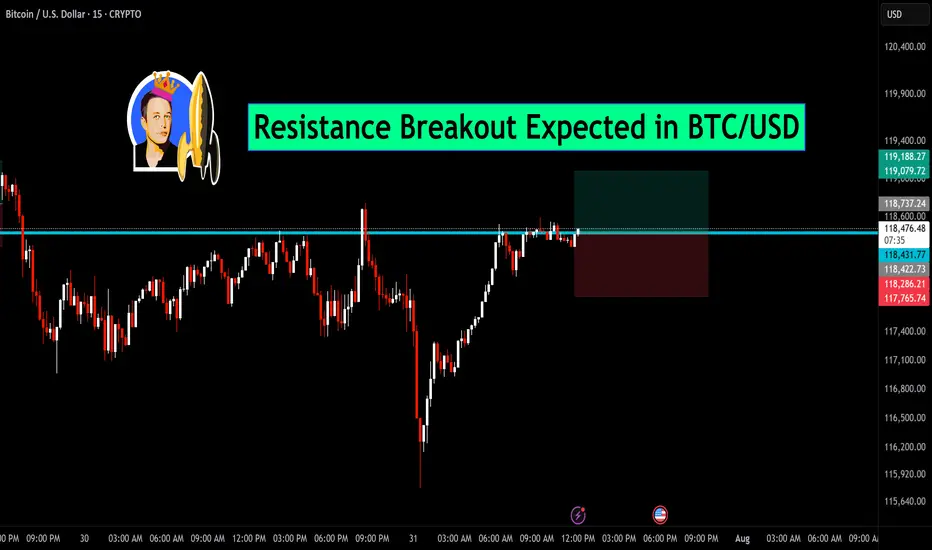
Resistance Breakout Expected in BTC/USDBitcoin is currently testing a key horizontal resistance near the $118,600 zone. After a sharp recovery from recent lows, the price is consolidating just below this level, indicating a potential breakout.
🔍 Chart Insights:
Price action forming higher lows, showing strength.
Breakout above the marked resistance may trigger a strong bullish move.
Tight consolidation near resistance suggests bulls are preparing for a push higher.
📈 Trade Setup:
Entry: Above $118,600 breakout
Target: $119,188 and beyond
Stop-loss: Below $118,200
If price sustains above resistance with volume confirmation, BTC/USD could witness fresh momentum on the upside. Stay alert for the breakout candle.
Trendline Support Retest in BTCUSDBTCUSD is currently retesting a crucial trendline support after a sharp pullback. Price broke above resistance earlier and has now returned to retest the breakout zone — a classic setup where buyers may step back in. ✅
📉 After a strong downtrend, we saw a bullish reversal pattern forming, followed by a clean breakout. This retest can act as a potential entry point for a long setup, provided the support holds.
📌 Key Levels:
Support Zone: ~$115,250 – $115,280
Resistance Zone: ~$116,180 – $118,200
Risk-Reward looks balanced with a well-placed SL below the retest candle.
🛡️ Watch for bullish confirmation (like a strong bullish engulfing or volume spike) before entering!
📅 Timeframe: 15-Minute Chart

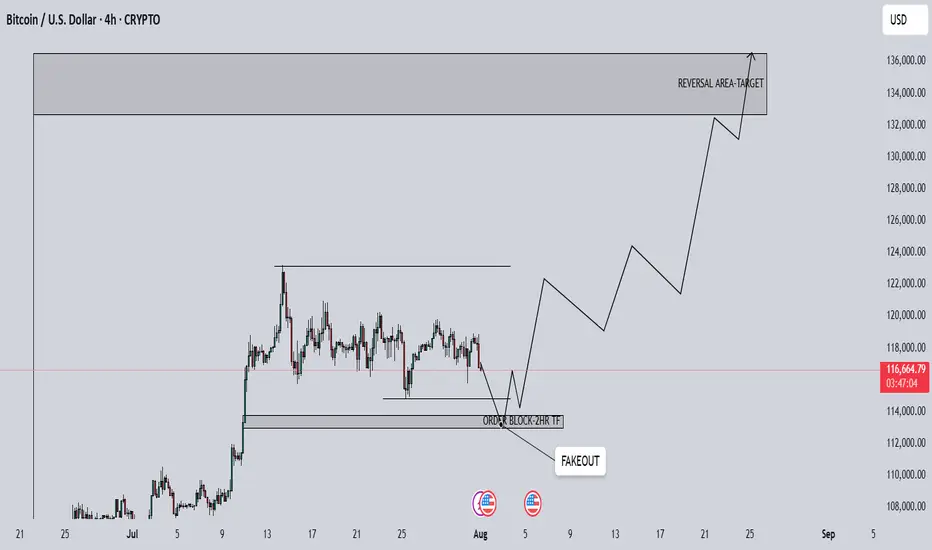
BTCUSD 4H Analysis1. Overall BTC is bullish but currently its at central area of
demand. so we can see a consolidation here.
2. There is a inducement/wicks at downside, so we can expect
a fake out at downside to fill the inducement and then market
can go to target area.
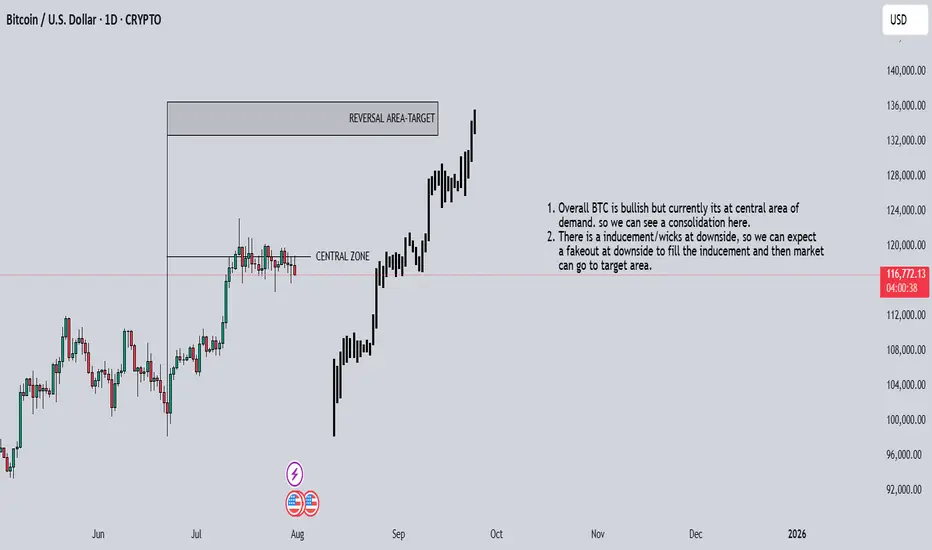
BTCUSD 1D Analysis1. Overall BTC is bullish but currently its at central area of
demand. so we can see a consolidation here.
2. There is a inducement/wicks at downside, so we can expect
a fake out at downside to fill the inducement and then market
can go to target area.
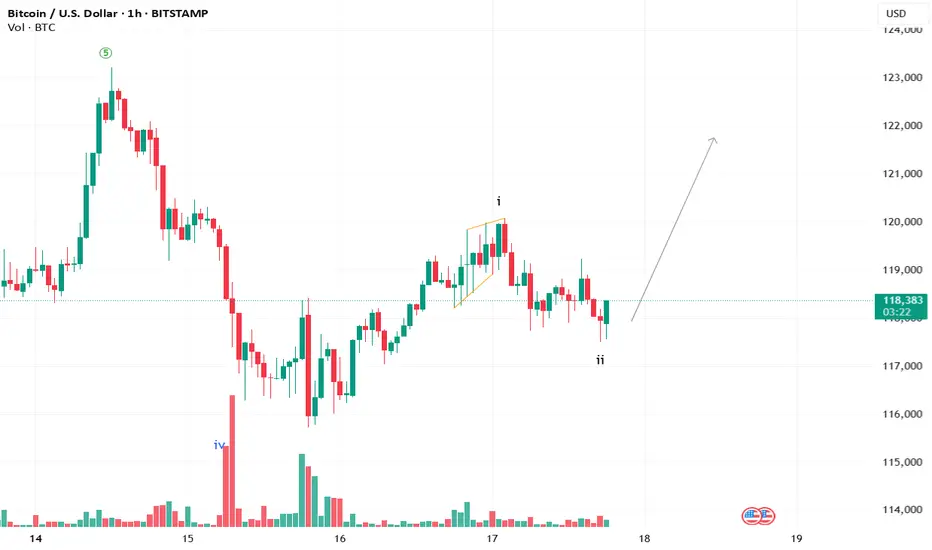
BTC ready to move up?An impressive wave 2 structure is about to be completed. We may observe the next wave 3 on the upside.
BTC Took Support – Big Move from Demand Zone Expected!🚀 BTC Took Support – Big Move from Demand Zone Expected!
Bitcoin (BTC/USD) has touched the demand zone and now showing signs of upside reversal. After taking out sell-side liquidity, price is getting ready for a bullish push toward higher targets.
📊 Technical Analysis:
🟤 Demand Zone (115,000 – 116,000):
Market came down and respected this zone. This is a strong area where buyers entered again.
🧲 Sell-Side Liquidity Grab:
Price formed equal lows, then broke them to collect liquidity before reversing — typical smart money behavior.
🔁 Break of Structure (BOS):
Structure break confirmed that trend might reverse now from bearish to bullish.
🟪 Fair Value Gap (FVG):
A clean FVG is also visible near the top side, and price may move to fill this imbalance.
🎯 Target: 119,000 USD:
If bulls hold the demand zone, BTC can easily move towards this resistance area. This is the short-term upside target.
📚 Key Learning Points:
Liquidity was collected below equal lows
Buyers stepped in from the demand zone
Break of structure confirms bullish pressure
FVG + Resistance area aligns with target
✅ Conclusion:
As long as BTC holds above 116,000, bulls are in control. This is a good zone for long entries, with a target near 119,000. Traders should watch for confirmation with minor BOS or strong bullish candles.

What is RSI divergences ?RSI divergences are one of the most powerful clues in technical analysis that signal potential trend reversals or continuation. they occur when the price action and the RSI indicator move in opposite directions.
📈 types of divergences:
🔸bullish divergence – price makes lower lows, but RSI makes higher lows. this often indicates that bearish momentum is weakening, and a bullish reversal may be near.
🔸bearish divergence – price makes higher highs, but RSI makes lower highs. this suggests that bullish momentum is fading, and a bearish reversal might follow.
🧠 why does this work?
divergences show a disconnect between price and momentum. while price may be pushing further in one direction, the underlying strength (as measured by RSI) is not confirming it. this imbalance often leads to a correction.
🛠 how to use it effectively:
* combine divergences with key support/resistance zones
* look for confirmation through candlestick patterns or volume
* use proper risk management — not every divergence plays out
🚨 tip: not all divergences are equal. use higher timeframes for stronger signals and avoid trading solely based on divergence without confluence.
📌 RSI divergences can add a powerful edge to your trading when used with other tools. master this concept and you'll start seeing hidden opportunities on your charts.
Disclaimer :
This Idea post is not financial advice, it's for educational purposes only, I am not a SEBI-registered advisor. Trading and investing involve risk, and you should consult with a qualified financial advisor before making any trading decisions. I do not guarantee profits or take responsibility for any losses you may incur.

BTCUSD Bullish biasBuying Bitcoin as demand stays strong with more big investors joining in. Positive global news like trade deals and clearer crypto rules are boosting confidence. Bitcoin is near its highs and could break out to new levels if momentum continues. Some risks exist but trend and fundamentals look bullish short-term. Watching ETF flows, US news, and altcoin trends too. Aiming for a move toward $120k if support holds.

BTC USD -- Short Term Trade🧠 Technical Setup:
🟢 Buying Area: Price is hovering over a well-tested demand zone near $117,700–$117,000, showing signs of defense by bulls.
✅ Risk-Reward Favourable: Stop loss is clearly defined below support, allowing tight risk with high upside.
📈 RSI Bounce: RSI shows a bounce from oversold, adding confluence to the long setup.
🔼 Targets:
🎯 Target 1: ~$119,500 (recent lower high)
🎯 Target 2: ~$120,800 (supply test zone)
📊 Market Context:
⚠️ Volume remains modest — aggressive entries should be managed with caution.
A break below $116,000 would invalidate this idea.
⚠️ Disclaimer:
This chart is for educational and informational purposes only. It is not financial advice. Cryptocurrency trading involves high risk. Always do your own research and consult a registered financial advisor.
🔔 Follow @Alpha_Analyst10 for daily chart setups | 💬 Share your thoughts below
#BTCUSDT #BitcoinAnalysis #CryptoSetup #TechnicalAnalysis #TradingView #AlphaAnalyst

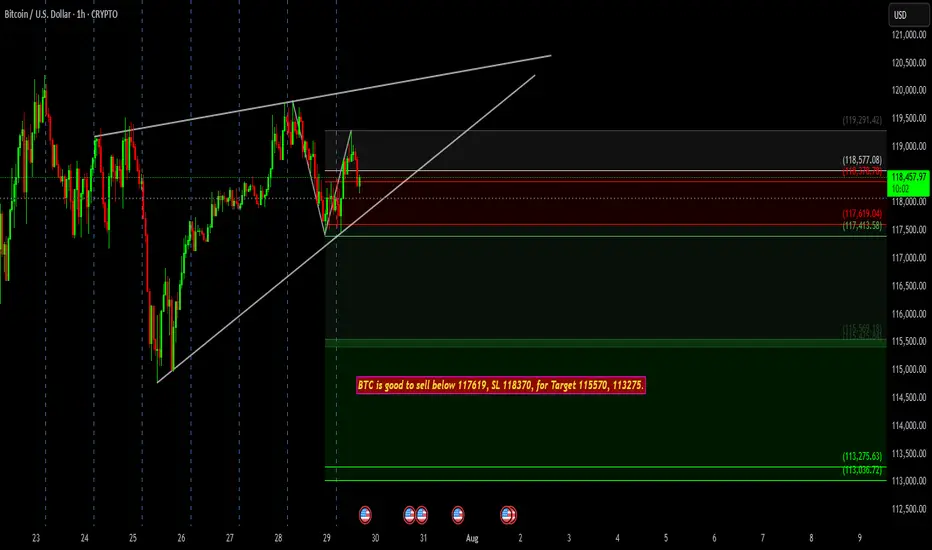
BTC is showing weakness near resistance.BTC is showing weakness near resistance and forming a possible rising wedge breakdown pattern on the 1H chart. A sell setup is active below 117619, with a stop loss at 118370.
🎯 Targets:
1️⃣ 115570
2️⃣ 113275
BTCUSD - Consolidation Breakout & RetestBitcoin has successfully broken out of its consolidation zone on the 15-minute chart. After a strong breakout above the horizontal resistance, we are now seeing a textbook retest of the breakout level, which may act as a fresh support.
✅ Bullish confirmation if price sustains above the breakout zone
📍 Resistance turned support at ~118,700
🎯 Upside momentum likely to continue if this retest holds

Bitcoin rebounds with strength after whale dumpAfter a surprising sell-off triggered by whale pressure, Bitcoin (BTCUSD) has shown impressive internal strength, bouncing quickly from the Fibonacci support zone between 114,488 and 116,571 USD (0.618 – 0.5 levels).
The D1 chart reveals that the bullish structure remains intact, with EMA 34 and EMA 89 acting as solid support levels. The recent "dump" did not alter the overall trend; on the contrary, it created an opportunity for reaccumulation within the price box—serving as a vital base for the next breakout.
A likely scenario is that BTCUSD will continue to move sideways for a few more sessions before targeting the 1.272 Fibonacci extension near the 128,000 USD area. If this plays out, it would be a strong confirmation of the next growth phase for Bitcoin.
Do you believe Bitcoin is ready to break all-time highs and set a new record? Share your thoughts below!

Corrective DownBitcoin seems to be completing Wave F of a diametric formation.
Generally, Wave B and Wave F are related to each other and till now, Wave F is almost equal to Wave B, so a potential area of resistance
After this a corrective downside in form of Wave G could start.

Bitcoin fall possible from current price buy on dip near supportBitcoin short term view negative , fall will come from current price buy near support 113500-112900. , at current price buying risky wait for dip, levels mentioned on chart
BTCUSD BTC/USD update: considering a move like this. However, a close above 120,222 may open an opportunity to go long, but that isn't an optimal range for opening a long position.

Target hit on BTC/USD
The entry price of 117,605 is likely chosen based on technical analysis, where Bitcoin shows bullish signals, such as a breakout above resistance or confirmation from indicators like RSI, MACD, or moving averages. Entering at this price suggests that the trader expects upward momentum to continue, aiming for the target of 118,857.
The stop-loss at 117,000 is set just below a support level to protect against unexpected downward moves. If Bitcoin fails to sustain above the entry zone, this stop-loss helps minimize losses. Setting the stop at a strategic level prevents being stopped out by normal market fluctuations while still managing risk.
The exit price at 118,857 acts as the take-profit level, aligned with a resistance area or projected price target. Exiting at this level ensures that profits are locked in without waiting for unpredictable price reversals.
This trade setup reflects disciplined trading with predefined risk management. Using a clear entry, stop-loss, and exit strategy avoids emotional decision-making. Because BTC/USD is highly volatile, continuous monitoring of price action and market news is essential. Sticking to the plan ensures the trader can capture potential gains while limiting downside risk, making this trade a balanced and calculated approach to cryptocurrency trading.

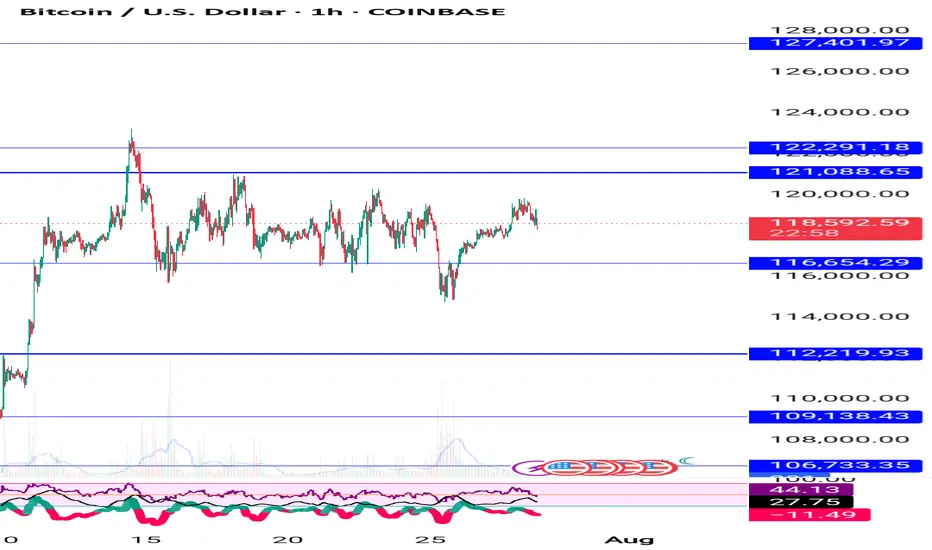
BTCUSD 1D TimeframeBitcoin is trading near $117,800 – $118,400
It’s in a sideways consolidation zone after a strong uptrend
📊 Technical Summary
📈 Trend Direction:
Primary Trend: Bullish (long-term)
Short-Term Trend: Sideways to slightly bullish
Structure: Higher highs and higher lows still intact
🔍 Key Support & Resistance Levels
🟢 Support Zones:
$117,000 — Immediate support zone
$115,000 — Minor demand zone
$112,000 — Key swing low support
$108,000 – $110,000 — Strong base if correction deepens
🔴 Resistance Zones:
$119,000 — Current price ceiling
$121,000 — Breakout target
$123,000 – $125,000 — All-time high resistance area
🧠 Indicators Overview
📌 RSI (Relative Strength Index):
Around 58–60
Shows moderate bullishness — not overbought
📌 MACD (Moving Average Convergence Divergence):
MACD line above signal line, but momentum is weakening
Indicates potential slowing of bullish push
📌 Moving Averages:
20-day EMA: Below price — short-term support
50-day EMA: Also below — confirms mid-term uptrend
200-day EMA: Far below — strong long-term bullish signal
🕯️ Candlestick Behavior
Recent candles are small-bodied: suggests indecision
Wicks both sides: market waiting for next trigger
No bearish reversal patterns visible yet

Institutional Trading🏛️ Institutional Trading 📊
Trade Like the Smart Money
Institutional Trading refers to the high-volume, data-driven buying and selling of financial assets by large entities such as hedge funds, banks, mutual funds, insurance companies, pension funds, and proprietary trading firms. Unlike retail traders, institutional traders have access to advanced tools, deep liquidity, insider networks, and strategic research that give them a significant edge in the market.
These market participants don’t chase price—they move it. Their trades are structured, well-researched, and often hidden from the public eye through techniques like iceberg orders, dark pools, and algorithmic execution.
🔍 Key Features of Institutional Trading:
✅ Volume & Scale: Trades are executed in massive quantities, often spread across multiple venues to avoid detection.
✅ Market Influence: Institutions drive trends and liquidity. Their positioning can define entire market cycles.
✅ Strategic Execution: Every move is planned, including accumulation, distribution, and fakeouts to trap retail participants.
✅ Advanced Tools: They use sophisticated algorithms, AI-based models, high-frequency data, and institutional-grade charting.
✅ Focus on Risk-Reward: Strict risk management and portfolio balancing govern every trade decision.
🚀 Elevate Your Trading:
Learning Institutional Trading isn’t about copying big players—it’s about thinking like them, reading the market through their lens, and upgrading your strategy with smart money logic.
📈 Trade with structure. Trade with logic. Trade like an institution.
