Part 1 Master Candle Sticks PatternRisk Management in Options
Position Sizing: Don’t risk more than 1–2% of capital in one trade.
Stop Loss: Exit before premium erodes completely.
Avoid Over-leverage: Options look cheap but risk is real.
Hedge Positions: Combine with futures or other options.
Psychology of Option Traders
Greed: Chasing high-return trades without risk control.
Fear of Missing Out (FOMO): Jumping in near expiry due to excitement.
Patience: Waiting for correct setup is key.
Discipline: Stick to rules, avoid revenge trading.
Modern Trends in Option Trading
Weekly Expiry Craze: Thursday = biggest trading day.
0DTE (Zero Day to Expiry) Options: Popular for scalping.
Algo & AI Trading: Automated strategies now dominate.
Retail Participation Explosion: India has seen retail option traders grow 5x in 3 years.
BTCMINI trade ideas

Bitcoin fresh buy signal appear now start buying again Bitcoin fresh buy signal appear on harmonic patterns start buying again near support we are holding buy trade from 114900 ,
Support area: 114800-114400 , 113350, 112800
Resistance area: 115600-116020 , 116750-116990 , 118220-118530, 119370-119570
How My Harmonic pattern projection Indicator work is explained below :
Recent High or Low :
D-0% is our recent low or high
Profit booking zone ( Early / Risky entry) : D 11.8% -D 16.1 % is
range if break them profit booking start on uptrend or downtrend but only profit booking, trend not changed
SL reversal zone (Safe entry ) : SL 23% and SL 25% is reversal zone if break then trend reverse and we can take reverse trade
Target : T1, T2, T3, T4 and .
Are our Target zone
Any Upside or downside level will activate only if break 1st level then 2nd will be active if break 2nd then 3rd will be active.
Total we have 7 important level which are support and resistance area
Until , 16% not break uptrend will continue if break then profit booking will start.
If break 25% then fresh downtrend will start then T1, T2,T3 will activate
1,3,5,10,15,20 minutes are short term levels.
30 minutes 60 minutes , 2 hours,3 hours, ... 1 day and 1 week chart positional and long term levels

BTC TRYING TO FORM HEAD & SHOULDERHere in this chart i mentiond ..
1. A trendline in day time frame in blue colour and BTC is about to touch lower trend line.
NOTE:- If i follow the time there is 2 - 5 days remained to take reversal that will depends on lower trend line working as support/resistance.
2. I plotted a pattern HEAD & SHOULDER if it follow pattern it is sure that trend line may be broken by .
But But if BTC follow time it will not break the trend line and will get reversed.
Now this is not my buy/sell call.

India Growth SupercycleIntroduction: What is a Growth Supercycle?
A “growth supercycle” refers to a prolonged period—often spanning decades—when a country or region experiences sustained economic expansion driven by structural changes. It’s not just about one or two years of high GDP growth; rather, it’s a long-term trend powered by deep forces like demographics, industrialization, urbanization, rising consumption, technological adoption, and capital inflows.
History has shown us examples:
The US in the 20th century, after World War II.
Japan from the 1950s to 1980s.
China from the 1990s to 2010s, where hundreds of millions moved out of poverty into middle-class prosperity.
Now, global investors and economists believe India is entering its own multi-decade growth supercycle. With a young population, expanding middle class, strong reforms, and growing global relevance, India is being compared to China in the 2000s—but with its own unique advantages and challenges.
Chapter 1: India’s Growth Journey So Far
India’s path to its current stage has been gradual but consistent:
1. Pre-Liberalization Era (1947–1991)
India gained independence in 1947 and adopted a planned economy with state control over industries, foreign trade, and capital flows.
Growth averaged only 3–4% per year (famously called the “Hindu rate of growth”).
Limited global integration, bureaucratic hurdles, and a heavy public sector slowed momentum.
2. Liberalization Reforms (1991–2000s)
In 1991, a balance of payments crisis forced India to open up its economy.
Reforms under PM P.V. Narasimha Rao and Finance Minister Dr. Manmohan Singh:
Deregulation of industries.
Reduction in tariffs and import restrictions.
Encouragement of private sector participation.
Growth accelerated to 6–7% annually.
3. IT & Services Boom (2000s)
India emerged as the world’s IT outsourcing hub.
Cities like Bengaluru, Hyderabad, and Pune became global tech centers.
Services contributed heavily to GDP; exports boomed.
Growth averaged 7–8%.
4. The Current Era (2014–present)
Reforms like GST, Insolvency & Bankruptcy Code, digitization push, UPI payments, startup ecosystem.
Government focus on Make in India, manufacturing, infrastructure, renewable energy.
Despite global shocks (COVID, Ukraine war, inflation), India maintained one of the highest GDP growth rates globally.
Chapter 2: The Key Drivers of India’s Growth Supercycle
Now let’s look at the forces that will drive India’s rise over the next two to three decades.
1. Demographic Dividend
India has a median age of just 28 years (vs. 38 in the US, 39 in China, 48 in Japan).
Over 65% of the population is below 35.
Each year, 12 million people join the workforce.
A young, working-age population boosts productivity, consumption, and innovation.
Contrast: China and developed economies face aging populations.
2. Rising Middle Class & Consumption
India’s middle class is expected to reach 500 million+ by 2035.
Growing income levels mean more spending on:
Consumer goods
Housing
Automobiles
Travel & lifestyle
Healthcare & education
India is shifting from basic survival consumption (food, shelter) to aspirational consumption (gadgets, cars, brands).
3. Urbanization & Infrastructure
Currently, only 36% of Indians live in cities (vs. 60% in China).
By 2040, 50%+ will be urban.
This will drive:
Construction of smart cities.
Demand for housing, roads, metro rail, airports, and logistics.
Real estate boom.
Infrastructure push: Highways, bullet trains, ports, digital infrastructure.
4. Digital Transformation
India is the world’s fastest-growing digital economy.
Over 850 million internet users.
UPI digital payments leading globally—more transactions than US + China combined.
IndiaStack & Aadhaar enabling financial inclusion.
Growth in AI, e-commerce, fintech, edtech, healthtech.
5. Manufacturing & “China+1” Opportunity
Global companies are diversifying supply chains beyond China.
India has become a preferred alternative due to:
Large labor force.
Government incentives (PLI schemes).
Stable democracy.
Sectors gaining: electronics, semiconductors, EVs, defense, textiles.
6. Global Investments & FDI
Foreign Direct Investment (FDI) inflows hitting records.
Global investors see India as a long-term growth story.
Stock markets reflecting optimism: India is now the 5th largest equity market in the world.
7. Energy & Sustainability Transition
India is targeting net-zero by 2070.
Massive investments in solar, wind, hydrogen energy.
India is also positioning itself as a leader in green tech.
Chapter 3: Sectors Benefiting from the Supercycle
The growth story won’t be uniform—some sectors will be the biggest beneficiaries:
Banking & Financial Services – Rising credit demand, digital banking, financial inclusion.
Infrastructure & Real Estate – Roads, airports, housing, smart cities.
Technology & Digital – IT services, startups, AI, SaaS, e-commerce.
Manufacturing & Exports – Electronics, pharma, textiles, defense.
Energy & Renewables – Solar, hydrogen, EV ecosystem.
Healthcare & Education – Expanding middle class driving quality demand.
Consumer & Retail – FMCG, automobiles, premium lifestyle products.
Chapter 4: Risks & Challenges
No growth story is without challenges. For India, the supercycle path will face hurdles:
Job Creation – 12 million youth enter workforce yearly; quality jobs are needed.
Income Inequality – Urban-rural divide may widen.
Infrastructure Gaps – Speed of execution must match growth.
Geopolitical Risks – India must balance US, China, Russia relationships.
Climate Change & Resource Scarcity – Water stress, pollution, energy demands.
Policy Consistency – Reforms must be steady; bureaucratic delays could hurt.
Chapter 5: The Global Context – Why India Matters Now
The world economy is slowing down: US, Europe facing stagnation, China aging.
India is expected to contribute 15–20% of global growth in the next decade.
Global investors see India as the next growth engine.
India’s democratic setup adds stability compared to authoritarian regimes.
Chapter 6: India in 2047 – A Vision
India will celebrate 100 years of independence in 2047. By then, projections suggest:
India could be a $30–35 trillion economy (from ~$4.3 trillion today).
The largest consumer market in the world.
A hub for manufacturing, technology, and services.
A global leader in renewable energy & digital finance.
Home to the world’s largest middle class.
Conclusion: The India Growth Supercycle is Real
India’s growth is not just about GDP numbers. It is about a civilizational rise—a young nation transforming into a global powerhouse. The combination of demographics, digital adoption, manufacturing push, and global trust in India creates a unique moment in history.
Yes, challenges remain. But the long-term trajectory is clear:
India is entering a multi-decade supercycle of growth, much like the US in the 20th century and China in the 2000s.
For investors, businesses, and global policymakers, ignoring this story would mean missing the biggest growth opportunity of the 21st century.

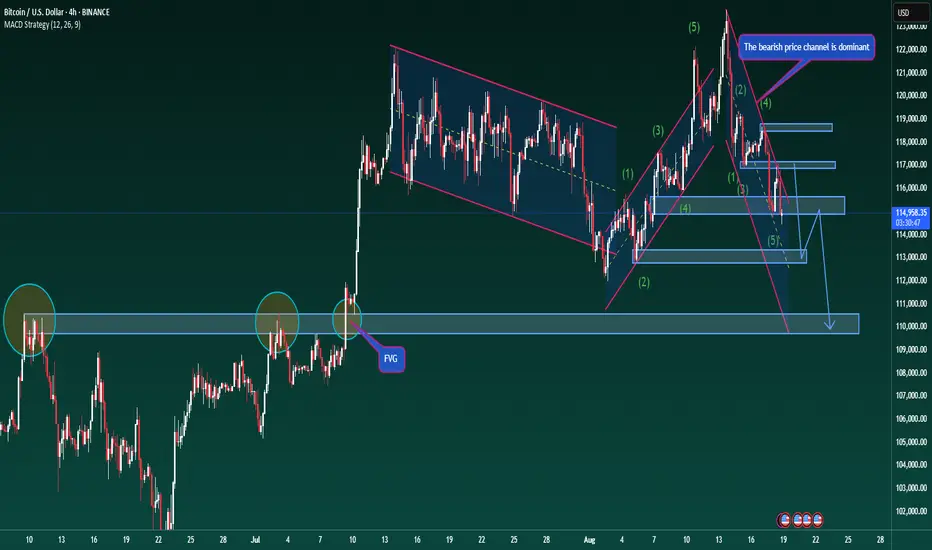
Bitcoin – Updated Trading ScenarioBitcoin – Updated Trading Scenario
BTC followed the expected move by testing the 117,000 zone before turning lower, but it did not align with the anticipated ABC correction under Elliott Wave. At present, price is showing signs of slipping below the 114,700 support, suggesting that the corrective phase may not have ended at the previous wave 5 low.
Based on Dow Theory, the ongoing decline could extend towards the 113,000 area before the market sees a stronger rebound. A descending channel has now formed, and price is reacting well to the upper trendlines, reflecting that short-side pressure remains dominant.
In this context, prioritising short positions in line with the prevailing downtrend may improve the probability of success. The next major target lies near 110,000, where strong resistance clusters from higher timeframes converge.
For short-term traders, it is possible to take advantage of pullbacks towards the channel trendlines to look for quick entries following the main direction. Risk management is key here, and traders should avoid rushing into longs while the corrective leg is still in play.
A downtrend often lasts longer than expected, but once selling pressure fades, the recovery phase can be sharp. Patience and discipline are essential to capture the right opportunity rather than fighting against the flow.
#BTCUSD #Bitcoin #CryptoAnalysis #TechnicalAnalysis #PriceAction #ElliottWave #MACD #CryptoTrading #ForexIndia
Part 2 Support And ResistanceWhy Trade Options?
Leverage – You control large positions with small capital (premium).
Hedging – Protect portfolio from losses. (Insurance-like function).
Speculation – Bet on price movement (up, down, or sideways).
Income Generation – By selling options (collecting premiums).
Example in Real Life
Suppose you think Nifty (index) will go up:
Instead of buying Nifty futures (which needs big margin),
You buy a Nifty Call Option by paying just a small premium.
If Nifty rises, your profit multiplies due to leverage.
If Nifty falls, your maximum loss is only the premium paid.
In simple words: Options = flexibility + leverage + risk control.
They are widely used by retail traders, institutions, and hedgers across the world.

Volume Profile & Market Structure AnalysisIntroduction
Trading in modern markets is not just about spotting random price movements or relying on news flow. Successful traders go deeper — they analyze where market participants are most active, how price is being accepted or rejected, and what the structure of the market is saying about upcoming trends. Two powerful concepts that help traders uncover this hidden order in price action are Volume Profile and Market Structure Analysis.
Volume Profile reveals the where of trading activity — showing price zones where the heaviest buying and selling occurred. Market Structure reveals the how — the way prices move in waves of higher highs and lows or lower highs and lows, mapping the behavior of bulls and bears.
When combined, these tools allow a trader to “read the market’s mind” with more clarity. This is not a guarantee of success but provides a high-probability framework for decision-making.
In this deep dive, we’ll explore:
Basics of volume and its role in markets.
What is Volume Profile, and why is it so effective?
Key components of a Volume Profile chart.
Market Structure — the framework of trends, ranges, and reversals.
How to merge Volume Profile with Market Structure.
Practical strategies for day trading, swing trading, and positional trading.
Examples from global and Indian markets.
Pitfalls, misconceptions, and best practices.
By the end, you’ll see how these concepts can transform your trading into a more structured and probability-driven approach.
1. The Role of Volume in Trading
Before jumping into profiles and structures, let’s understand volume itself.
Volume is the number of shares/contracts traded during a specific period.
It tells us about participation — how many market players are active at a given price or time.
High volume indicates strong interest; low volume shows disinterest.
For example:
A breakout above resistance with high volume = confirmation of strength.
A breakout with low volume = risk of false breakout.
Volume is like the “fuel” behind price. Price may move temporarily without volume, but sustained trends always require strong participation.
2. What is Volume Profile?
While most traders look at volume along the time axis (volume bars at the bottom of a chart), Volume Profile shifts focus to the price axis.
Instead of asking “How much volume happened at 10:15 AM?”, it asks, “How much volume happened at ₹200, ₹201, ₹202, etc.?”
The result is a histogram plotted on the vertical axis, showing which prices attracted the most trading activity.
This gives traders critical insights into:
Fair Value Areas – where buyers and sellers agreed most.
Support & Resistance Zones – where heavy participation occurred.
Liquidity Pools – where big institutions might be hiding orders.
Think of Volume Profile as an X-ray of the market’s backbone. While price candles show the surface moves, the profile shows the depth of interest at each level.
3. Key Components of Volume Profile
When reading a Volume Profile chart, three major zones stand out:
a) Point of Control (POC)
The single price level where maximum volume was traded.
Acts like a “magnet” — price often revisits this level.
Example: If Reliance trades heavily around ₹2,400, that becomes the POC.
b) Value Area (VA)
The zone where about 70% of total volume took place.
Represents the range where most buyers and sellers agreed on “fair value.”
Price staying inside VA = balance; moving outside = imbalance.
c) High/Low Volume Nodes (HVN & LVN)
High Volume Node (HVN): Area with heavy activity, showing strong interest. Often acts as support/resistance.
Low Volume Node (LVN): Area with very little activity, meaning price moved quickly. These act like “gaps” and are often retested.
Together, these elements give traders a precise map of where the market has been and where it might react again.
4. Market Structure: The Skeleton of Price Action
If Volume Profile is the depth chart, Market Structure is the roadmap. It describes how prices move in waves.
The market moves in three basic structures:
a) Uptrend (Higher Highs & Higher Lows)
Buyers dominate.
Each rally breaks previous highs, and each pullback holds above the last low.
b) Downtrend (Lower Highs & Lower Lows)
Sellers dominate.
Each decline breaks previous lows, and each bounce fails below the last high.
c) Range (Sideways Market)
Neither buyers nor sellers dominate.
Price oscillates between support and resistance.
Within these, traders look for:
Break of Structure (BOS): Trend continuation signal.
Change of Character (CHOCH): Trend reversal signal.
Liquidity Zones: Levels where stop-losses and orders cluster.
Market structure helps answer: “Where are we in the cycle — trending up, trending down, or consolidating?”
5. Merging Volume Profile with Market Structure
This is where magic happens. On their own, both tools are powerful. But together, they create a context + confirmation framework.
Examples:
In an uptrend, if price pulls back to a POC or HVN, it’s a high-probability bounce zone.
In a downtrend, price rejecting from a Value Area High (VAH) confirms seller dominance.
During a range, LVNs show breakout points where price may move sharply once imbalance occurs.
Think of it like this:
Market Structure = Direction (Trend/Range)
Volume Profile = Levels (Support/Resistance zones)
Together, they give traders both the where and the when to act.
6. Practical Trading Strategies
a) Intraday Trading with Volume Profile
Identify the previous day’s POC, VAH, and VAL.
Watch how price reacts around these levels.
Example: If Nifty opens above VAH and holds, intraday longs may work.
b) Swing Trading with Market Structure
Use daily/weekly structure to determine trend.
Align entries at profile levels (HVN support in an uptrend).
Example: Buy Infosys on pullback to VA near ₹1,500 if market structure shows higher highs.
c) Positional Trading with Combined Approach
Look for macro structure (monthly trend).
Use Volume Profile to refine entry/exit points.
Example: Banking index in long-term uptrend — add positions on dips to POC levels.
7. Real-World Examples (Indian Markets)
Nifty 50: In major uptrends, Nifty often consolidates near HVNs before the next breakout. Volume Profile shows exact “accumulation zones.”
Reliance Industries: Stock frequently rejects LVNs after gaps, offering trade setups for intraday scalpers.
Bank Nifty: Heavily influenced by institutional volume, making profile levels extremely reliable for support/resistance.
8. Pitfalls and Misconceptions
Overcomplication: Beginners clutter charts with too many profiles. Stick to daily/weekly levels.
Blind Trust: POC is not magic; always confirm with market structure.
Ignoring Context: Profile levels in isolation mean little. Combine with trend, news, and market sentiment.
9. Best Practices
Always analyze higher timeframe structure first.
Use Volume Profile to fine-tune entry/exit zones.
Avoid trading against strong structure unless evidence of reversal.
Keep charts clean — focus on 2–3 levels max.
Combine with risk management (stop-loss at LVNs, targets near HVNs).
10. Conclusion
Volume Profile and Market Structure are like two lenses that bring market behavior into focus. One shows the depth of participation at each price, and the other shows the framework of trends and ranges.
When you master these tools:
You stop guessing support/resistance.
You understand why price reacts at certain levels.
You trade with the institutions, not against them.
Whether you’re an intraday trader looking for precise scalp entries or a long-term investor identifying accumulation zones, this combination offers an edge.
The market is not random. Behind every move lies a structure — and behind every structure lies volume. Volume Profile & Market Structure Analysis together help you decode this hidden order, making you a smarter and more confident trader.
BITCOIN START OF THE WEEK: IS A BULLISH REVERSAL ON THE CARDS?BITCOIN START OF THE WEEK: IS A BULLISH REVERSAL ON THE CARDS?
Hello traders, and welcome to a new week of trading!
Our plan for Bitcoin (BTC) has been executing precisely as anticipated. We've seen the price hit the $115,000 zone, and it is now showing signs of a potential reversal. This is a critical point to watch to confirm the next move.
Elliot Wave & FVG Analysis
Based on our Elliot Wave model, it appears that the fifth wave of the recent correction is complete. Notably, this price level coincides with a Fair Value Gap (FVG), a zone of low liquidity where we often see a strong market reaction.
It's important to remember that this recent decline is likely just a corrective move within BTC's larger, dominant bullish trend. With the fifth wave of this correction seemingly finished, we expect a strong rebound in the form of an ABC wave pattern. If this scenario plays out, we could see BTC targeting and setting new All-Time Highs (ATHs) in the near future.
Key Price Levels to Monitor
Breakout Confirmation: The $118,600 level is a crucial resistance zone. A sustained break and hold above this price would provide a strong confirmation for the bulls, indicating they have the liquidity to push the price significantly higher.
Key Support: If the price fails to break above $118,600 and continues to move down, we must keep a close eye on the $114,000 support level. A breakdown below this point could trigger a deeper correction.
Trading Strategy for the Week
Our trading plan for the start of the week remains to Long (buy).
Entry Point: Consider an entry for a long position around the current price of $115,000.
Target: Hold the position for a medium-term target if the price successfully breaks above the $118,600 zone.
Wishing you a profitable week with this trading plan!

BTCUSD NEXT MOVE (17/08/2025)BTCUSD UPDATEDE
Current price -118300
If price stay below 121000,then next target 116000,114000,111000 and above that 125000
Plan; if price break 118300-119000 area and below that 118000area,we will place sell oder in BTCUSD with target of 116000,114000 and 111000 & stop loss should be placed at 121000

Bitcoin (BTC) Technical Update🚨 Bitcoin (BTC) Technical Update 🚨
Bitcoin is currently trading around $118,227, showing consolidation after the recent sharp move.
🔹 Price is moving inside a rising wedge (purple trendlines), which is generally a bearish pattern.
🔹 Strong resistance sits near $118,600 – $119,000. A breakout above this could trigger bullish momentum.
🔹 On the downside, support levels to watch are:
$117,700 (first support)
$116,700 (major support)
Deeper support zones: $114,700 and $112,300
📊 Key Takeaway:
BTC is at a critical resistance. If it fails to break higher, we may see a pullback toward the $116k–$114k zones. A confirmed breakout above $119k could open the way for further upside.
⚡ Levels to Watch:
Resistance: $118,600 – $119,000
Support: $117,700 | $116,700 | $114,700 | $112,300
#Bitcoin #BTC #Crypto #Trading #CryptoAnalysis #PriceAction

Paer 6 Learn Institutional Trading Options Trading Strategies
Basic Strategies
Long Call → Buy call, bullish.
Long Put → Buy put, bearish.
Covered Call → Own stock + sell call for income.
Protective Put → Own stock + buy put for protection.
Intermediate Strategies
Straddle: Buy Call + Put at same strike (bet on volatility).
Strangle: Buy Call (higher strike) + Put (lower strike).
Bull Call Spread: Buy low strike call + sell higher strike call.
Bear Put Spread: Buy put + sell lower strike put.
Advanced Strategies
Iron Condor: Range-bound strategy selling OTM call + put spreads.
Butterfly Spread: Profit from low volatility near strike.
Ratio Spreads: Adjust risk/reward with multiple options.
Margin Requirements & Leverage
Option buyers: Pay only premium (small capital).
Option sellers (writers): Need large margin (higher risk).
NSE SPAN + Exposure margin system determines requirements.
For example, selling 1 lot of Bank Nifty option may require ₹1.5–2 lakh margin depending on volatility.

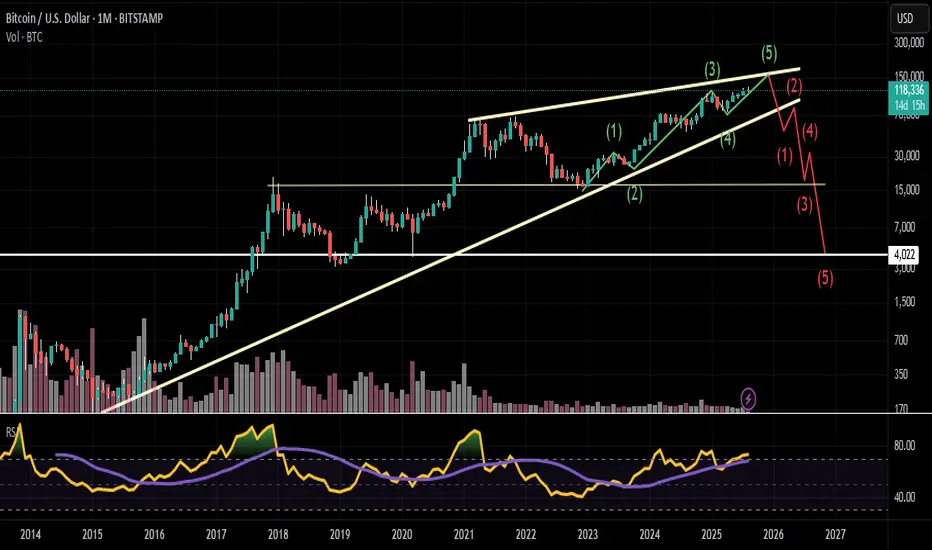
Is 2026 biggest crash ? for Global Market as per Trump SentimentThis time bull market are behaving different scenario if happen same and trump will move global market as per his sentiment the 2026 will be the biggest crash for Global Market ?
Currency Trading in India1. Introduction to Currency Trading in India
Currency trading, also known as forex (foreign exchange) trading, is the process of buying and selling currencies with the objective of making profits from changes in exchange rates. Globally, forex is the largest financial market, with daily turnover exceeding $7 trillion (as per BIS data 2022). While India participates in this market, the framework here is unique, regulated, and more restricted compared to global forex trading hubs.
In India, currency trading has gained popularity over the last 15 years. Earlier, it was limited to importers, exporters, and banks managing foreign exchange risk. But today, thanks to currency derivatives trading on Indian exchanges, retail traders and investors can also participate in this market in a regulated and transparent manner.
Currency trading in India is not just speculation — it is also a powerful tool for hedging against currency risk, especially important for companies dealing with international transactions. With the growth of globalization, IT exports, tourism, e-commerce, and cross-border investments, currency trading has become a critical part of India’s financial markets.
2. Regulatory Framework for Currency Trading in India
Unlike global forex markets where traders can trade almost any currency pair, India has a strict regulatory environment. This is mainly because the Reserve Bank of India (RBI) and the Securities and Exchange Board of India (SEBI) want to avoid excessive speculation and protect the Indian Rupee (INR) from volatility.
Key Regulators
Reserve Bank of India (RBI):
Oversees currency exchange rules.
Manages foreign exchange reserves.
Ensures stability of the Indian Rupee.
Securities and Exchange Board of India (SEBI):
Regulates exchanges where currency derivatives are traded.
Ensures fair practices, transparency, and investor protection.
Foreign Exchange Management Act (FEMA), 1999:
Governs all forex-related activities in India.
Restricts unregulated forex trading.
Ensures that all forex transactions are legal and monitored.
Legal vs. Illegal Forex Trading
Legal: Trading in currency derivatives on recognized exchanges (NSE, BSE, MSE) and through authorized brokers.
Illegal: Using online/offshore forex platforms that offer pairs beyond INR-based pairs (like EUR/USD, GBP/USD, etc.) is not allowed for Indian residents.
This distinction is very important: many global forex brokers advertise heavily, but Indian traders must stick to RBI-SEBI regulated avenues.
3. Currency Pairs Allowed for Trading in India
In India, only certain currency pairs are permitted:
INR-based pairs (Most Popular)
USD/INR
EUR/INR
GBP/INR
JPY/INR
Cross-currency pairs (Introduced in 2015)
EUR/USD
GBP/USD
USD/JPY
This gives traders some exposure to global majors, but the options are still narrower than the global forex market where 100+ pairs are available.
4. Currency Derivatives in India
Retail currency trading in India happens through currency derivatives, not spot forex.
Types of Contracts Available
Currency Futures
Standardized contracts to buy/sell a currency pair at a future date.
Example: Buying USD/INR futures at 84.20 if you expect the rupee to weaken.
Currency Options
Contracts that give the right (but not the obligation) to buy or sell a currency pair at a set price.
Example: Buying a call option on USD/INR if you expect USD to rise against INR.
Lot Size
Standard lot size: USD 1,000, EUR 1,000, GBP 1,000, JPY 100,000.
This makes contracts accessible to retail traders (lower margin requirement compared to global forex).
5. Currency Trading Platforms in India
Currency trading is conducted on recognized exchanges:
National Stock Exchange (NSE)
Bombay Stock Exchange (BSE)
Metropolitan Stock Exchange (MSE)
Brokers provide trading terminals like Zerodha Kite, Upstox Pro, Angel One, ICICI Direct, HDFC Securities, Kotak Securities, etc. Orders placed by retail traders flow to the exchange, ensuring transparency.
6. Participants in Indian Currency Market
The Indian currency market has diverse participants:
Importers & Exporters – Hedge against foreign exchange fluctuations.
Banks & Financial Institutions – Manage forex exposure and provide liquidity.
Corporate Houses – Hedge overseas borrowings and investments.
Retail Traders & Investors – Speculate on currency price movements.
RBI – Intervenes in the market to stabilize the rupee.
This mix ensures a healthy balance of hedging, speculation, and regulation.
7. Why Do People Trade Currencies in India?
Hedging: Businesses protect themselves against adverse currency movements.
Speculation: Traders aim to profit from short-term price fluctuations.
Arbitrage: Taking advantage of price differences in different markets.
Diversification: Provides exposure beyond equities and commodities.
Example:
If an IT company receives payments in USD, but expects INR to appreciate, it may hedge using USD/INR futures to protect its revenue.
8. Trading Hours and Settlement
Trading Hours: 9:00 AM – 5:00 PM (Monday to Friday).
Settlement: Currency futures and options are cash-settled in INR (no actual delivery of foreign currency).
This makes it simple for retail traders, as they don’t need actual forex accounts abroad.
9. Key Factors Affecting Currency Movements in India
Interest Rates – Higher interest rates attract foreign capital → strengthens INR.
Inflation – High inflation weakens currency.
Trade Balance – Deficit puts pressure on INR.
FDI & FPI Flows – Foreign inflows strengthen rupee, outflows weaken it.
Global Cues – USD Index, crude oil prices, geopolitical tensions.
RBI Intervention – Active buying/selling of USD to control volatility.
Example:
If crude oil prices rise sharply, India’s import bill increases, leading to pressure on INR.
10. Advantages of Currency Trading in India
Low margin requirement compared to equities.
High liquidity in USD/INR contracts.
Effective hedging tool for businesses.
Transparent, regulated environment.
Opportunity to diversify portfolio.
11. Risks of Currency Trading
High Volatility: Exchange rates can swing suddenly due to global events.
Leverage Risk: Small margin → higher exposure → bigger losses possible.
Regulatory Limits: Fewer pairs compared to global forex restrict opportunities.
Event Risk: Unexpected RBI decisions, US Fed policy, or geopolitical shocks.
12. Popular Strategies for Currency Trading in India
Trend Following Strategy
Trade in the direction of the prevailing trend.
Example: If USD/INR is making higher highs, go long.
Range Trading Strategy
Identify support and resistance levels.
Buy near support, sell near resistance.
News-Based Trading
Trade during events like RBI policy, Fed announcements, inflation data.
Hedging Strategy
Businesses use futures/options to hedge risk.
Carry Trade (Limited in India)
Borrow in a low-interest currency, invest in a higher-interest one.
Mostly global, but institutions sometimes use it.
13. Myths vs Reality
Myth: Forex trading is banned in India.
Reality: Unregulated offshore forex trading is illegal, but regulated currency derivatives are fully legal.
Myth: Currency trading always requires huge capital.
Reality: With lot size of USD 1,000, small traders can participate.
Myth: RBI fixes currency prices.
Reality: INR is managed, not fixed. RBI intervenes only to reduce volatility.
14. Conclusion
Currency trading in India is a growing and exciting market, but it operates within strict regulatory boundaries. Traders can participate in INR-based and selected cross-currency derivatives on NSE, BSE, and MSE. For businesses, it is a vital tool for hedging. For retail investors, it provides diversification and speculative opportunities with relatively small capital.
However, risks are significant — especially leverage and volatility — and traders must combine fundamental knowledge, technical analysis, and sound risk management to succeed. With globalization and increasing cross-border flows, the importance of India’s currency market will only rise in the coming years.
In short, currency trading in India is not just about speculation, but about managing risks, diversifying portfolios, and understanding the global financial system.

Divergence SecretsHow Options Work in Trading
Imagine a stock is trading at ₹1,000.
You believe it will rise to ₹1,100 in a month. You could:
Buy the stock: You need ₹1,000 per share.
Buy a call option: You pay a small premium (say ₹50) for the right to buy at ₹1,000 later.
If the stock rises to ₹1,100:
Stock profit = ₹100
Call option profit = ₹100 (intrinsic value) - ₹50 (premium) = ₹50 net profit (but with much lower capital).
This leverage makes options attractive but also risky — if the stock doesn’t rise, your premium is lost.
Categories of Options Strategies
Options strategies can be divided into three main categories:
Directional Strategies – Profit from price movements.
Non-Directional (Neutral) Strategies – Profit from sideways markets.
Hedging Strategies – Protect existing positions.

Bitcoin Technical Analysis📊 Chart Pattern Setup:
Price is consolidating within an Ascending Triangle after sharp drop.
Key Fibonacci Levels in play:
0.382 Fib = $117,803 (short-term resistance)
0.618 Fib = $118,370 (major breakout level)
Ascending Triangle Target → $118,950+
Flag Pattern Target (bearish invalidation) → $114,995
🟢 Bullish Case:
If BTC breaks above $117,800 – $118,400 zone with volume, upside targets are:
$118,950 → $119,300 → $120,300
🔴 Bearish Case:
If price fails to hold $117,450 support, expect correction towards:
$116,900 → $115,000
💡 Bias: Watching $117,800 – $118,400 breakout zone closely. Breakout = 🚀, breakdown = ⚠️ deeper retrace.
#BTC #Bitcoin #Crypto #CryptoTrading #PriceAction #BTCUSD #CryptoCharts #TechnicalAnalysis #DayTrading #CryptoSignals

BTCUSD-Eyes on Bullish PullbackPrice action formed a clean pullback into prior support after an earlier rally.
Multiple Buy signals have appeared at the lows, with the latest near a previous Liquidity Control Box.
The yellow caution label triggered near the top earlier, signaling possible short-term exhaustion — now invalidated as price re-approaches structure.
🔍 Trade Structure (Educational Reference):
Observed Entry Zone: Near 117,840 after reclaiming short-term EMA
Stop Level: Below 117,379 (beneath structure low)
Potential Target: 121,102 — aligns with higher timeframe imbalance and previous untested levels
🧠 SignalPro Notes:
The earlier Sell signals followed by failed downside continuation show weakening bearish control.
EMA realignment in progress — continued strength above white EMA could accelerate momentum.
⚠️ This chart and analysis are for educational purposes only. It is not financial advice. Please perform your own analysis and manage risk carefully.

Inflation & Equity Market PerformanceIntroduction
Inflation is one of the most important macroeconomic variables that influences financial markets worldwide. Equity markets, in particular, are highly sensitive to inflationary pressures because inflation affects corporate earnings, consumer spending, interest rates, and investor sentiment. For traders and long-term investors alike, understanding how inflation interacts with equity market performance is crucial in building strategies, managing risks, and identifying opportunities.
This discussion will dive into the dynamics between inflation and equity markets, exploring historical evidence, economic theory, sectoral performance, and practical strategies for navigating inflationary cycles. We will also focus on the Indian context while connecting it with global market behavior.
1. Understanding Inflation
1.1 Definition
Inflation refers to the sustained increase in the general price level of goods and services in an economy over time. It reduces the purchasing power of money, meaning that each unit of currency buys fewer goods and services.
1.2 Types of Inflation
Demand-Pull Inflation – Occurs when demand for goods and services outpaces supply. Example: During economic booms.
Cost-Push Inflation – Caused by rising production costs (e.g., higher wages, energy prices, raw materials).
Built-In Inflation – When businesses and workers expect prices to rise, wages increase, and costs get passed to consumers, creating a feedback loop.
Stagflation – A mix of stagnant growth and high inflation, often damaging for equity markets.
1.3 Measuring Inflation
Consumer Price Index (CPI): Measures retail inflation.
Wholesale Price Index (WPI): Reflects wholesale price trends.
GDP Deflator: Broader measure capturing inflation in all goods and services.
2. The Link Between Inflation and Equity Markets
2.1 Theoretical Framework
Discounted Cash Flow (DCF) Model: Equity valuations are based on the present value of future cash flows. Higher inflation often leads to higher interest rates, which raise discount rates and reduce present values of stocks.
Corporate Earnings: Inflation can squeeze profit margins if companies cannot pass on higher costs to consumers. However, some firms benefit (e.g., commodity producers).
Investor Sentiment: Persistent inflation creates uncertainty. Equity investors tend to become cautious, reallocating funds to safer assets like bonds, gold, or real estate.
2.2 Historical Evidence
U.S. in the 1970s: High inflation led to stagflation and poor equity returns.
India in 2010–2013: High CPI inflation (driven by food and fuel) correlated with weaker equity performance and high volatility.
Post-COVID (2021–2022): Global inflation surged, leading central banks (Fed, RBI) to raise rates. Equity markets corrected sharply, particularly in high-growth tech stocks.
3. Inflation’s Impact on Different Equity Sectors
3.1 Beneficiaries of Inflation
Energy Sector: Oil, gas, and coal companies often benefit when commodity prices rise.
Metals & Mining: Higher input costs increase revenues for miners and producers.
FMCG (Fast-Moving Consumer Goods): Large players with pricing power pass costs to consumers.
Banks & Financials: Rising interest rates can improve net interest margins.
3.2 Losers in High Inflation
Technology & Growth Stocks: Valuations fall as future earnings are discounted at higher rates.
Consumer Discretionary: Higher prices reduce demand for non-essential goods.
Real Estate Developers: Financing costs increase, reducing affordability.
Export-Oriented Businesses: Inflation in the domestic economy can raise costs, hurting competitiveness.
4. Inflation & Monetary Policy – The Central Bank Connection
4.1 Interest Rates and Equities
Central banks, such as the Federal Reserve (US) or Reserve Bank of India (RBI), control inflation through monetary policy. When inflation rises, they typically:
Increase policy rates (Repo Rate in India) → Higher borrowing costs → Reduced spending & investment → Slower growth.
This cools inflation but often pressures equity markets.
4.2 Liquidity Conditions
Quantitative Tightening (QT): Withdraws liquidity → bearish equities.
Quantitative Easing (QE): Injects liquidity → bullish equities.
4.3 Inflation Targeting in India
RBI targets 4% CPI inflation (with 2%–6% tolerance band).
Persistent inflation above 6% often triggers aggressive monetary tightening, negatively impacting Indian equities.
5. Inflation & Valuation Metrics
5.1 Price-to-Earnings (P/E) Ratios
High inflation → low P/E ratios because of lower growth expectations and higher discount rates.
Low/moderate inflation → supportive of higher P/E multiples.
5.2 Earnings Yield vs. Bond Yields
Investors compare stock earnings yield (E/P) with government bond yields.
If inflation pushes bond yields higher, equities look less attractive → rotation from stocks to bonds.
6. Historical Lessons: Global and Indian Perspectives
6.1 Global Case Studies
1970s U.S. Stagflation: Equity markets fell as inflation surged with low growth.
2008 Crisis Aftermath: Inflation was subdued due to weak demand, equities benefited from low rates and QE.
2021–22 Inflation Surge: Tech-heavy Nasdaq corrected sharply as the Fed hiked rates.
6.2 Indian Market Episodes
2010–2013: Double-digit food inflation, rupee depreciation, and high crude oil prices → Nifty struggled.
2014–2017: Low inflation and falling crude oil → equity boom.
2020 Pandemic: Initially deflationary shock, followed by massive liquidity injection → market rally.
2022 RBI Tightening: Nifty saw corrections as CPI spiked above 7%.
7. Sectoral Rotation During Inflation Cycles
Early Inflation Phase: Commodities, energy, and value stocks outperform.
High Inflation Phase: Defensive sectors (FMCG, healthcare, utilities) attract investors.
Disinflation Phase: Technology, financials, and growth-oriented sectors recover.
This sectoral rotation is crucial for traders and investors in building adaptive portfolios.
8. Inflation & Investor Behavior
8.1 Equity vs. Alternative Assets
Gold: Acts as a hedge against inflation.
Bonds: Suffer when inflation rises because real yields fall.
Real Estate: Often seen as inflation-protected asset.
8.2 Risk Appetite
High inflation reduces risk appetite, increasing volatility (India VIX rises).
9. Strategies for Trading & Investing During Inflation
9.1 Long-Term Investors
Focus on companies with pricing power.
Diversify into sectors that benefit from inflation.
Avoid overvalued growth stocks during high inflation cycles.
9.2 Traders
Monitor CPI/WPI releases and RBI/Fed policy meetings.
Use sectoral rotation strategies to capitalize on changing trends.
Hedge equity exposure with gold, commodities, or inflation-indexed bonds.
9.3 Portfolio Hedging Tools
Options Strategies: Protective puts during volatile periods.
Sector ETFs/Mutual Funds: To align with inflationary themes.
Diversification across geographies: Inflation is not synchronized globally.
10. The Indian Context – Looking Ahead
India is particularly sensitive to inflation due to:
Dependence on crude oil imports.
Large share of food inflation in CPI basket.
Impact on rural consumption.
Looking forward:
Moderate inflation (4%–5%) is equity-friendly.
Persistent high inflation (>6%) may trigger RBI tightening, leading to equity corrections.
Global spillovers (U.S. Fed policy, crude prices, geopolitical risks) will continue influencing Indian equity performance.
Conclusion
The relationship between inflation and equity market performance is complex, multi-dimensional, and highly time-dependent. While moderate inflation is healthy and often correlates with rising corporate earnings, high and persistent inflation erodes returns, increases volatility, and shifts investor preference towards defensive assets.
For investors in India and globally, the key is to track inflation trends, understand sectoral impacts, and adapt strategies accordingly. Inflation is not just an economic statistic—it is a force that reshapes market cycles, dictates central bank policy, and influences long-term wealth creation in equities.

Weekend BTC Update: Is Elliott Wave 3 Underway?Weekend BTC Update: Is Elliott Wave 3 Underway?
Hey everyone,
The weekend is here, and BTC is moving exactly as per our recent analysis. This post is a quick update on the current trend and a potential trading strategy based on Technical Analysis, specifically the Elliott Wave Theory.
Elliott Wave Analysis: Is Wave 3 Here?
Looking at the H4 chart, we are anticipating the start of a new Elliott Wave structure, and Wave 3 appears to be forming. This is a crucial signal for traders looking for a solid entry.
For this trend to continue, the key condition is that the support zone at $119.35k must hold.
If this level remains unbroken, we can confidently look for Long positions on BTC.
Simple & Effective Trading Strategy
Based on this scenario, here's how you can plan your trade:
Entry Point: Wait for the price to retest (come back to) the support zone near $119.35k.
Stop Loss: Place your stop loss just below this level, approximately 100 BTC points away to manage your risk.
Take Profit Target 1: Wave 3 is expected to push BTC towards the $115k zone to fill the previously formed market gap. After this, a Wave 4 pullback may begin.
The Big Opportunity: Wave 5
Wave 5 is typically a high-volume, high-liquidity move in Elliott Wave theory. For traders who prefer a safer approach with a longer-term take profit target, it's wise to wait and enter a position during Wave 5.
A Trader's Reminder
In a global market with so much geopolitical uncertainty, sticking purely to Technical Analysis is a great way to stay disciplined. It helps us avoid FOMO (Fear of Missing Out) and make objective, data-driven decisions.
Always practice sound risk management. Happy trading, and may your weekend be profitable!
BTC/USDThe BTC/USD trade with an entry price of 117,000, stop-loss at 116,404, and exit price at 116,932 has successfully achieved its target, marking it as a profitable short-term sell trade. This setup was structured to capture a downward move in Bitcoin’s price, with a potential gain of 68 points while keeping risk under control. The trade reflects precise planning, as the target was reached efficiently without triggering the stop-loss.
The entry level at 117,000 was carefully selected, likely at or near a resistance zone where price showed signs of rejection or bearish signals from indicators such as RSI or MACD. This confirmed the potential for a downward move.
The stop-loss at 116,404 was set strategically to protect against sudden volatility and unexpected price spikes. Although it was close enough to manage risk effectively, the market respected the direction of the trade and did not test this level.
The exit price at 116,932 acted as a take-profit point aligned with short-term support, ensuring profits were secured before any reversal.
This successful target hit highlights the importance of discipline, technical analysis, and strict risk management in BTC/USD trading, especially in a highly volatile market.

Part 3 Learn Institutional TradingDirectional Strategies
These are for traders with a clear market view.
Long Call (Bullish)
When to Use: Expecting significant upward movement.
Setup: Buy a call option.
Risk: Limited to premium paid.
Reward: Unlimited.
Example: NIFTY at 20,000, you buy 20,100 CE for ₹100 premium. If NIFTY closes at 20,500, your profit = ₹400 - ₹100 = ₹300.
Long Put (Bearish)
When to Use: Expecting price drop.
Setup: Buy a put option.
Risk: Limited to premium.
Reward: Large if the asset falls.
Example: Stock at ₹500, buy 480 PE for ₹10. If stock drops to ₹450, profit = ₹30 - ₹10 = ₹20.
Covered Call (Mildly Bullish)
When to Use: Own the stock but expect limited upside.
Setup: Hold stock + Sell call option.
Risk: Stock downside risk.
Reward: Premium income + stock gains until strike price.
Example: Own Reliance at ₹2,500, sell 2,600 CE for ₹20 premium.

Intraday Scalping & Momentum Trading1. Introduction
In the high-speed world of financial markets, two strategies stand out for traders who thrive on quick decisions and rapid results: Intraday Scalping and Momentum Trading.
While both are short-term trading styles, they differ in execution speed, trade duration, and the logic behind entries and exits.
Intraday Scalping focuses on capturing tiny price movements — sometimes just a few points — multiple times throughout the trading session.
Momentum Trading aims to ride significant price moves caused by strong buying or selling pressure, often holding positions for minutes to hours until the trend exhausts.
In both strategies:
Speed is critical.
Precision is non-negotiable.
Discipline is the backbone.
2. The Core Concepts
2.1 Intraday Scalping
Scalping is like market sniping — taking small, precise shots. The goal is not to hit a home run but to consistently hit singles that add up.
Key traits:
Very short holding times (seconds to a few minutes).
Multiple trades per day (5–50+ depending on style).
Targets are small (0.1%–0.5% price move per trade).
Relies on high liquidity and tight bid-ask spreads.
Example:
Stock XYZ is trading at ₹100.25/₹100.30.
Scalper buys at ₹100.30.
Price ticks up to ₹100.40 in 30 seconds.
Exit at ₹100.40 — profit of ₹0.10 per share.
Tools used:
Level 2 order book (market depth).
Time & sales tape.
Tick charts (1-min, 15-sec).
Volume profile for micro-trends.
2.2 Momentum Trading
Momentum trading is like surfing a wave. Once a strong move starts (due to news, earnings, sector activity, or breakout), momentum traders jump in to ride the surge until it slows.
Key traits:
Holding time is longer than scalping (minutes to hours).
Focus on directional moves with high relative volume.
Larger price targets (0.5%–3% or more per trade).
Relies on trend continuation until exhaustion.
Example:
Stock ABC breaks resistance at ₹250 on high volume after earnings.
Trader buys at ₹252 expecting further upside.
Price runs to ₹260 before showing weakness.
Exit at ₹259 — profit of ₹7 per share.
Tools used:
1-min to 15-min charts.
Moving averages for trend confirmation.
Relative Volume (RVOL) scanners.
Momentum oscillators like RSI, MACD.
3. Scalping vs Momentum — Quick Comparison
Feature Scalping Momentum Trading
Trade Duration Seconds to few minutes Minutes to hours
Profit Target 0.1%–0.5% 0.5%–3%+
Risk per Trade Very small Small to medium
Frequency High (10–50 trades/day) Moderate (2–10 trades/day)
Chart Timeframes Tick, 15s, 1m 1m, 5m, 15m
Market Conditions High liquidity, volatile Trending, news-driven
Mindset Ultra-fast decisions Patient within trend
4. Market Conditions Suitable for Each
Scalping Works Best When:
Market is choppy but liquid.
Bid-ask spread is tight.
Price moves in micro-waves.
There is high intraday volatility without a clear trend.
Momentum Works Best When:
Market has strong trend days.
There’s a news catalyst or earnings.
Breakouts/breakdowns occur with volume surge.
A sector rotation drives capital into specific stocks.
5. Technical Tools & Indicators
For Scalping
VWAP (Volume Weighted Average Price) – Used as a magnet for price action; scalpers fade moves away from VWAP or trade rejections.
EMA 9 & EMA 20 – For micro-trend direction.
Order Flow Analysis – Reading the tape to identify big orders.
Bollinger Bands (1-min) – Spotting overextensions.
Volume Profile – Identifying intraday support/resistance.
For Momentum
Moving Averages (EMA 20, EMA 50) – Identify trend continuation.
MACD – Confirm momentum strength.
RSI (5 or 14 period) – Spotting overbought/oversold within a trend.
Breakout Levels – Pre-marked resistance/support zones.
Relative Volume (RVOL) – Ensures trade is supported by unusual buying/selling pressure.
6. Strategies
6.1 Scalping Strategies
A) VWAP Bounce Scalping
Wait for price to pull back to VWAP after a quick move.
Enter on rejection candles.
Exit after a small bounce.
B) Breakout Scalping
Identify micro-breakouts from 1-min consolidation.
Enter just before the breakout.
Exit within seconds once target is hit.
C) Market Maker Following
Watch for large limit orders on Level 2.
Follow their buying/selling pressure.
Exit when big order disappears.
6.2 Momentum Strategies
A) News Catalyst Plays
Scan for stocks with fresh positive/negative news.
Wait for first pullback after breakout.
Ride until momentum slows.
B) Trend Continuation
Identify stock above VWAP and moving averages.
Enter on EMA 9/EMA 20 bounce.
Exit when price closes below EMA 20.
C) High Relative Volume Breakouts
Use RVOL > 2.0 filter.
Enter when volume spikes confirm breakout.
Place stop-loss just under breakout level.
7. Risk Management
Both scalping and momentum trading require tight stop-losses because small moves against you can quickly turn into bigger losses.
For Scalping:
Stop-loss: 0.1%–0.3%.
Risk per trade: ≤ 0.5% of account.
Don’t average down — cut losses immediately.
For Momentum:
Stop-loss: 0.5%–1.5%.
Risk per trade: ≤ 1% of account.
Trail stops to lock in profits.
General Rules:
Use position sizing: Risk Amount ÷ Stop Size = Position Size.
Always account for slippage.
Never risk more than you can afford to lose in a single day.
8. Trading Psychology
For Scalpers:
Stay hyper-focused. Avoid hesitation. The moment you second-guess, the trade is gone. Mental fatigue sets in quickly — take breaks.
For Momentum Traders:
Patience is key. Don’t exit too early from fear or greed. Stick to the plan and avoid chasing after missed moves.
Mind Traps to Avoid:
Overtrading.
Revenge trading after a loss.
Ignoring stop-loss because “it might bounce back.”
Letting small losses turn into big ones.
9. Examples of a Trading Day
Scalping Example
9:20 AM: Identify stock XYZ near pre-market resistance.
9:25 AM: Scalper enters on small pullback.
9:26 AM: Price moves 0.15% up — exit instantly.
Repeat 12–15 times, ending with 8 wins, 4 losses.
Momentum Example
9:25 AM: News drops on ABC Ltd.
9:30 AM: Stock gaps up 3%, breaks resistance with volume.
Buy at ₹252, hold for 20 minutes as it climbs to ₹259.
Exit when volume declines and price closes under EMA 20.
10. Common Mistakes
Scalping:
Entering in low-volume stocks → big slippage.
Over-leveraging.
Trading during low volatility periods.
Momentum:
Chasing moves without pullback.
Ignoring broader market trend.
Overstaying in trade after momentum fades.
11. Advanced Tips
Use hotkeys to speed up entries and exits.
Trade during high liquidity hours (first and last 90 minutes of market).
Combine pre-market analysis with real-time setups.
Keep a trading journal to refine entries/exits.
12. Conclusion
Intraday Scalping and Momentum Trading are high-performance trading styles that can generate consistent profits for skilled traders — but they’re not for the faint-hearted.
They require:
Quick decision-making.
Iron discipline.
Solid risk management.
Technical precision.
The golden rule is: protect your capital first, profits will follow.
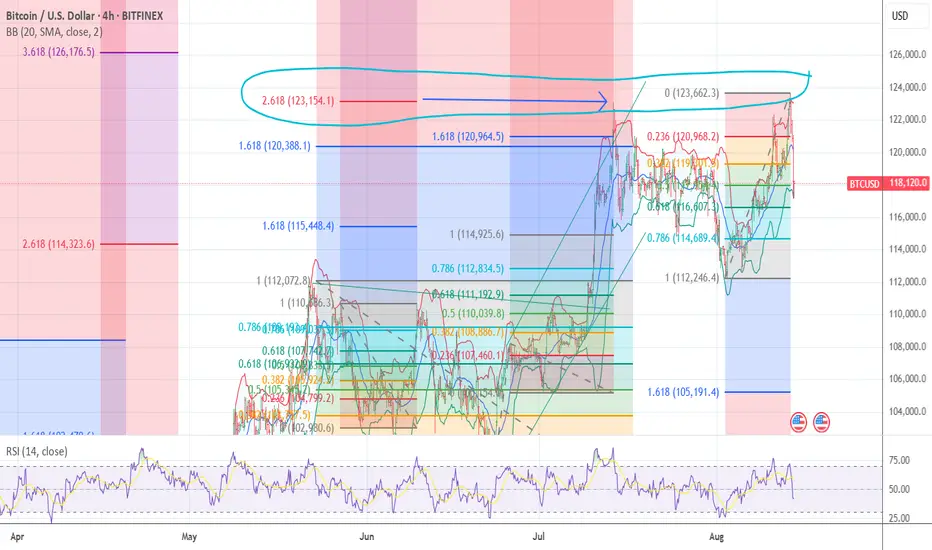
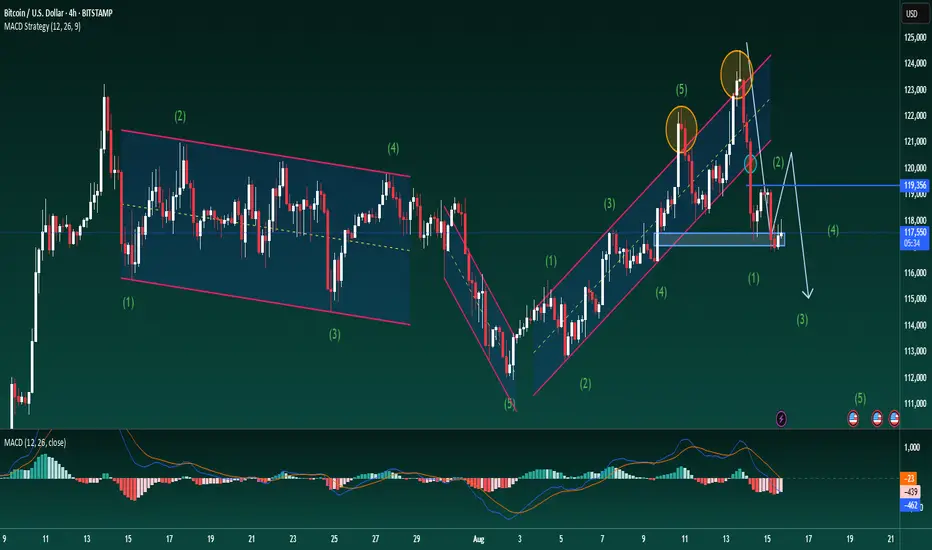
BTC/USD Update: A Bearish Divergence on the Horizon?BTC/USD Update: A Bearish Divergence on the Horizon?
Hello traders,
Let's dive into Bitcoin's recent price action. The price has shown a clear break from its previous upward channel, and it's currently attempting a retest of this broken trendline after finding support at a lower FVG (Fair Value Gap). This is a critical juncture that requires a careful analysis of the underlying market structure.
Key Technical Observations
Failed Breakouts & Channel Breakdown: Before the channel break, BTC made two attempts to push higher but failed to sustain the momentum. This suggests a weakening buying pressure. The subsequent breakdown from the upward channel confirms that the bulls are losing control.
Elliot Wave & Price Structure: The anticipated Elliot Wave ABC pattern didn't complete cleanly. This raises the possibility of a new corrective phase, potentially a 5-wave impulse move to the downside on the H4 timeframe.
MACD Signals: On the H4 chart, the MACD is also flashing a bearish signal. Despite the recent minor bounce, the moving averages on the MACD are starting to curl downwards, accompanied by a shift in volume. This supports the idea that the current rally is likely a temporary retest before a potential downtrend resumes.
My Trading Strategy
Based on this analysis, I'm setting up a two-sided trading plan:
Short Position: I will be prioritizing a short entry if the price retests the $121,000 area. This level represents a strong confluence of resistance (the broken trendline) and could be an ideal spot to initiate a short position.
Long Position: For a long setup, patience is key. I'll be waiting for a significant pullback to a lower support level, specifically below the $115,000 mark, before considering any long entries.
This is my personal analysis. Please remember to manage your risk carefully. Happy trading!

Bitcoin and 123,600 zone rejected again !!! FIB Math as to why !The chart posted of bitcoin I have posted a few times . Is setting up for That decline to 40/27 K Oct 10th 20 week But the first real drop should be into 85k /75 k into OCT Best of trades WAVETIMER