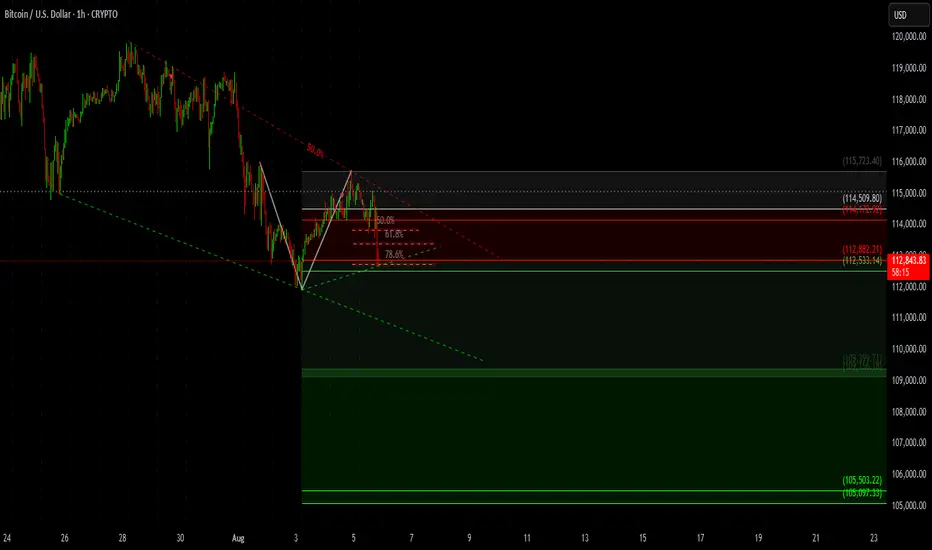
Bitcoin Analysis – 1H ChartBearish Pennant forming — price is consolidating within a descending triangle/pennant after a sharp drop, indicating a possible continuation.
🔺 Key Resistance Zones:
$114,509 – $114,742 (marked with dark red zone)
Fibonacci 50% – 61.8% levels aligning with this resistance zone
🔻 Support Zones:
$112,533 (current 78.6% fib retracement acting as intraday support)
$109,320 – $108,720 (potential bounce zone)
$105,503 – $105,097 (final bearish target if breakdown continues)
📐 Fibonacci Retracement Levels
Price retraced to 50%–61.8% and is now testing lower levels.
Breakdown from this region confirms bearish pressure.
📈 Bias: Bearish below $113,000
📉 Next Potential Target:
Short-term: $109,300
Medium-term: $105,000
💬 Conclusion: BTC is showing weakness after a failed breakout and rejection from fib resistance. If $112,500 breaks, expect acceleration toward $109K and possibly $105K.
BTCMINI trade ideas
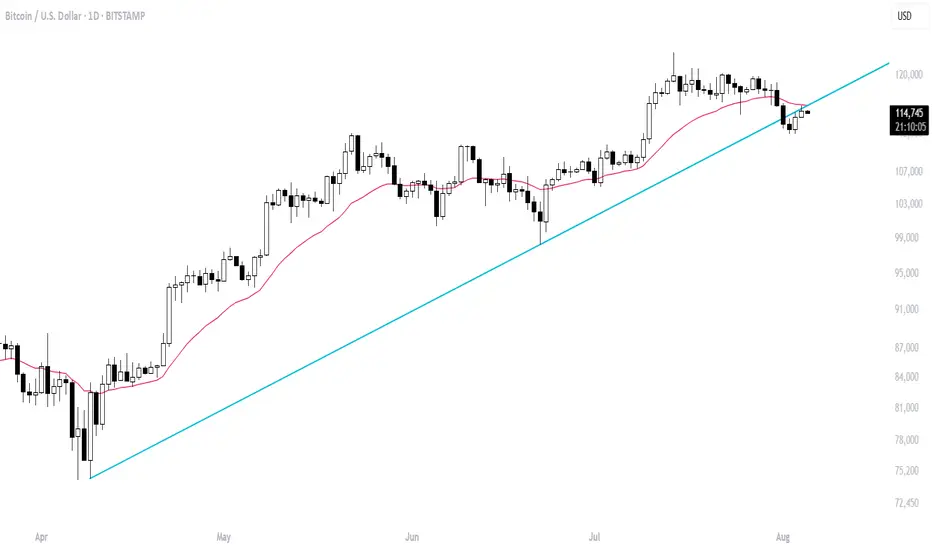
Bitcoin short-term correction over?#Bitcoin getting rejected at upward trendline (blue) as well as at 20DEMA (pink) isn't good news for bulls. For it to end its correction and resume the uptrend, BTC has to close above $115,800 on the daily chart, sooner than later.
Bitcoin next movement update If price closed above that level and sustain here after some positive priceaction from that level we can expect new buying from here...

BTC NEXT MOVE FOR INTRADAY 🟠 BTC/USD – Both Side Opportunity Ahead
Bitcoin is currently consolidating within a tight range, and price action is offering opportunities on both sides depending on confirmation. Let’s break it down:
🔹 Bullish Scenario
✅ If BTC breaks above 114,750, wait for a retest of this level.
🟢 Entry: On successful retest above 114,750
🎯 Potential Upside: Towards the 116,000 – 116,500 zone initially
🔒 Stop Loss: 113,900
🔹 Bearish Scenario
⚠️ BTC is approaching a strong Sell Zone between 116,510 – 117,140
🔴 This area aligns with previous supply + rejection points
📉 Possible Short Entry: Within 116,510 – 117,140, only if confirmation appears
🔒 Stop Loss: 117,500
📊 Key Notes
This is not an A+ setup, but structured for traders who adapt both sides.
Confirmation is absolutely important — don’t jump in without strong displacement and retest.
Always follow risk management and avoid over-leverage.
📌 Final Thought
BTC is showing mixed signals — the key will be how it reacts around 114,750 on the upside and 116,510 – 117,140 on the supply side. Traders should stay flexible and wait for confirmation before positioning.
👉 What’s your bias right now — Bullish above 114,750 or Bearish from 116,500+? Share your thoughts below!
⚠️ This is a market observation for educational purposes, not financial advice.

BTC-USD Price Analysis!This analysis, using MACD and EMAs, aims to predict the price of BTC in the near term as well as in the coming years.

Resistance Breakdown Expected in BTCUSD Bitcoin is currently testing a key resistance level around $114,976, which previously acted as a strong rejection zone. The price has shown a breakout attempt with minor consolidation just above the resistance, suggesting a possible shift in market structure.
📌 Chart Insight:
Price has broken above a well-tested resistance level.
Consolidation near the breakout zone could indicate accumulation before a continuation move.
Risk-to-reward setup is visible with clearly defined stop-loss and target levels.
📈 Trade Bias:
If BTC sustains above this resistance-turned-support zone, we could expect bullish momentum to follow. However, a failure to hold above may invalidate the breakout, leading to a possible pullback.
🕒 Timeframe: 15-Minute
⚠️ Always use proper risk management and monitor the price action near critical levels.

BTCUSD 1H Breakdown Alert!Bitcoin just broke below a triangle pattern after consolidating near the $114,800 resistance zone.
🔻 Key Levels:
Resistance: $114,795 & $115,004
Support Zones:
First: $113,878
Second: $113,249 → $113,179 (Strong demand zone)
⚠️ Price is now trading below the triangle support, showing bearish momentum. A retest of $114,456–$114,516 could act as rejection for further downside.
📌 Bias: Bearish unless BTC reclaims $114,800+
🎯 Next Targets:
$113,878 (mid support)
$113,250 → $113,180 (major liquidity zone)
🕒 Keep an eye on the next few candles for confirmation.
#BTC #Bitcoin #CryptoAnalysis #PriceAction #BTCUSD #CryptoBreakdown #BearishSetup

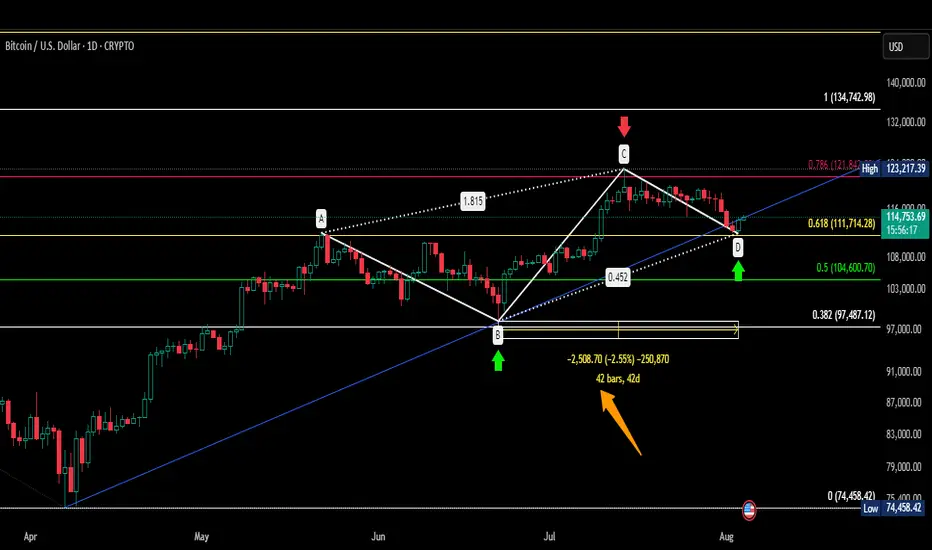
BTC TAKEN REVERSAL AS GANN TIMEAs per gann time rule BTC trying to reverse but there is not necessary that this reversal may sustain because time can vary.
1 sustainabily will depend on this low should not break for next 5 days as per my knowledge.
2. Here is a trend line in blue colur which may work as support.
3 If you see this chart there is a pattern ploted in which D is almost 50% of BC.
4 In this pattern A is previous swing high working as support .
5 You can see orrange arrow which is time taken to form this pattern.
remember this is not my buy/sell call.
Took a BTC buy & am holding it for the week.So I saw BTC reversing today & going up hill today. I saw a bullish engulfing on 1 Hour Chart & thought I should enter. Though I did entered a bit late, it's running smoothly.
Just sharing my view & trade for educational purposed.

BTC/USD (Bitcoin vs USD) – Daily Chart AnalysisBitcoin is testing the ascending trendline support that's been respected since April. After peaking near $125,000, the price is now pulling back toward this critical level. The structure is at a make-or-break moment.
Key Technicals:
EMA 20 (green): $116,003
DEMA 50 (red): $118,468
Current Price: ~$113,315
Support Level: Around the ascending trendline (~$113K zone)
Candle Structure: Red Heikin Ashi suggesting bearish momentum, but no strong breakdown yet
Potential Scenarios:
Bullish Case: A strong bounce here could maintain the uptrend and trigger a new leg toward $120K+.
Bearish Case: A confirmed daily close below the trendline could open the door for deeper retracements toward $108K or even $100K.
📊 Watch for rejection candles or bullish divergence at this level. A decisive break will likely dictate medium-term direction.

BTC BUY ZONE - INVESTMENT BTCUSD – Weekly Outlook | Ideal Investment Zone
📊 Pair: BTCUSD
⏰ Timeframe: 1W (Weekly)
---
🔍 Market Context
Bitcoin continues to trade at elevated levels after a strong bullish run. However, price is now consolidating near highs, and smart money is likely preparing for discounted entries rather than chasing tops.
---
🧩 Key Technicals (Smart Money Context – SMC)
Weekly Order Block + Fair Value Gap (FVG): Confluence zone between $89,000 – $80,000
Liquidity Grab: Recent rejection shows signs of engineered liquidity sweep before deeper retracement.
Trend Structure: Still bullish, but retracement is healthy for continuation.
---
📌 Ideal Buy Zone
Primary Accumulation Area: $89,000 – $80,000
This zone aligns with weekly OB + FVG, providing a high-probability area for long-term investment entries.
---
🎯 Potential Targets
TP1: $114,000 (recent highs)
TP2: $123,000 (next extension zone)
Long-term: If structure holds, BTC could aim toward $140,000+
---
⚠️ Risk Management
Invalidation Level: Weekly close below $70,700 (break of demand structure).
Always size positions wisely and use proper risk controls.
---
🔔 Final Thoughts
Smart Money does not chase highs — it accumulates at discount.
BTC between $89K–$80K is where institutional buyers are most likely preparing positions.
> 📌 This is an educational market outlook, not financial advice. Trade your own plan, manage risk.

BTC/USDThe BTC/USD trade with an entry price of 113,461, stop-loss at 113,735, and exit price at 112,913 is a short-term sell trade setup. In this scenario, the trader expects Bitcoin’s price to decline after entering at 113,461, targeting a profit at 112,913. The total potential profit is around 548 points, while the risk is about 274 points, giving a favorable risk-to-reward ratio of nearly 1:2.
The chosen entry price indicates that BTC may be at a resistance level or showing bearish confirmation signals, such as a rejection from a higher level, bearish candlestick patterns, or overbought conditions on indicators like RSI or MACD.
The stop-loss at 113,735 is placed above the entry to limit losses if the market reverses upward. This level is chosen just beyond the resistance zone to avoid being stopped out by minor fluctuations.
The exit price at 112,913 is the target level, likely based on a nearby support zone or a projected price move.
This trade setup reflects disciplined trading with defined risk and profit targets. By adhering to the plan and avoiding emotional decisions, the trader can manage risk effectively while seeking profits from short-term BTC/USD downward movements.

$BTC Weekly Bearish Divergence is Screaming!BTC has been moving up nicely on the weekly, no doubt. But right now, it’s literally sitting on a major trendline support. I mean, this is make-or-break territory. If we lose this level and drop below $109K, I’m telling you — it could flush straight down to $95K–$90K. That’s a clean gap zone, no real structure there.
And here’s what’s bugging me — RSI is throwing up a bearish divergence, and the Stochastic RSI is also screaming the same thing. Just waiting on that MACD crossover confirmation... if that happens and the trendline breaks, this thing might not even wait for a proper retest. Could dump hard.
I’m not buying the $150K narratives right now. Personally, I don’t see it going past $125K in this cycle unless something wild happens.
Keeping it real — this is the level I’m watching like a hawk. If we break, strap in.

BTC/USD 15-Min Chart AnalysisBitcoin is currently trading around $113,426, showing signs of a short-term pullback after rejecting resistance from a descending trendline.
🔻 Bearish Breakdown
Price broke below a symmetrical triangle and retested the breakdown zone.
Bears pushed the price under minor intraday support near $113,600–113,800, confirming short-term weakness.
🔄 Key Levels to Watch:
Resistance Zones:
🔼 $113,837 – $114,399 – Strong supply zone
🔼 $114,876 – Potential target if bulls reclaim momentum
Support Zones:
🔽 $113,391 – Immediate support
🔽 $113,080 – Deeper pullback support zone
📈 Bias:
Short-term bearish unless price reclaims the upper trendline and closes above $113,800 with volume.
📌 Trade Idea (Not financial advice):
If BTC fails to reclaim $113,600, further downside to $113,080 is likely. A bullish recovery above $113,800 may open room to test $114,400–114,800.

Bitcoin sell given near 118500 , now start buying on dip Bitcoin sell recommended near 118500 , maximum targets hit on downside, now start buying on dip near support , both side levels given on chart

BTC/USDTrading BTC/USD at an entry price of 113,414, with a stop-loss at 112,666 and an exit price at 114,900, is a well-defined trade setup designed to capture a bullish price movement while managing risk effectively. The trade aims to take advantage of potential upward momentum in Bitcoin, with a target profit of around 1,486 points and a risk of approximately 748 points. This results in a favorable risk-to-reward ratio of about 1:2, which is an essential element of disciplined trading.
The entry price at 113,414 is selected based on market analysis, possibly indicating a breakout above a short-term resistance or confirmation of a bullish trend. Traders often rely on technical indicators such as moving averages, RSI, MACD, or support-resistance levels to identify optimal entry points. Entering at this level suggests confidence that BTC/USD will continue moving upward toward the target.
The stop-loss at 112,666 is placed strategically below a key support area to limit losses if the market reverses. It acts as a protective mechanism, ensuring that unexpected volatility or bearish moves do not lead to significant capital loss. Setting a stop-loss is crucial, especially in cryptocurrency trading, where price swings can be sharp and sudden.
The exit price at 114,900 is a predefined take-profit level where the trader plans to close the trade to secure gains. This level may coincide with a resistance zone or a calculated price target based on technical patterns like Fibonacci extensions.
This trade setup reflects a disciplined approach by having clear entry, exit, and risk management. By following the plan strictly and avoiding emotional decisions, the trader increases the chances of achieving consistent profits while minimizing potential losses in the highly volatile BTC/USD market.

BTC is bullishPrice is coming to retest 109k-111k zone. It can bounce back from here to create new high. Check for structural shift before taking a long trade.

Bitcoin Price Prediction 2025–2030 | Future Bitcoin ForecastBitcoin Price Prediction 2025–2030 | Future Bitcoin Forecast & Trends
Key Takeaways
Current Status: Bitcoin trades around $115,300, consolidating after a July 2025 peak of $123,270. Institutional inflows and ETF adoption fuel optimism.
Market Performance: BTC gained 120.84% over the past year from Jan 1 2024, to Jan 1 2025, with 17/30 green days in July 2025, showing strong bullish sentiment despite short-term volatility.
Technical Analysis: Price action remains above key EMAs, with the SuperTrend indicator signalling a buy. A potential breakout above $120,000 could target $125,000, with an immediate resistance at $123,200
Price Prediction July 2025: BTC reached $120,000–$122,000, with pullbacks to $117,000, aligning with short-term consolidation forecasts.
Future Outlook: Rising institutional adoption and halving effects could push BTC to $150,000–$170,000 by late 2025, with long-term targets of $270,000 by 2030.
Where Will Bitcoin Price Head Next?
Bitcoin’s price action in August 2025 reflects a market balancing greed and caution. Trading near $115,300, BTC is consolidating within a falling wedge bullish pattern on the daily timeframe, supported by strong institutional buying and ETF inflows. The Fear & Greed Index is around 72, signalling greed, while 57% green days in July highlight sustained bullishness. However, macro risks like geopolitical tensions or policy shifts could trigger corrections. Let’s dive into the technicals to gauge BTC’s next move.
Technical Analysis
EMA Alignment: BTC trades above the 20-day ($118,145), 50-day ($112,990), 100-day ($107,713), and 200-day EMAs, confirming bullish momentum. The 50-day EMA rising below the price supports potential upside.
SuperTrend Indicator: The SuperTrend remains in buy mode, with support near $117,000. This suggests continuation if BTC holds this level.
Consolidation Pattern: Price action forms a minor descending channel on the daily chart, with resistance at $120,000. A breakout could target $125,000.
Volume Trends: On-balance volume (OBV) is rising, confirming volume-backed bullish moves. However, RSI at 59–62 hints at mild exhaustion, warranting caution.
Bitcoin Price Prediction Daily
BTC is likely to trade between $119,300 and $114,000 over the next 24–48 hours. A hold above $117,000 could push toward $120,000–$122,000, while a break below risks a dip to $113,000, near the 50-day EMA.
Bitcoin Price Prediction Weekly
This week, BTC may test resistance at $120,899. A breakout could eye $125,000, but failure to clear this level might lead to a pullback to $114,800, a key support.
Bitcoin Price Prediction (July 2025)
July saw BTC peak at $123,236, with prices ranging from $117,000 to $122,000. Consolidation between $117,000 and $120,000 occurred, driven by profit-taking after a strong rally.
Bitcoin Price Prediction (August 2025)
August could see BTC challenge $125,000–$127,000 if it breaks $120,000. Support at $117,000–$118,500 remains critical. A deeper correction to $113,000 is possible if macro pressures intensify.
Future Outlook
Bitcoin’s trajectory remains bullish, driven by institutional adoption and its fixed supply. Spot Bitcoin ETFs are projected to hold 7% of the circulating supply by late 2025, with assets under management reaching $190 billion. The April 2024 halving, reducing block rewards to 3.125 BTC, continues to tighten supply, historically correlating with price surges.
Recent news, including MicroStrategy’s ongoing BTC accumulation and Standard Chartered’s $200,000 target for 2025, underscores optimism. However, risks persist. Geopolitical events, like the Israel-Palestine conflict spiking social volume in 2024, or regulatory shifts like Trump’s Tariff Announcements, could induce volatility.
A drop below $116,000 might trigger a correction to $110,000–$100,000, aligning with the 100-day EMA. In the long run, many crypto analysts expect Bitcoin to reach around $710,000 by 2030, seeing it as a form of digital gold. Cathie Wood’s optimistic prediction goes as high as $1.5 million.
By 2027–2030, increasing adoption in emerging markets as a hedge against inflation could drive demand. If BTC holds above $100,000, technicals suggest a path to $600,000 by decade’s end. Investors should monitor ETF inflows, whale accumulation, and macro trends while managing risk, as crypto markets remain volatile.
Disclaimer: Price predictions are speculative. Conduct your own research before investing.

Bitcoin bottoming out starts !?!At 115,008, this is why I believe the process of bottoming out of #bitcoin has started.
It's the confluence of trendlines (blue) and 50 DEMA (pink) at the 113,000-114,000 area. Any volatile spike down to the 109,000 level is a good area to accumulate, if it may happen.
Any weekly close below 109,000 is a problem for bullish traders!

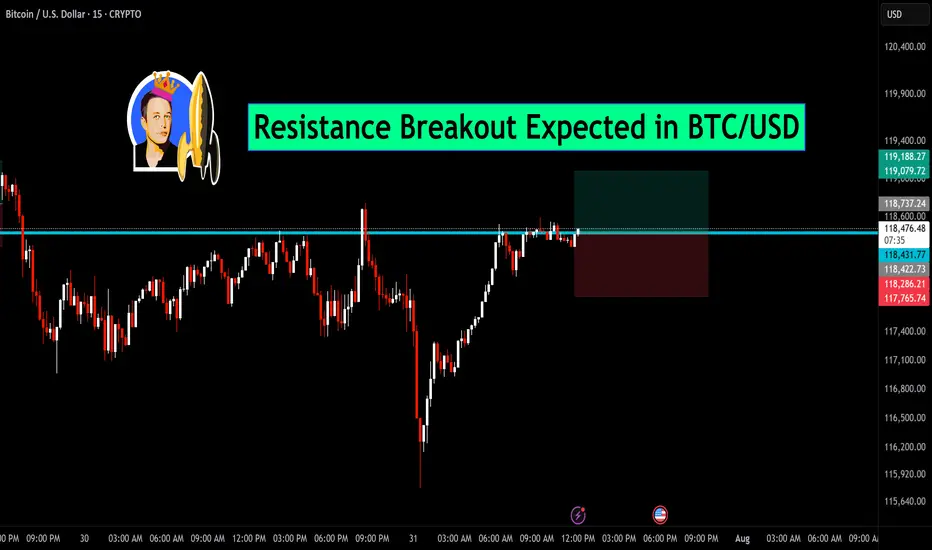
Resistance Breakout Expected in BTC/USDBitcoin is currently testing a key horizontal resistance near the $118,600 zone. After a sharp recovery from recent lows, the price is consolidating just below this level, indicating a potential breakout.
🔍 Chart Insights:
Price action forming higher lows, showing strength.
Breakout above the marked resistance may trigger a strong bullish move.
Tight consolidation near resistance suggests bulls are preparing for a push higher.
📈 Trade Setup:
Entry: Above $118,600 breakout
Target: $119,188 and beyond
Stop-loss: Below $118,200
If price sustains above resistance with volume confirmation, BTC/USD could witness fresh momentum on the upside. Stay alert for the breakout candle.
Trendline Support Retest in BTCUSDBTCUSD is currently retesting a crucial trendline support after a sharp pullback. Price broke above resistance earlier and has now returned to retest the breakout zone — a classic setup where buyers may step back in. ✅
📉 After a strong downtrend, we saw a bullish reversal pattern forming, followed by a clean breakout. This retest can act as a potential entry point for a long setup, provided the support holds.
📌 Key Levels:
Support Zone: ~$115,250 – $115,280
Resistance Zone: ~$116,180 – $118,200
Risk-Reward looks balanced with a well-placed SL below the retest candle.
🛡️ Watch for bullish confirmation (like a strong bullish engulfing or volume spike) before entering!
📅 Timeframe: 15-Minute Chart

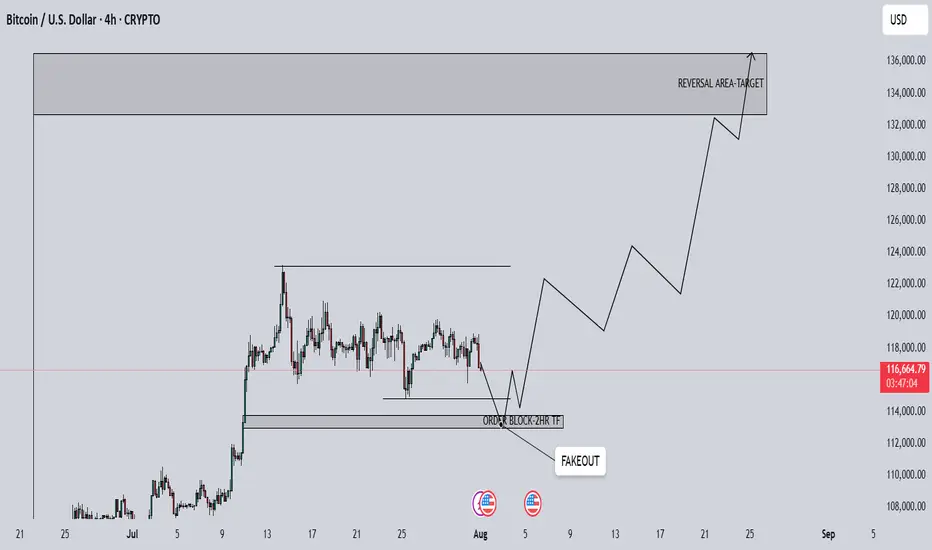
BTCUSD 4H Analysis1. Overall BTC is bullish but currently its at central area of
demand. so we can see a consolidation here.
2. There is a inducement/wicks at downside, so we can expect
a fake out at downside to fill the inducement and then market
can go to target area.
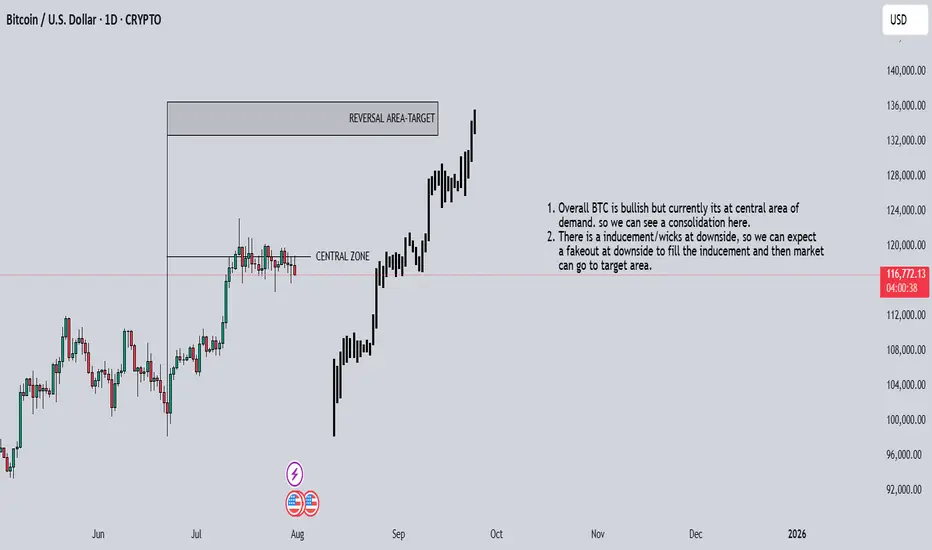
BTCUSD 1D Analysis1. Overall BTC is bullish but currently its at central area of
demand. so we can see a consolidation here.
2. There is a inducement/wicks at downside, so we can expect
a fake out at downside to fill the inducement and then market
can go to target area.