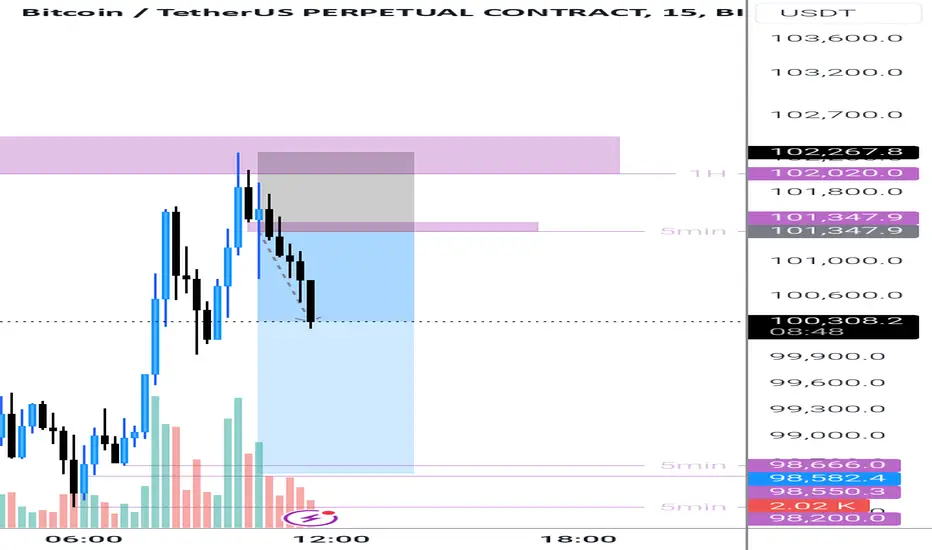
BTCUSDTBTC is in consolidation, so only small moves can be expected for a while. i think it will take the equal highs above and also 15 min liquidity. as it did not respect the 1h FVG, so the price may drop.
BTCUPUSDT trade ideas

Buy trend withBitcoin pullback complete so continue change trend is buy si now buy it.
you can follow me 1 month then result showk.

BTC#11: Will BTC rise or fall?. Market structure perspective
💎 💎 💎 Did you make a profit in post #10? Please share and comment your thoughts 💎 💎 💎
🔥After the Monday morning dump, we witnessed an amazing recovery of BINANCE:BTCUSD . Market sentiment has improved significantly. We continue to plan for BINANCE:BTCUSDT as follows:🔥
1️⃣ **Fundamental analysis:**
📊Data: Stablecoin on-chain trading volume decreased by 10.5% in January and legal CEX spot trading volume decreased by 18.2%
🔴According to Bybit CEO Ben Zhou, the total value of actual crypto liquidations is higher than $2 billion, he estimates this figure at around $8-10 billion.
🚀Donald Trump signed an executive order to establish a US national investment fund.
📌 In general, market liquidity is falling sharply, the loss after the recent correction has brought a cautious mentality to the majority of investors in the cryptocurrency market.
2️⃣ **Technical analysis:**
🔹 **D Frame**: Yesterday's D candle marked the amazing recovery of BTC. Currently, the price structure of frame D is still maintained as an increasing price structure.
🔹 **H4 Frame**: Gives us a different perspective. Although BTC has recovered, the price structure of frame H4 has not been broken. We will have to wait a while before seeing a more positive signal
🔹 **H1 Frame**: As you can see, BTC is still running in the downtrend channel. The KEY 977xx zone will play an important role in predicting the next direction
3️⃣ **Trading plan:**
⛔At the present time. Although the D candle is a positive sign, in the smaller time frame we still do not have a price structure confirming the recovery of the main trend. Whether placing a BUY or SELL order in this area is very dangerous because there is no confirmed price structure. You should wait to get the best trading position
✅ Based on my personal experience, I will wait for the price reaction in this 97K area. If a supportive price structure appears, we can have a good position following the main trend in the D frame.
💪 **Wish you successful trading!**
📌 For any questions, please contact us directly. I am ready to answer you for free

Take Profit on BTC at $59,900 - $60,000🚀 Take Profit on BTC at $59,900 - $60,000
📢 This is the ideal time to take profit on BTC positions bought at $59,900 or lower, following the W cycle.
📌 Profit-Taking & Capital Reallocation Strategy
✔ Take profit on BTC at $59,900 - $60,000, as BTC is showing signs of entering a correction phase under the W cycle.
✔ Convert BTC to USDT and wait for accumulation over the next few weeks or months.
✔ Re-entry zones:
$77,000 - $82,000 → Ideal areas to buy back and position for the next W cycle rally.
📊 Strategy for Long-Term Investors (M & 3M Cycles)
✔ For those following larger cycles (M or 3M), no immediate action is required.
✔ Instead, monitor ideal correction zones to accumulate more BTC positions.
✔ Maintain long-term holdings while observing market conditions before further actions.
🔥 BTC is entering a correction phase – Manage your capital wisely! 🚀

Is BTC not able to break new ATH and No Alt Season SADIf BTC not able to break New ATH with good volume and No Alt Season. Then this Scenario will be happen. I hope I am wrong. This Bull season has too pain
A wise person will stop CRYPTO Soon after the oath of the so good person Mr Trump...crypto has gone out of control. Stay away from CRYPTO. Not only every person,every institution but even every country. Stay away. It is a scam. Save ur money. Listen to me. These bastards playing unfairly will be taken down someday,but till then stay away and use ur money for u

Bitcoin will fall back to $83,000 soon!Bitcoin has brocken out from the symmetrical triangle and took retest successfully and now moving down slowly. Hopefully we can see more dump on bitcoin and other alt coins soon 😊

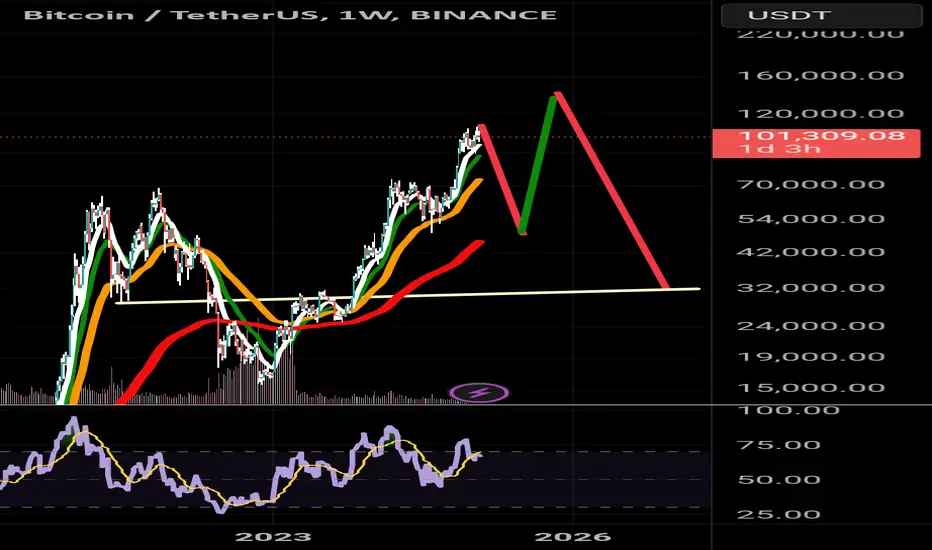
DOUBLE TOP 2025?My absolute bullish FIB fractal target ~ 222K
HOWEVER! Last cycle, the bull run from the bear low lasted 123 weeks. We are already 116 weeks from the most recent bear low. We have six more weeks until BTC made a local top last cycle from the bear low, and we are currently printing a bearish weekly divergence. I copy pastad the remaining candles from the last cycle, and I adjusted the scale to generally assume BTC will continue to face resistance around 110K, price will retrace more than 50% down to the order block, and the double top will happen 29 weeks after the first top like last time.
According to this charting, we will see a local upthrust to 120K mid March. I am assuming prices will retrace to around 58K, which would be such a gift. Sow some seeds in spring for fall harvest, I guess? Although it sounds bearish, we may see a local top of 128K. beginning the bear market the end of September 2025. Again assuming everything, BTC will bottom at around 36K, scaring MSTR investors for sure, early September 2026.
Alright. Enough of this analysis paralysis.


BTC - Book Profits to re enter at lower priceThe much-awaited action from new president is getting delayed and it has caused bitcoin price to get rejected at previous high or not willing to spike up further. The much-wished banana spike does still not come. when we draw lines and see price is about to see small correction now. Its not safe to take fresh shorts but its good and safe to book profits now for sure. It will help to re enter at lower price below 98 or 92 K if it comes and any small lower levels compared to price at 107 or 106 K now. Take your own decision and any news from president office will move the price swiftly on either side. If you do not wish to take risk of losing your positions may hold on for days and do not mind missing the volatility opportunities.

BITCOIN 3 rd wave in progress.this weekly chart of BITCOIN has tried to capture its wave progression .
1st wave of of ungoing 3 rd wave is in progress.
2 nd wave in this main chart has retraced 50 percent of 1 st wave. in november 2022.
Now 5 th wave of 3 rd wave is in progree.
normally it should terminate at 127000.
This is not any trading recommendation.
It is my study only.
But bullishness of Botcoin is obvious.
If this study helps you like this post.
follow me to get updates.

Bitcoin goes down 21.01.2025Buy (Long) Trade Scenario
Trigger Conditions:
Price drops to the Demand H4 zone (92,000 - 96,000 USDT).
A bullish reversal signal appears (e.g., bullish engulfing, pin bar, or strong bounce from the zone).
Entry Point: Around 93,000 - 94,000 USDT.
Stop Loss (SL):
Below the Demand H4 zone at 88,000 USDT (risk ~6,000 USDT).
Take Profit (TP):
Target 1: 98,000 - 100,000 USDT (nearest support zone).
Target 2: 106,000 - 108,000 USDT (Supply H4 zone).
Risk-to-Reward Ratio (R:R):
If entering at 94,000 USDT, with SL at 88,000 USDT, and TP at 106,000 USDT:
Risk: 6,000 USDT
Potential Reward: 12,000 USDT
R:R = 1:2
2. Sell (Short) Trade Scenario
Trigger Conditions:
Price retests the Supply H4 zone (106,000 - 108,000 USDT).
A bearish reversal signal appears (e.g., bearish engulfing, shooting star, or heavy selling pressure).
Entry Point: Around 106,000 - 107,000 USDT.
Stop Loss (SL):
Above the Supply H4 zone at 110,000 USDT (risk ~3,500 USDT).
Take Profit (TP):
Target 1: 100,000 USDT (nearest support zone).
Target 2: 93,000 - 94,000 USDT (Demand H4 zone).
Risk-to-Reward Ratio (R:R):
If entering at 107,000 USDT, with SL at 110,000 USDT, and TP at 94,000 USDT:
Risk: 3,000 USDT
Potential Reward: 13,000 USDT
R:R = 1:4
3. Risk Management
With the adjusted stop-loss levels:
Keep risk per trade at 2-3% of total capital.
If total capital is 10,000 USDT:
Maximum risk per trade = 300 USDT.
Adjust position size to match this risk level.
Final Notes
The wider stop-loss levels at 88,000 USDT (for Buy) and 110,000 USDT (for Sell) mean a larger distance to risk. Adjust the position size accordingly to maintain safe risk levels.
Monitor price action closely in key zones before entering trades.
Follow me. Good luck!

New high created, coming up next ?BTC is expected to pump from $116K to $128K soon.
Beginner Awareness: Always verify every cryptocurrency before buying. Proper analysis and verification are crucial.
Pump coins like Trump, Elon, Satoshi, and Melania are meme coins. (Use Dexscreener for coin tracking across multiple blockchains, especially for beginners. And legendary knows everything)
#Meme
#Solana
#BTC
#All
Support is visible in 2025 with the current low, long-wick candles. Always verify market cap, supply, and volume before investing.
This post is a bit late, as I forgot to share it earlier, but everyone is posting now.
Use ChatGPT to learn about cryptography and explore different income opportunities in the crypto space.
Good luck to older and new holders. Watch out for 🎯 in the next post!

BTC#4: Things to watch out for when BITCOIN breaks the top💎 💎 💎 Plan BTC3# helps you make a profit. Leave a comment and tag your friends to share. 💎 💎 💎
1️⃣ **Fundamental analysis:**
📊 Trump plans to make cryptocurrency a "policy priority" and consider suspending related lawsuits and establishing a national reserve fund.
🚀 The Fed's dovish stance combined with Trump's pro-crypto stance creates the foundation for the market to grow.
📌 Liquidation of positions has exceeded $90 million, most of which are sell orders. This also contributes to pushing BTC prices higher.
2️⃣ **Technical analysis:**
🔹 **D frame**: As you can see, after scanning the 89xxx~90xxx area and closing with a pinbar, the price line has been increasing continuously until now.
🔹 **H4 frame**: The resistance zone of 102xxx has been broken and acted as support to push the price above the old peak. The price structure has been confirmed in the H4 frame that the old peak has been broken by a candle closing through the 106k~108k area
🔹 **H1 frame**: You can see the price line testing the trend line and increasing according to the textbook theory. You can see that I drew the support zone in #3 just now. Currently, the price has broken through the old trendline, but the price is still reacting at the old peak area.
3️⃣ **Trading plan:**
⛔ As I have provided you, the number of liquidated sell orders is very large. So we should not go against the trend to catch falling knives at this time.
✅ Currently, in my personal opinion. Market information is very excited with TRUMP's moves in the past time. This will attract many new investors and push BTC prices to continue to increase in the near future. However, today I will not give a trading plan because we do not know how high BTC prices can increase. Establishing a position at resistance brings high risks because R:R is no longer reasonable. 🚀 Give yourself a period of time to observe the price line and listen to information to make long-term decisions.
💪 **Wish you successful trading!**

Try Shorting BTC with small SLI believe it will drop after triggering the stop-losses of the last short positions, potentially turning into a significant trade. I’ve tried this approach before, and it responded well on the sell side, although the results weren't as expected. Let’s give it another shot this time, as the probability seems higher now.

Bitcoin Technical - Jan-2025While Bitcoin has hit a new high, the technical indicators suggest that a short-term correction might be imminent, which could be seen as an opportunity for buying at lower levels before the next rally. However, market sentiment and external factors could always sway these technical readings, so traders should remain vigilant.

BTCUSD LONGWe are following up with the order flow, nice demand zone with $$$ above taking price back to ATH.

Bitcoin (BTC): technical and fundamental analysis. Altseason. The price of Bitcoin has declined following the release of labor market data (JOLTS) and the FOMC meeting minutes, where Fed officials expressed concerns about the impact of Donald Trump's policies on the U.S. economy. BTC's price has once again fallen below the 200 EMA line and is currently retesting the support block at 90,000–91,000, which it has repeatedly bounced off over the past month. If Bitcoin breaks below this level under selling pressure, we anticipate a continued correction into the 4H Imbalance zone, located between the 0.5 and 0.61 Fibonacci levels. In this area, reversal patterns can be sought for building short-term long positions in the 87,000–82,000 range. The likelihood of further decline is indicated by the crossing of the EMA 200 and EMA 50 moving average lines. At the same time, the RSI indicator is already near its lower limits, offering hope for a quick end to the correction if the support levels of 87,000 and 80,000 hold against the sellers' pressure.
For Bitcoin to resume its upward trend, it needs to break above the dynamic resistance of the 200 EMA and hold above the psychological level of 100,000. In that case, we would expect further growth with a retest of the resistance block at 108,000–110,000 and a potential update of the all-time high.
📉 Bitcoin market global analysis. When does the altseason start?
On the daily logarithmic chart, the RSI indicator has crossed below the midline, suggesting a continued correction is likely. During Bitcoin’s rapid growth in November 2024, an Imbalance 1D zone formed in the 77,000–85,000 range, characterized by significant gaps at horizontal trading volume levels that need to be filled through consolidations.
After the correction is complete, the next target for Bitcoin's price growth could be the global trendline, drawn based on the two peaks of the previous growth cycle. This line may be tested around the 120,000 level, as confirmed by the analysis of large order blocks in exchange order books.
Meanwhile, the crypto market is gearing up for the much-anticipated altseason—a period when altcoins outperform Bitcoin in returns. Altseason typically follows Bitcoin's new all-time high and its consolidation within that range, as investors reinvest profits into other coins to maximize gains. However, the upcoming altseason will likely differ from previous ones due to the influx of institutional funds via Bitcoin and Ethereum ETFs and the tightening regulation of crypto assets.
Historically, in 2017 and 2021, the start of altseason coincided with a decline in Bitcoin's market dominance. A drop in Bitcoin's share of total market capitalization below 50% could signal the beginning of altseason. Additionally, altseason often aligns with moments when Bitcoin reaches the upper boundary of the Bollinger Bands on the weekly chart.
💠 Analysis of liquidity zones and levels
The Fear and Greed Index remains in the Greed Zone - 69.
The total cryptocurrency market capitalization has fallen to $3.19 billion, while the Bitcoin Dominance Index has risen to 57.94.
According to the analysis of the accumulation of large order blocks in the order books, the supply and demand zones are located at the following levels:
🟢 Demand Zone: 80,000 - 91,000
🔴 Supply Zone: 105,000 - 120,000
Levels for long positions:
90,000 - psychological support level
87,000 - 88,000 - large support block
80,000 - large support block
Levels for short positions:
105,000 - largest resistance block
110,000 - largest resistance block
120,000 - ascending trend line of resistance
📊 Fundamental analysis
At the December meeting, the Federal Open Market Committee (FOMC) discussed various topics, ranging from inflation risks to the anticipated slowdown in rate cuts. Fed officials expressed concerns that Trump’s proposed trade and immigration policies could intensify inflationary pressures. Meanwhile, fresh U.S. labor market data may push the Fed to abandon further rate reductions. The cryptocurrency market reacted sharply, with significant price declines.
At the same time, financial analysts predict that the current bull market could become the longest in the history of the cryptocurrency industry. Investor optimism regarding a continued crypto rally surged after Bitcoin reclaimed levels above $100,000, following news that the largest BTC investor among public companies, MicroStrategy, resumed its coin purchases. The company acquired 1,070 Bitcoins for $101 million, bringing its total holdings to 447,470 BTC.
Experts believe the cryptocurrency market’s peak will occur in mid-2025, followed by a steep decline. Net liquidity of $57 billion, expected to flow into the market in the first quarter, may temporarily support the bull market. However, economic pressures are likely to trigger a correction. These projections are based on an analysis of market liquidity and the impact of political events, as U.S. dollar liquidity remains a critical factor in crypto market dynamics. Changes in Fed policy and U.S. Treasury operations could lead to significant volatility.
🌐 Upcoming Events in the Global Economy
We expect increased volatility in both stock and cryptocurrency markets on the following dates:
➤ 01/15, 16:30 - U.S. Core Consumer Price Index (CPI).
➤ 01/16, 16:30 - U.S. Initial Jobless Claims.
➤ 01/29, 22:00 - New Fed Interest Rate Decision.
➤ 03/19, 22:00 - New Fed Interest Rate Decision.
📈 Statistics of signals from our AI trading indicator:
In December 2024, the price of Bitcoin updated its historical maximum, then a correction began. Our trading indicator, as always, warned about this in advance! And even during the flat period it gave good entry points. Thanks to the latest updates, all signals have become profitable, and built-in Anti-Flat System prevented losses from manipulative market movements. 😎
Total price movement by all signals: + 45.09%
Maximum price movement: + 11.17%
Average price movement: + 5.01%
In addition, I would like to share the forecast of the latest Bitcoin price action by our AI, which not only indicates the direction, but also builds the trajectory of further price movement:

Bitcoin trend join trade..There is 30 min demand from we will look for buying after individual confirmation ofcourse..

Technical analysis of #Bitcoin (BTC)👉 Today's analysis of #Bitcoin (BTC) involves considering both short-term and long-term market trends, technical indicators, and sentiment from various sources. Here's a comprehensive 📉📈 chart for your reference 💰🤑

Expecting some up move 1h important area and 4hr 2 downclose candles (act like OB) then got the 5min MSS(Market structure shift)

BTC#2 : Summary of things to watch out for in the current uptren🔥 The previous plan helped you make a profit. Leave a comment and share the joy. 🔥
Today I will continue to bring everyone a perspective on BTC and the next trading plan.
1️⃣ **Fundamental analysis:**
📊 🔴US CPI rose slightly more than expected in December as energy costs rose, suggesting inflation is still rising
▫️ In addition, a recovery in Bitcoin was supported by the release of December PPI on Tuesday, which showed weaker-than-expected inflation data.
2️⃣ **Technical analysis:**
🔹 **D Frame**: Yesterday's candle close shows strong market confidence in BTC rising. However, the price has reacted when touching the trendline. This is the area we need to pay attention to
🔹 **H4 frame**: The bearish price structure was broken when the price crossed 968xx and went straight to the trendline, which caused the bullish momentum to slow down somewhat. It is likely that we will need a slight correction to gain momentum to break the resistance area above
🔹 **H1 frame**: Looking at the price structure, you can see more clearly. The bullish wave has not shown any signs of ending, but the important resistance area requires us to be more patient if we want to find profits.
3️⃣ **Trading plan:**
✅ If you want to have a BUY position at the moment, my advice is that we can patiently wait for the price to test the support area of 958xx as I marked on the chart. Don't be hasty, when the R:R ratio of the important resistance area is always low. The bullish price structure also needs confirmation by a higher bottom than the previous bottom. FOMO at this time is not a wise choice
⛔ The resistance zone will always make you want to stop the ship. However, wait for the bearish price structure in the small time frame M5. M15 to make sure your judgment is correct. If you have a good position, you should not expect high profits when the bearish price structure is temporarily broken, closing part of the profit when the price touches support and leaving SL positive will be a wise choice.
💪 **Wish you successful trading!** 🚀
