Perfect BITCOIN Trade Doesn't Exist?🚀🚀 Perks of being a BULL & a BEAR at the same time!
Capturing moves on both sides of the market flawlessly!
BTCUPUSDT trade ideas

SHORT BTCPattern Observed: Head and Shoulders
Left Shoulder: Formed with lower highs.
Head: The peak point of the pattern.
Right Shoulder: Slightly lower high, confirming the pattern.
Neckline: A horizontal support line at approximately 96,000 USD.
RSI Divergence
RSI shows a downward trend while price action forms higher highs during the head. This bearish divergence indicates potential weakness and supports the Head and Shoulders reversal.

BTC is gaining momentum to rise.
Judging from the recent decline of BTC from the high of $108,318 to the low of $92,458, the price tested multiple Fibonacci levels during the rebound. Among them, the 0.5 level ($100,388.32) has become a key support level at present, while the 0.618 level ($102,259.76) as an important resistance level limits further rise in the short term. The current price is hovering around $100,344, indicating that the market is looking for a directional breakthrough.
Previously, the BTC price ran along the descending channel, reaching a minimum of $92,542.93 before gradually stabilizing and breaking through the upper edge of the channel. At present, the price has entered a sideways consolidation range ($98,000-$101,000) and is trying to form an upward trend on this basis. If it can break through the upper edge of the consolidation range and stand firm, BTC may challenge the target of $105,000 or even higher.
The chart shows that the price may experience a small correction in the short term, but the overall upward trend is more likely, especially after breaking through the key resistance of $102,259, the upward space will be further opened. The support area below is concentrated around $99,560 and $97,735. If the price falls back to this area and stabilizes, it will be a good opportunity to buy at a low point.
Investors need to pay close attention to market dynamics and breakthroughs in key technical levels, while reasonably controlling risks and formulating clear stop-loss strategies. BTC's current consolidation pattern indicates that there may be large fluctuations in the short term.

The CLEANEST BTC analysis you'll ever see!All Time High - $108,325
Resistance Becomes Support - $100,000
Strong Support - $93,000
It's Now or Never guys!
Bitcoin to the mooooon! 🚀

BTC | GOLD | PRICE ACTION ANALYSIS | 06 JAN | HINDIThanks for watching the video follow me for more videos.
I do analysis on GOLD and BTC.

Bitcoin Is Rebounding After Smashing BottomConsidering that the buying volume has not exploded significantly, if there is an adjustment after a rebound that does not exceed the high point, then a rebound that can exceed the high point should be considered.


Bitcoin (BTC/USD) goes to 102k. Scenario 1: Long (Buy) Setup
The idea is to wait for a pullback to the FVG H4 zone or Trendline H1 for a buying opportunity.
Entry Point (Long):
🔹 Entry 1: Around FVG H4 ($96,500 - $97,500).
🔹 Entry 2: If the price breaks below the FVG, consider entering around the Demand Zone ($92,500 - $93,000).
Stop Loss (SL):
🛑 Set your Stop Loss at $95,700
Take Profit (TP):
🎯 TP1: Around $100,500 - $101,000 (Supply H1).
🎯 TP2: Around $102,000 - $105,000 (Supply Zone).
📉 Scenario 2: Short (Sell) Setup
If the price reaches the Supply Zone, it offers a potential shorting opportunity to catch a reversal.
Entry Point (Short):
🔹 Supply Zone 1: $101,000 - $102,000.
🔹 Supply Zone 2: $103,000 - $105,000 (a stronger resistance level).
Stop Loss (SL):
🛑 Set your Stop Loss above $106,000.
Take Profit (TP):
🎯 TP1: Around $98,000.
🎯 TP2: Around $95,000.
🎯 TP3: Around $92,000 (Demand Zone).

update btcusdt hello.
This post is basically a personal reminder but, I am glad if you read it.
I keep the same position on btc. Who's renter at 91k good idea, you won't lose that much on the next drawdown. I won't suggest an exit and rentrance.
I am still waiting for 87-85K range (86K snaper).
The 0.618 weekly bearish ends around 101-102k which coincides with the 0.27 buy on several tf.
The 0.27 of this sell on weekly basis ends where the reintracement of the main bullish trends is supose to arrives, this so-oftern recalled, 86k.
I expect a bullishn rally from 86K but there are still ineffenciy left behind. For the nowadays political and governamental situation, i think a price of 78-71K is too low, unless BTC burning.

Bitcoin 2H SMC Chart Analysis: Bearish Outlook Bitcoin 2H Chart Analysis: Bearish Outlook
Currently, Bitcoin is forming a Lower Low (LL) and Lower High (LH) pattern, signaling a potential bearish trend in the short-term. Key support levels to watch are around $88,000 and $85,000.
📉 Next Targets: $88,000 → $85,000
🚫 Critical Level: A 2H close above $101,000 would invalidate this bearish outlook.
Note: If Bitcoin holds below $100,000, expect a possible decline to $85,000.
Remember, always set your stop losses to protect your funds in case the trend shifts.

BTC wide range
BTC is currently in a high-level wide range oscillation stage. After the price rose and fell in the previous period, it continued to weaken in the downward channel until it rebounded and rebounded at the 92000 line. The resistance of the 100000 line above continued to suppress, and the price formed a horizontal wide range after experiencing multiple ups and downs. At present, the price has rebounded at the 92000 line and gradually raised the low point, testing the resistance level of the 100000 line again. If this resistance is broken, BTC may re-enter the upward trend. The 96000 line below is a short-term support. Once it falls below this position, the price may return to the bottom of the range, and the short-term market will be bearish.
At the short-term level, BTC has entered the stagflation adjustment stage after multiple rises, forming a technical pattern of double top weakening. In the short term, the 97000 line is a key support. If it falls below this position, the rebound trend may end and the price will continue to be horizontal.
Suggestions for short position operation:
Aggressive operation: When the BTC price is close to 98,000, short positions can be arranged. The target downward support levels are 96,200, 95,400, and 94,000, and the stop loss is set at 100,000.
Steady operation: It is recommended to wait for BTC to form an M head and break the support, and enter the market after confirming that the short-term trend turns to short. You can pay attention to the short position opportunities in the 97,200-96,800 area.
Overall, the current short-term trend of BTC is still in a volatile consolidation pattern, and breaking through key resistance or support will determine the short-term direction.

Bitcoin chart updateBitcoin now at resistance level
If level break we can see good move at upside
Otherwise again going down

BTC tradeBTC trade now turned out positive. Lets see if we can get the target or not.
Comment your view , if you want in depth anlysis type " Swing Trade"
Happy Trading

BTC (Bitcoin) Up trend - 2.1.2025Trading Scenario: Long (Buy)
Entry Point:
Zone: Near the Demand Zone between $94,500 and $95,000.
Confirmation: Wait for a bullish candlestick pattern (e.g., bullish engulfing, pin bar, or strong upward momentum) on the H1 timeframe to confirm a bounce from the Demand Zone.
Stop Loss (SL):
Set below the Demand Zone at $92,300 to avoid fake breakouts.
Take Profit (TP):
Target 1 (TP1): FVG H4 zone between $97,700 and $98,500 (partial profit).
Target 2 (TP2): Supply Zone between $99,500 and $100,400 (close the rest of the position).
Risk-Reward Ratio (R:R):
With an entry at $95,000, SL at $92,300, and TP1 at $98,000:
R:R = (98,000 - 95,000) / (95,000 - 92,300) ≈ 1.85.
With TP2 at $100,000:
R:R = (100,000 - 95,000) / (95,000 - 92,300) ≈ 2.84.
Trading Scenario: Short (Sell)
Entry Point:
Zone: Near the FVG H4 or Supply Zone between $98,500 and $100,000.
Confirmation: Wait for a bearish candlestick pattern (e.g., bearish engulfing, pin bar, or overbought signal on RSI).
Stop Loss (SL):
Set above the Supply Zone at $100,600.
Take Profit (TP):
Target 1 (TP1): Around $97,000 (mid-FVG H4).
Target 2 (TP2): Demand Zone at $95,000.
Risk-Reward Ratio (R:R):
With an entry at $99,000, SL at $100,600, and TP1 at $97,000:
R:R = (99,000 - 97,000) / (100,600 - 99,000) ≈ 1.25.
With TP2 at $95,000:
R:R = (99,000 - 95,000) / (100,600 - 99,000) ≈ 2.5.
Notes:
Monitor lower timeframes (M15 or M30) for precise entries.
Consider additional confirmation from indicators like RSI or MACD.
Manage risk carefully, limiting each trade to 1-2% of the account balance.

Bitcoin Targets for the 2025Technical analysis for Bitcoin in 2025 suggests a variety of potential outcomes based on current trends, patterns, and market indicators:
# Bullish Trends and Predictions: Several analysts and platforms, including Binance, have forecasted Bitcoin reaching highs up to $200,000 by 2025, driven by increasing institutional adoption, Bitcoin ETFs, and favorable regulatory shifts. This is supported by charts showing a breakout from consolidation patterns in 2024, potentially testing levels at $120,000 and $147,000 based on Fibonacci extensions from previous bull runs.
# In summary, while the technical analysis leans towards optimism with Bitcoin potentially hitting high price targets, the market's volatility suggests that investors should be prepared for both significant gains and potential corrections. Always consider conducting your own research and keeping an eye on both technical indicators and broader market influences.


BTC ready for the ultimate pump?BITCOIN is cooking something huge. Taking support between the 90k - 93k range multiple times. Holding strong. Bulls are not ready to give in. All the dips are crazy buying opportunites.
Markets just keep on shaking off highly leveraged positions, that's why we're seeing all these long wicks, grabbing liquidity , hitting stoplosses . It's an extremely healthy process which transfers Bitcoin from weaker hands to stronger hands, which is ultimately extremely helpful for a long bull-run.
If you wish to invest, then don't over-leverage yourself. This is the moment for BTC / ETH / SOL and all other ALT Coins. We will be experiencing an Alt-Coin season like never before! Off the charts, Off the scripts! 20x-50x returns for sure. I'm personally very positive about crypto for the first half of 2025 at least, advice you to gear up as well!
Keep HODL -ing fellas! It's now or never!
Happy New Year!

BTC - At Strong SupportBTC in news world wide and being moved up and down with each one's opinion and risk taking or profit booking needs. Yearend or month end along with holiday season impacted BTC. while I agree BTC is yet to give the parabolic or banana spike which was seen every 4 years and now is the time for that. Charts are discussed worldwide on one side and its constantly accumulated by people who know why BTC is better than Gold now and in coming days. In my chart two red lines are talked as bullish flag and break of that was called bearish by few and weak hands sold it causing slowness in absorption by people in need of BTC. At the same time BTC is seeing volume at support lines marked in green. Even in 5 or 15 minutes we can clearly see increased volume at which BTC is testing its support for 5th time. Earlier mentioned megaphone or loudspeaker patter didnt give 5 wave up move due to few selling at the bottom of bull flag area. The black line is the point of control of the complete price move seen last 2+ months. In my view levels below the POC - the black line is some kind of buying levels and above the black line is only selling area or profit booking. In my view below POC is accumulation going on by big players. with new Govt in US in Jan and as per 4 year cycle seeing parabolic spike is expected any time in Jan 2025. This is the time to hold tight and buy as much at every green levels support levels mentioned. we cant stop buying or selling of ETFs impacting money flow and supply & demand of BTC. actually smaller volume in the support could be either less supply or demand as well. Any big hand with new ETFs as talked with vivek or any other company going to give bigger parabolic up move. HongKong Fed or Govt and many such countries accumulating BTC making is better than GOLD to be bought, accumulated for 200K or higher in 2025. Happy New Year to all my dear friends. BTC will make everyone richer in fiat currency.

BTC trend is down
After falling from a high level, BTC has been fluctuating downward around this downward channel. So far, the structure has been broken in the US market.
The price on the hourly line adjusted to the upper edge of the downward channel at 94,000 and fell under pressure. It broke through the previous low of 92,545 and opened up the space below. The current price fell to 91,500, and there is no sign of stopping the decline in the short term.
BTC is in an accelerated decline stage overall. It is also consistent with the previous analysis and has now reached the target position. With the short-term volume weakening, the subsequent rebound will focus on the upper 93,000 line. If this position is not broken, the BTC trend may usher in a sharp drop. In terms of operation, you can go short with the trend.
The price of Bitcoin is experiencing a steady decline - 30.12.24Strategy 1: Bullish Trade (Long Position)
Condition: Wait for the price to react at the Demand Zone (90,362 - 92,000 USD) and show bullish reversal signals (e.g., pin bar, engulfing candle, or strong upward momentum on the H1 chart).
Entry Point:
Enter the trade when the price shows confirmation of a bounce between 90,500 - 91,000 USD.
Stop Loss (SL):
Place the stop loss below the Demand Zone at 89,800 USD (for safety).
Take Profit (TP):
TP1: Supply Zone (94,980 - 96,000 USD) (+4,000 USD potential profit).
TP2: FVG H4 (99,550 USD) if the price continues higher (+8,000 USD potential profit).
Risk-to-Reward Ratio (R:R):
Risk: ~1,500 USD (SL at 89,800).
Reward:
TP1: +4,000 USD (R:R ≈ 1:2.7).
TP2: +8,000 USD (R:R ≈ 1:5.3).
Strategy 2: Bearish Trade (Short Position)
Condition: Wait for the price to rise into the Supply Zone (94,980 - 96,000 USD) and show bearish reversal signals (e.g., bearish engulfing, pin bar, or structure break on the H1 chart).
Entry Point:
Enter the trade when the price enters the Supply Zone (95,000 - 96,000 USD) and confirms a reversal.
Stop Loss (SL):
Place the stop loss above the Supply Zone at 96,500 USD.
Take Profit (TP):
TP1: Demand Zone (90,362 - 92,000 USD) (+4,000 USD potential profit).
TP2: Larger Demand Zone at 86,000 USD if the price continues downward (+9,000 USD potential profit).
Risk-to-Reward Ratio (R:R):
Risk: ~1,500 USD (SL at 96,500).
Reward:
TP1: +4,000 USD (R:R ≈ 1:2.7).
TP2: +9,000 USD (R:R ≈ 1:6).
Trading Notes:
Confirm the Signal: Avoid entering trades without strong confirmation signals (e.g., reversal candles or high volume).
Risk Management: Limit risk per trade to 1-2% of your account balance.
Monitor Price Action: If the price breaks through the Supply Zone aggressively, cancel the bearish strategy.
Follow Me. Good luck!

Bitcoin Bearish View Bitcoin Going On Trend HL LH
If Break 92000 Level Its Going Down Somthing 88000

A support strong for bitcoinBitcoin is testing the support many times. if it sustains big movement for long

BTC is accumulating momentum, how should long and short position
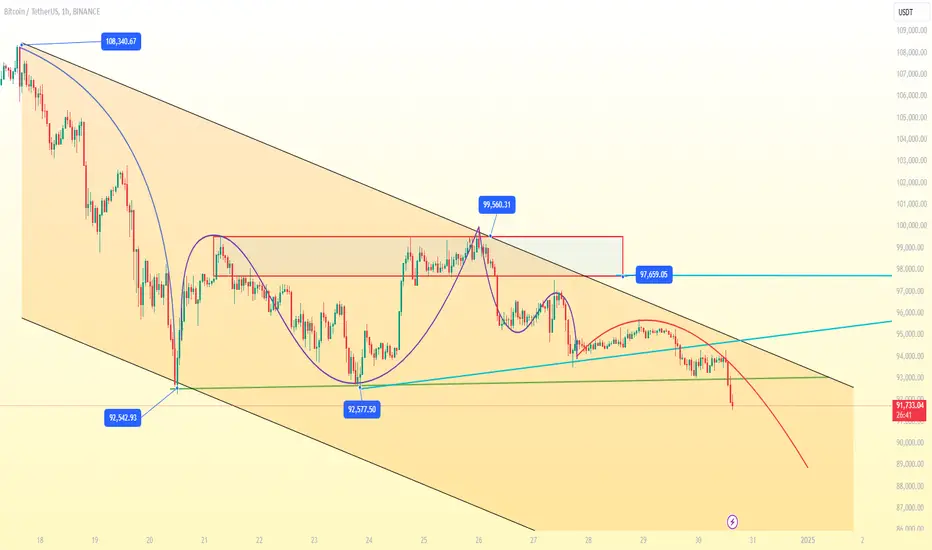
BTC has recently fallen from a high level. The price turned and fell from the high point of 108340 to 92542 to stop falling and adjust. So far, BTC has entered a short-term decline.
The price on the hourly line rebounded to the support of 92542 and rose. The price failed to hit the integer of 100,000 for the second time, forming a double top decline structure. The current trend fell back to 93500 and entered a narrow horizontal consolidation stage. The resistance of 96000 above is under pressure. If this position breaks, the hourly line descending channel will be broken. In the short term, the price will test the 100000 line above. The support of 93500 below, if this position breaks, the short-term rebound trend will end and test the 92542 line below.
On the whole, BTC entered the accumulation stage after the short-term double top fell. In terms of trend, the price also reached the top of the hourly channel. However, there are many resistance levels above. Even if the downward channel is broken later, the trend will enter the horizontal range structure. But if the trend breaks down, there is more room for the price to continue to fall.
In terms of operation, I personally think that BTC will continue to rebound and short before the channel breaks up.
Long orders will be involved after the price breaks through the 100,000 line.
