Part 12 Trading Master Class With Experts Importance of Knowledge and Timing:
Successful option trading depends heavily on market knowledge, timing, and strategy selection. Understanding concepts like intrinsic value, time decay (theta), volatility (vega), and interest rate effects (rho) is essential. Mistimed trades or poorly chosen strategies can lead to total loss of the premium. Additionally, options are time-sensitive assets, meaning the value erodes as expiration approaches. Traders must monitor market conditions and adjust positions accordingly. While options can offer high returns, they also carry significant risk, and disciplined analysis, research, and risk management are crucial to navigate the complexity of option markets effectively.
Trade ideas

Midcap Multi-Bagger Moves in Trading1. Understanding Midcap Stocks
Midcap stocks generally refer to companies with a market capitalization ranging between ₹5,000 crore to ₹20,000 crore (or $500 million to $5 billion) depending on the market. They strike a balance between stability and growth potential:
Large-cap stocks are stable but slow-growing.
Small-cap stocks offer high growth but come with extreme volatility.
Midcap stocks combine growth potential with manageable risk, making them ideal candidates for multi-bagger moves.
Midcaps are often in the growth phase of their lifecycle. They have proven business models but are not yet fully recognized by institutional investors. This under-representation creates opportunities for early investors to gain extraordinary returns.
2. Characteristics of Midcap Multi-Bagger Stocks
Not all midcap stocks become multi-baggers. Successful midcap multi-baggers usually share some common characteristics:
Strong Revenue and Earnings Growth: Companies showing consistent growth in revenue and net profits, often higher than industry averages.
Scalable Business Model: Ability to expand operations, enter new markets, or increase product offerings without proportionally increasing costs.
Innovative Products/Services: Midcaps introducing unique products or services that create market disruption.
High Return Ratios: Consistently high ROE (Return on Equity) and ROCE (Return on Capital Employed) indicate efficient use of capital.
Low Debt Levels: Companies with manageable debt can reinvest profits into growth rather than servicing loans.
Institutional Recognition: Gradual interest from mutual funds and large investors often acts as a catalyst for price appreciation.
3. Factors Driving Multi-Bagger Moves
The movement of midcap stocks into multi-bagger territory is driven by a combination of fundamental, technical, and macroeconomic factors:
a) Fundamental Drivers
Profitability Expansion: Companies increasing margins due to operational efficiency, technology adoption, or scale benefits.
Sectoral Tailwinds: Industries experiencing high demand, regulatory support, or government incentives (like IT, renewable energy, pharmaceuticals).
Market Share Gains: Companies successfully capturing competitors’ market share through innovation or cost leadership.
b) Technical Drivers
Breakout Patterns: Price movements above historical resistance levels often attract momentum traders.
Volume Expansion: Rising volumes signal genuine investor interest and reduce liquidity concerns.
Institutional Accumulation: When large investors buy in gradually, it supports price stability and long-term uptrend.
c) Macroeconomic Factors
Economic Growth: Midcaps benefit more in a growing economy due to scalability and higher discretionary spending.
Policy Support: Favorable government policies like Make in India, tax incentives, or industry-specific reforms accelerate growth.
Liquidity Conditions: Low-interest rates and higher retail participation often drive up stock prices, including midcaps.
4. Strategies to Identify Midcap Multi-Baggers
Investors employ multiple strategies to identify potential midcap multi-baggers:
Fundamental Analysis:
Analyze balance sheets for revenue and profit growth.
Assess profitability ratios like ROE, ROCE, and profit margins.
Check debt-to-equity ratios and cash flows.
Sectoral Analysis:
Identify industries with high growth potential.
Look for midcaps within these sectors that are leaders or emerging leaders.
Technical Screening:
Use moving averages, trend lines, and volume indicators to spot breakout stocks.
Identify consolidation patterns that precede a rally.
Growth vs. Valuation Analysis:
A true multi-bagger is often undervalued relative to its growth potential.
Metrics like PEG ratio (Price/Earnings to Growth) can be useful.
Tracking Promoter Holding and Insider Buying:
Increasing promoter confidence is often a precursor to stock price appreciation.
Macro Awareness:
Be aware of government initiatives, economic cycles, and sector-specific reforms.
5. Risks Associated with Midcap Multi-Baggers
While midcap multi-baggers are enticing, they come with risks that every trader should be aware of:
Volatility: Prices can fluctuate dramatically due to low liquidity.
Market Sentiment: Negative news or global macro events can disproportionately impact midcaps.
Execution Risk: Companies may fail to scale operations efficiently, leading to missed expectations.
Overvaluation Risk: During bull markets, midcaps often get overvalued, leading to corrections.
Regulatory Risk: Policy changes can affect midcap companies more than established large-cap firms.
Risk management strategies like stop-loss orders, portfolio diversification, and position sizing are crucial to protect capital.
6. Trading Approaches for Midcap Multi-Baggers
There are multiple ways to approach midcap multi-bagger stocks in trading:
a) Long-Term Investment (Buy & Hold)
Buy fundamentally strong midcaps with multi-bagger potential.
Hold through market volatility to realize exponential gains over 3-5 years.
b) Momentum Trading
Focus on midcaps showing breakout patterns, high relative strength, and institutional buying.
Enter during upward trends and exit once momentum weakens.
c) Swing Trading
Identify short-term price oscillations in fundamentally strong midcaps.
Capitalize on price swings while limiting exposure to prolonged downturns.
d) Options Strategies
Use call options to leverage returns with limited capital in highly promising midcap stocks.
Protective puts can hedge against unexpected downtrends.
7. Case Studies of Midcap Multi-Baggers
Several midcap companies in India and globally have delivered exceptional returns:
Bajaj Finance (India) – Evolved from midcap to large-cap, delivering 10x+ returns over a decade.
Page Industries (India) – Niche player in textiles, achieved multi-bagger status due to consistent growth.
Eicher Motors (India) – Benefited from strong product positioning and market share gains.
Case studies highlight the importance of timely investment, research, and patience in reaping multi-bagger benefits.
8. Tips for Retail Traders
Diversify: Avoid putting all capital into one midcap stock.
Focus on Fundamentals: Short-term volatility may be high, but strong fundamentals increase multi-bagger chances.
Monitor Trends: Follow market news, sector growth, and macroeconomic indicators.
Patience is Key: Multi-bagger moves often take 3–7 years to materialize.
Avoid Herd Mentality: Don’t chase stocks just because they are trending; focus on research-based picks.
Conclusion
Midcap multi-baggers represent a unique opportunity for traders and investors willing to balance risk and reward. These stocks lie at the intersection of growth, innovation, and market inefficiencies. While identifying them requires a combination of fundamental research, technical analysis, and macroeconomic awareness, the potential rewards can be extraordinary. By understanding the drivers, risks, and strategies involved, traders can position themselves to benefit from the transformational wealth creation that midcap multi-baggers offer.
The world of midcap trading is not for the faint-hearted, but for disciplined investors with a growth mindset, it can be the playground of extraordinary returns.
My Analysis Perfect 100%Analysis of the Price Action
Based on the image, the market experienced a significant and rapid downward movement, indicated by the long red candle (often called a 'sell-off' or 'wick' depending on how the candle closes) around the area you've highlighted.
• Before the Drop: The price was trading in a relatively high range, hovering around the 120,000 to 122,000 USDT mark, following a strong uptrend from late September to early October.
• The Drop: The price crashed through multiple key support levels (the horizontal white, yellow, and red lines, as well as the green/red zones you have drawn) in a very short period.
• The Volume: This massive price drop was accompanied by a huge spike in selling volume (the very tall red bar in the volume indicator at the bottom), which confirms a strong and sudden selling event.
• The Low: The price wick reached a low around 101,668.1 USDT before bouncing slightly.
Interpreting "My Target is Done"
Since I don't know the specifics of your trading strategy, "My target is done" could mean a few things:
1. Stop-Loss Hit: If you were long (betting on the price going up) and had a stop-loss set somewhere in the zone where the price fell, this sudden move would have triggered your stop-loss, closing your position for a loss (a target for your risk management).
2. Take-Profit Hit (Short Position): If you were shorting (betting on the price going down) and had a take-profit target set in the lower price ranges (perhaps around 110,000 or 105,000 USDT), this drop would have executed your take-profit order for a gain. This is the most common interpretation if you are celebrating a target being done during a crash.
3. Target for Entry: If you were waiting to buy the dip, the price hitting the very low levels (the wick) might have triggered a buy limit order you had placed, meaning your target for a new entry was achieved.
Given the nature of the move, if you were short, congratulations! If you were long, this looks like a painful liquidation or stop-loss event.

Bitcoin Correction = Smart Money Opportunity, ready for 3% move!Bitcoin (BTCUSDT) has been consolidating inside a well-defined descending channel , reflecting a healthy correction phase after the recent rally. While many traders panic in these phases, experienced players know that corrections are temporary, structures define direction.
Notice how price is approaching a key zone between 117K–116K, which aligns perfectly with both the lower channel boundary and the prior breakout retest zone. This area acts as a high-probability reversal zone , where strong hands are likely waiting for confirmation candles to re-enter the trend.
Psychologically, the 120K round level remains crucial. Expect volatility near this zone, as retail traders get trapped while smart money positions itself quietly before the breakout.
Once the breakout sustains above 121K, short-term traders could target levels around 122.5K–123K , while positional traders may aim for much higher structural targets.
Rahul’s Tip:
Never fear a pullback when structure stays intact, institutions use these dips to accumulate while the public exits too early. Stay patient, let the structure play out.
Analysis By @TraderRahulPal (TradingView Moderator)
If this breakdown and re-entry logic helped you, don’t forget to like and follow for regular updates.
Disclaimer: This analysis is for educational purposes only and should not be taken as financial advice. Please do your own research or consult your financial advisor before investing.

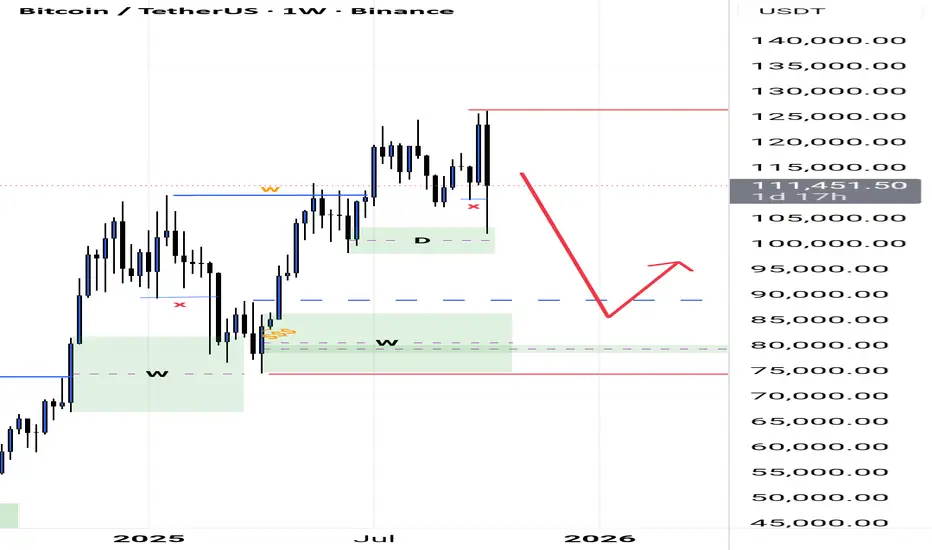
My view on BTC in Weekly timeframe.As per my chart, the trading range on Weekly timeframe marked in red lines. If a correction happens, BTC many fall down to below 90000. The possible areas to mitigate are 93000(FVG), 90000(OrderFlow), 88000(OB) and finally 80000(refined OB).
How to Build a Crypto Portfolio for Long-Term Wealth?Hello Traders!
The crypto market can look exciting, fast profits, new coins every week, and hype everywhere.
But those who build long-term wealth in crypto don’t chase trends; they build structured portfolios with strategy.
Let’s understand how to create a crypto portfolio that can grow steadily over time, not just in bull runs.
1. Decide Your Investment Horizon
Before buying anything, decide your goal, 3 years, 5 years, or 10 years.
Longer horizons allow you to ride out volatility and benefit from compounding.
If you’re thinking short term, you’re speculating, not investing.
2. Allocate Wisely – The 60/30/10 Rule
60%: Blue-chip cryptos like Bitcoin (BTC) and Ethereum (ETH) , the foundation of your portfolio.
30%: Promising large/mid-cap projects (Layer-1s, AI, DeFi leaders).
10%: High-risk, high-reward small-cap or emerging tokens.
This keeps your portfolio stable while still giving growth exposure.
3. Diversify Across Categories
Don’t just hold coins, diversify across crypto sectors:
~Layer-1 platforms (ETH, SOL, AVAX)
~DeFi (AAVE, UNI)
~Infrastructure (LINK, ARB)
~AI/Metaverse (INJ, RNDR, MATIC)
This ensures that if one sector underperforms, others balance your returns.
4. Use SIP or DCA Method
Instead of buying everything at once, invest gradually through Systematic Investment Plans (SIP) or Dollar Cost Averaging (DCA) .
This helps you accumulate more during dips and reduces emotional stress during corrections.
5. Secure and Rebalance Regularly
Use hardware wallets for long-term storage. Don’t keep large amounts on exchanges.
Review your portfolio every 3–6 months and rebalance to maintain original allocation.
Trim profits from overperforming assets and add to undervalued ones.
Rahul’s Tip:
Crypto investing is not about catching every rally, it’s about staying long enough to see technology grow and adoption rise. Patience is your biggest alpha.
Conclusion:
A strong crypto portfolio is like a business, diversified, secure, and managed with discipline.
If you build it smartly, it can become a powerful wealth creator over time.
If this post helped you plan your crypto journey, like it, drop your thoughts in comments, and follow for more practical investment insights!
BTCUSD SHORT VIEW AT 4HAS per my analysis the supply is getting power full and demand is getting week as we can see on chart thats the reason to go short

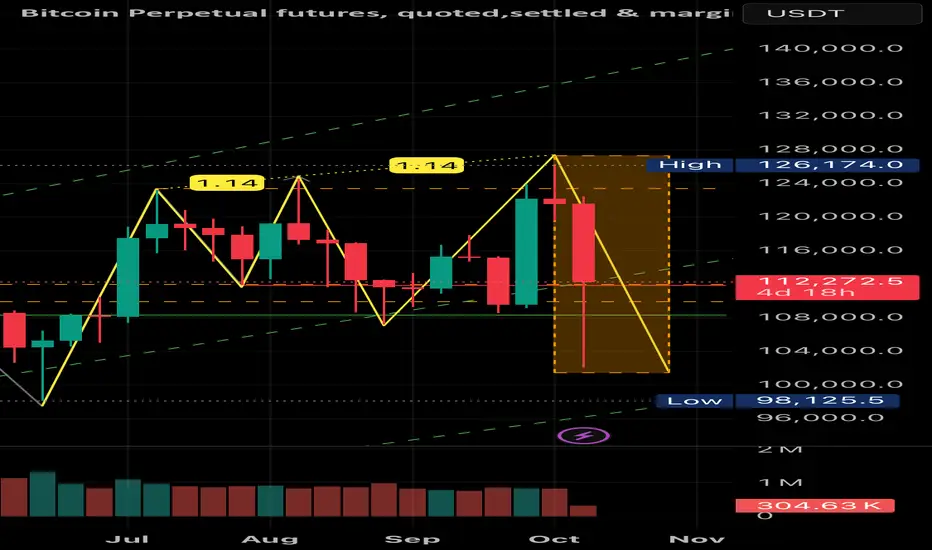
[SeoVereign] BITCOIN BEARISH Outlook – October 13, 2025As of October 13th, I would like to share my bearish outlook on Bitcoin.
The first basis is the Shark pattern within the 1.13–1.414 range.
The Shark pattern, established by Scott Carney, is a modified harmonic pattern that defines its PRZ (Potential Reversal Zone) within the 1.13–1.414 XA extension range.
This zone represents a region where the buying momentum tends to be exhausted after excessive price expansion,
and it is typically interpreted as an area where strong reversal pressure tends to emerge.
Currently, Bitcoin has entered this 1.13–1.414 range and is repeatedly testing the upper resistance zone.
Therefore, I believe the probability of a short-term bearish reversal is gradually increasing.
The second basis is that Wave 5 forms a 0.382 length ratio relative to Waves 0–3.
This is a Fibonacci-based structural relationship often observed in Elliott Wave Theory.
When Wave 5 fails to extend excessively and remains around 0.382 of Waves 0–3,
it typically indicates a phase of exhaustion, followed by a corrective or retracement phase.
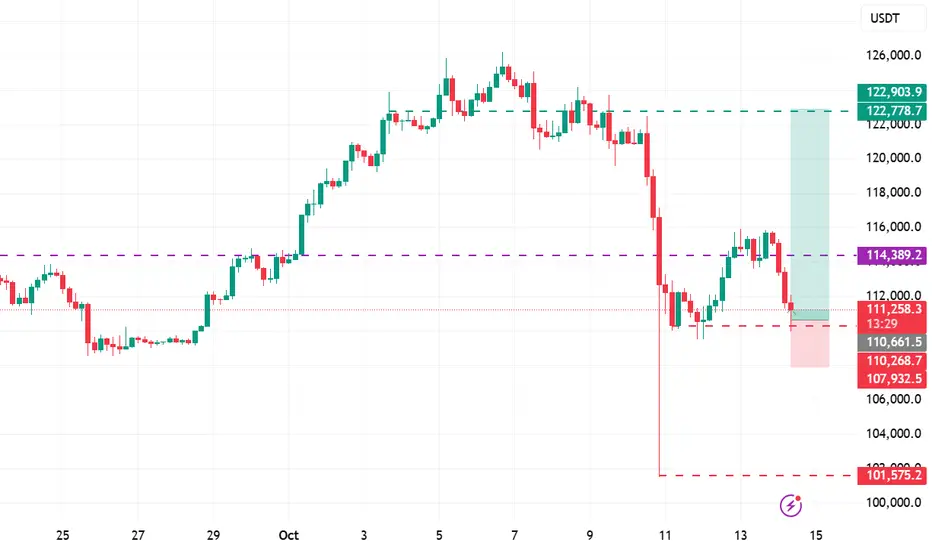
Accordingly, I set the average target price around 111,350 USDT.
Depending on the future development of the chart,
I will provide updates on position management and any changes to this idea.
Thank you for reading.

Bitcoin LTF Analysis & Market OutlookBitcoin LTF Analysis & Market Outlook
#Bitcoin still doesn’t look strong on LTF, and I’m expecting some more downside movement in the coming days. So if you’re holding high leverage longs, manage them carefully and always use strict stop loss.
Here’s the key structure to watch:
Resistance 1: $116,000
If CRYPTOCAP:BTC fails to break and hold above this level, momentum stays weak and we could revisit the $100,000 zone again.
Resistance 2: $122,500
Only a confirmed breakout above this level can trigger the next leg toward a new ATH around $150,000.
Until then, play defense. Avoid emotional trades, don’t gamble with your hard-earned money, and only take entries backed by clear confluence, strategy, and discipline.
Remember: The market always rewards patience, not greed. Stay alert, follow structure, and let the setup come to you.

Part 11 Trading Master ClassWhat Is Option Trading?
Option trading is a form of derivatives trading, where investors buy or sell contracts that give them the right but not the obligation to buy or sell an underlying asset (such as stocks, indices, or commodities) at a predetermined price before or on a specific date.
Unlike stocks, which represent ownership in a company, options represent a financial contract derived from the price movement of another asset — hence, they are part of the derivatives market.
There are two main types of options:
Call Options: Give the holder the right to buy an asset at a set price.
Put Options: Give the holder the right to sell an asset at a set price.
Each option contract involves:
Strike Price: The agreed-upon price for buying/selling the asset.
Expiry Date: The last date the option can be exercised.
Premium: The price paid to buy the option.

The Truth About Overnight Riches What Influencers Won’t Tell YouHello Traders!
You’ve seen it everywhere, screenshots of massive profits, luxury cars, and captions like “I made this in one trade.”
The illusion of overnight riches sells fast, but what you don’t see is the reality behind it.
Let’s uncover what most influencers never talk about, the truth behind quick money in trading.
1. The Reality Behind the Screenshot
That big profit post doesn’t show how many losses came before it.
Many traders show one winning trade out of dozens of failed ones.
You never see the emotional stress, sleepless nights, and blown accounts behind that single success.
2. Overnight Riches Come with Overnight Risk
The faster you try to make money, the faster you can lose it.
Trading with oversized lots or without stop losses may look exciting, until one bad move wipes you out.
Wealth that lasts is built on consistency, not chaos.
3. The Boring Stuff Makes You Rich
Proper risk management, discipline, and patience are not flashy, but they’re what actually make traders successful.
While others chase quick money, real traders master control over emotions and capital.
Slow growth feels boring, but it’s the only path that’s sustainable.
4. The Hidden Cost of “Fast” Success
Chasing overnight profits creates mental pressure and greed.
Even if you win once, you’ll keep gambling to repeat it, until luck runs out.
True freedom in trading comes when you stop forcing success and start following process
Rahul’s Tip:
Don’t compare your beginning to someone else’s highlight reel. The real traders you admire have spent years learning, failing, and improving before they started winning.
Conclusion:
The idea of overnight riches is a dream sold to those who don’t know better.
But once you understand trading is a skill, not a lottery, you’ll stop rushing and start growing steadily.
The best traders don’t chase money; they chase mastery, and money follows naturally.
If this post gave you clarity about the real journey of trading, like it, share your thoughts in comments, and follow for more honest trading insights!

Part 4 Institutional Trading Types of Option Trading Strategies
Option traders use different strategies depending on their market view:
Bullish Strategies: Buying Call Options, Bull Call Spreads.
Bearish Strategies: Buying Put Options, Bear Put Spreads.
Neutral Strategies: Iron Condor, Straddle, Strangle — for when the trader expects low volatility.
These strategies help balance risk and reward, allowing traders to profit even in sideways markets.

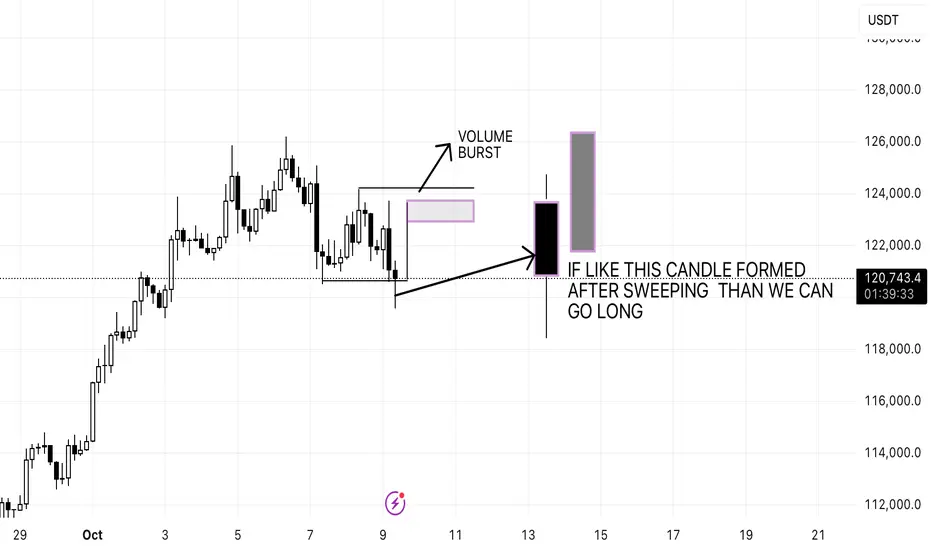
bitcoin to retest back for FVGBitcoin reversal pattern after a massive sell showing an upward trendtogo cover the FVG.
BTC market snapshotBTC is confidently holding above 119K, aiming to continue its rise toward a new all-time high. The hourly timeframes are signaling a pause/pullback for the coming day. Globally, the picture strengthens the short signal.
I am bearish.

BTC 10/10/2025 - Three Drives PatternEverything was forewarned, it's just a matter of whether you pay attention to the right time frame or not.
BTC 10/10/2025 - Three Drives Pattern
LONG BTC AFTER SWEEPING OR AFTER EFFECTOnce the candle closed above the black line and make a hanging man with a marubuzu candle than we can achieve the marked target or our previous analysis will continue
BTC/UsDT Short sideHere is a description of the downside scenario as depicted:
1. The Short Entry Point: The short trade is set up to begin at the approximate current price level, which is around $122,000 to $123,000. This suggests a trader is anticipating that the current strong bullish move has reached its peak and a reversal is imminent.
2. The Stop-Loss (Risk):
• The top boundary of the red box, which extends into the red area above the entry, represents the stop-loss level.
• This red area is relatively small compared to the profit target, suggesting a favorable Risk/Reward ratio.
• The stop-loss price appears to be around $126,864.5 (the highest point in the image is $126,864.5). If the price moves above this level, the trade would be closed for a manageable loss.
3. The Take-Profit (Reward/Target):
• The lower boundary of the red box, which extends significantly downwards, represents the take-profit or target area for the short trade.
• The profit target line appears to be around the $108,500 to $108,800 level, which is a key low from late September.
• This is where the trader would expect to close the trade for a profit if the anticipated downside move materializes.
4. The Context: The "downside chart" fundamentally represents a trade where the trader is betting on a significant price decline back toward the prior support levels after the large recent rally.
In summary, the downside chart (the red box) illustrates a hypothetical short position where a trader is risking a small amount of profit from the recent rally to potentially capture a much larger drop in price, targeting the strong support zone established just before the recent V-shaped recovery.
The term "downside chart" in this context refers to the short trade setup that has been drawn on the chart, which is visualized using the large red shaded box.
This setup represents a trader's prediction that the price of BTCUSDT will reverse and fall significantly from its current high.
Here is the breakdown of the downside trade setup:
• Entry Point (Current Price): The trade is initiated for a short position (selling) near the current market price, which is around $122,379.1. This is the belief that the recent powerful rally is exhausted and a reversal is starting.
• Stop-Loss (Risk): The area above the entry point, colored in the brighter red on the chart, represents the Stop-Loss level.
• The stop-loss price appears to be around $126,864.5 (the high shown in the top right).
• This is the level where the trade would be automatically closed to limit the loss if the price continues to rise against the short position.
• Take-Profit (Reward/Target): The large green shaded area below the entry represents the Take-Profit or profit target for the short trade.
• The target price is set significantly lower, near the prior support/lows from late September, likely around the $108,500 to $108,800 range.
• This is where the trader expects to close the short position to realize a profit.
• Risk/Reward Ratio (R:R): By comparing the distance from the entry to the stop-loss (the risk, in red) versus the distance from the entry to the take-profit (the reward, in green), the trade demonstrates a favorable Risk/Reward ratio. The reward (green box) is visually much larger than the risk (top red portion), suggesting the trader is attempting to risk a small amount to potentially gain a large profit.
In summary, the downside chart is the visual representation of a bearish trading strategy, expecting a move down from over $122k to the support area near $108k.

BTCUSDT – Possible Bounce Back Zone Ahead?Title:
🚀 BTCUSDT – Possible Bounce Back Zone Ahead?
Description / Note:
Bitcoin is at a decisive point. If price loses the Bull Market Support Band, the next key area of interest may be the 50-week SMA, currently lining up near the $100K region.
Why it matters:
📌 The 50-week SMA has been a reliable dynamic support in past market cycles.
📌 The ongoing bull flag formation suggests potential continuation after consolidation.
📌 Previous trendlines also converge in this area, adding confluence.
In short:
If BTC fails to hold the Bull Market Support Band, watch the 50-week SMA near $100K as a potential bounce-back zone.

BTCUSD ANALYSIS ON 30 MINI have solve the btcusd by ARC structure the first move fake than will be reversal and we want first move upwards (FMFR)


Introduction to Stock Market Investing1. Understanding the Stock Market
The stock market is a complex network of exchanges where buyers and sellers trade shares of publicly held companies. It functions similarly to an auction system, with prices determined by supply and demand. Major stock exchanges globally include the New York Stock Exchange (NYSE), NASDAQ, London Stock Exchange (LSE), and in India, the National Stock Exchange (NSE) and Bombay Stock Exchange (BSE).
1.1 Role of the Stock Market
Capital Formation: Companies raise funds for expansion and operations by issuing shares.
Liquidity: Investors can easily buy or sell shares, providing flexibility and access to cash.
Price Discovery: The stock market reflects the perceived value of companies based on performance, future prospects, and investor sentiment.
Economic Indicator: Stock market trends often indicate the economic health of a country.
2. Types of Stock Market Investments
Investing in stocks is not a one-size-fits-all approach. Different investment types cater to varied risk appetites, time horizons, and financial goals.
2.1 Common Stocks
Common stocks represent ownership in a company and provide voting rights in shareholder meetings. Investors earn returns primarily through:
Capital Gains: Selling shares at a higher price than purchased.
Dividends: Periodic earnings distributed by the company.
2.2 Preferred Stocks
Preferred stocks are a hybrid between bonds and common stocks. They provide fixed dividends and have priority over common stocks in case of liquidation but usually lack voting rights.
2.3 Bonds
Though technically not stocks, bonds are debt instruments issued by companies or governments. Investors receive interest and principal repayment. Bonds are considered safer than stocks but typically offer lower returns.
2.4 Mutual Funds and ETFs
For beginners, mutual funds and exchange-traded funds (ETFs) provide a diversified investment portfolio managed by professionals. Mutual funds pool money from multiple investors to buy a mix of stocks, bonds, or other assets. ETFs, traded like stocks, track specific indices, sectors, or commodities.
2.5 Derivatives
Derivatives such as options and futures derive value from underlying assets like stocks. They are advanced tools used for hedging or speculative purposes and carry higher risk.
3. Basics of Stock Market Analysis
Successful investing requires analysis to make informed decisions. There are two main approaches:
3.1 Fundamental Analysis
Fundamental analysis evaluates a company’s intrinsic value by examining:
Financial Statements: Balance sheets, income statements, and cash flow statements.
Profitability Ratios: Return on equity, profit margins.
Growth Prospects: Revenue growth, market share, and industry trends.
Economic Conditions: Interest rates, inflation, and overall economic climate.
The goal is to identify undervalued stocks for long-term investment.
3.2 Technical Analysis
Technical analysis studies price movements and trading volumes using charts and statistical indicators. Key tools include:
Moving Averages: Identify trends over time.
Relative Strength Index (RSI): Measures overbought or oversold conditions.
Support and Resistance Levels: Price points where stocks typically reverse trends.
This approach is often preferred by traders focusing on short-term price movements.
4. Stock Market Strategies
Different investors adopt varying strategies based on their risk tolerance, investment horizon, and financial goals.
4.1 Long-Term Investing
Long-term investors, or “buy-and-hold” investors, focus on companies with strong fundamentals and growth potential. They tolerate short-term market volatility for wealth accumulation over years.
4.2 Dividend Investing
Investors seeking regular income invest in companies with consistent dividend payouts. Dividend reinvestment can significantly boost wealth over time.
4.3 Growth Investing
Growth investors target companies expected to grow faster than the market. These companies may not pay dividends, focusing instead on reinvesting profits to expand operations.
4.4 Value Investing
Value investors look for stocks trading below their intrinsic value. By analyzing fundamentals, they aim to buy undervalued stocks and benefit from price corrections over time.
4.5 Momentum and Day Trading
Active traders use momentum strategies to capitalize on short-term trends, while day traders buy and sell within the same day. These strategies require technical analysis, speed, and discipline.
5. Risk Management in Stock Investing
Investing in the stock market comes with risks. Effective risk management helps protect capital and improve long-term returns.
5.1 Types of Risk
Market Risk: Fluctuations due to economic or political events.
Company Risk: Poor performance or scandals affecting a particular company.
Liquidity Risk: Difficulty in selling shares quickly at desired prices.
Inflation Risk: Rising inflation reducing real returns.
Interest Rate Risk: Changes in interest rates affecting market valuations.
5.2 Risk Mitigation Strategies
Diversification: Spread investments across sectors and asset classes.
Asset Allocation: Balance between stocks, bonds, and cash based on risk appetite.
Stop-Loss Orders: Automatically sell stocks when they fall below a certain price.
Regular Review: Monitor portfolio performance and rebalance periodically.
6. Behavioral Aspects of Investing
Stock market investing is not purely analytical; psychology plays a critical role. Behavioral finance studies how emotions influence decision-making.
6.1 Common Investor Biases
Overconfidence: Believing one can predict the market accurately.
Herd Mentality: Following trends without independent analysis.
Loss Aversion: Fear of losses leading to poor decision-making.
Recency Bias: Giving more weight to recent market events than historical data.
6.2 Developing the Right Mindset
Successful investors cultivate patience, discipline, and long-term thinking. Emotional control during market volatility is key to avoiding impulsive decisions.
7. Tools and Resources for Investors
Investors have access to numerous tools and resources to make informed decisions:
Stock Screeners: Identify potential investment opportunities.
Financial News Portals: Bloomberg, Reuters, and Moneycontrol provide up-to-date market information.
Research Reports: Detailed analysis from brokerage firms.
Investment Apps: Platforms for trading and portfolio management.
8. Regulatory Framework and Investor Protection
Stock markets operate under strict regulations to ensure transparency, fairness, and investor protection. Key regulatory bodies include:
SEBI (India): Securities and Exchange Board of India.
SEC (USA): Securities and Exchange Commission.
FCA (UK): Financial Conduct Authority.
Investor protection measures include disclosure requirements, insider trading regulations, and grievance redressal mechanisms.
9. Advantages and Challenges of Stock Market Investing
9.1 Advantages
Potential for high returns compared to traditional savings instruments.
Liquidity and ease of buying/selling shares.
Opportunity to participate in the growth of leading companies.
Diversification through mutual funds, ETFs, and global markets.
9.2 Challenges
Market volatility can lead to short-term losses.
Requires knowledge and research to avoid poor investments.
Emotional stress due to fluctuating market conditions.
Exposure to macroeconomic and geopolitical risks.
10. Steps to Begin Investing
Starting with stock market investing requires a structured approach:
Set Financial Goals: Determine short-term and long-term objectives.
Learn Basics: Understand financial statements, market indices, and investment types.
Choose Investment Platform: Open a brokerage or demat account.
Start Small: Begin with small investments and gradually increase exposure.
Diversify Portfolio: Invest across sectors and asset classes.
Monitor and Adjust: Review performance and adapt strategies as needed.
Stay Informed: Keep updated with market trends, news, and economic indicators.
Conclusion
Stock market investing offers a powerful avenue for wealth creation but requires knowledge, discipline, and patience. From understanding market mechanics to analyzing stocks, adopting strategies, managing risks, and overcoming behavioral biases, a well-rounded approach increases the likelihood of long-term success. By starting early, investing wisely, and staying informed, investors can harness the full potential of the stock market to achieve their financial goals.
BTCUSD SHORT ON 4HAter swapping the previous inverted hammer high and forming again a inverted hammer with marubozu candle use strategy (AFTER EFFECT)

[SeoVereign] BITCOIN BEARISH Outlook – October 05, 2025Hello everyone.
I hope you are all having a peaceful day.
Today, I am writing to share my Bitcoin short position view as of October 5th.
The first basis is the 1.902 CRAB pattern. In a traditional Crab pattern, the 1.618 extension of the XA leg is regarded as the main PRZ (Potential Reversal Zone), but in practice, it is often observed that additional extension values such as 1.902XA are formed. This zone is an area where the price, after an excessive extension, tends to reverse sharply, and it is one of the regions within harmonic patterns where strong volatility and reversal signals frequently appear. Currently, Bitcoin is encountering resistance around this 1.902XA level, which increases the probability of a short-term bearish reversal.
The second basis is that wave N and wave M are forming a 1:1 length ratio. In other words, both waves are proceeding with equal length, which resembles the AB=CD structure—a fundamental form of harmonic patterns. Such wave symmetry indicates that the market is moving in a consistent rhythm, and when two waves complete with the same length, that point often acts as a reversal signal.
Accordingly, the average target price is set around 119,168 USDT.
As the chart continues to develop, I will provide updates to this idea to inform you about my position management.
Thank you for reading.
