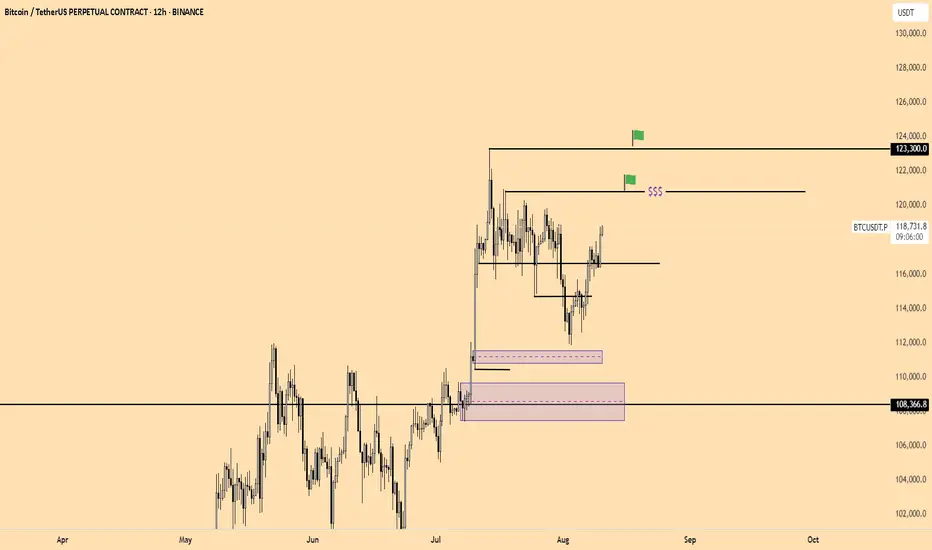
BTC - 13th Aug viewPrice seems to be making sub waves inside the 5th wave where we have new ATH targets open.
In the sub waves price just took 2nd wave support and make 3rd wave and need to see 4th sub wave re test 120200 to 120400 support area or else make false move by breaking to 118 which is a possibility but i do not want or do not expect it to happen after such a good up move. Just want to caution so money management is taken care and do trade only with 50 to 60% capital all ways. buy the dips and sell the rallies with profits and with no greed for more and more without taking profits... we will get dips too... or at least higher low with proved support to take raisk instead of chasing
Trade ideas

BTCUSDT – Bulls Maintain Control, Upside Scenario IntactOver the past two days , the crypto market has been supported by a series of positive developments: yesterday, U.S. PPI data cooled, easing inflationary pressure and strengthening expectations that the Fed may soon cut interest rates; today, global risk sentiment improved as U.S. and European stock indices rebounded; and most recently, Bitcoin ETF inflows continued to post net gains, signaling that institutional investors remain confident in the bullish trend.
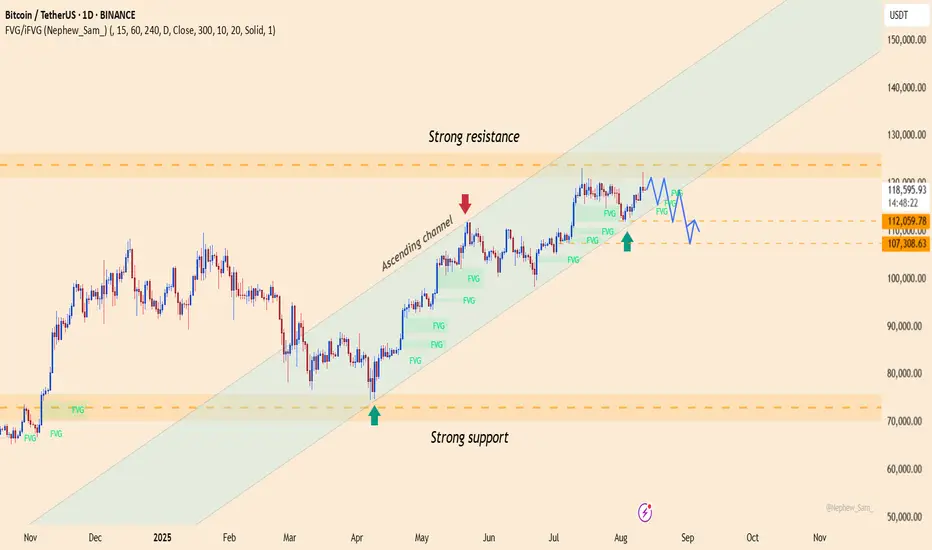
On the daily chart , BTC is still moving within an ascending channel, with a strong resistance zone around 121,000 – 122,000 USDT. Currently, the price is consolidating right near the upper boundary of the channel, showing that buying pressure remains in control. The strong support zone lies between 112,000 – 110,000 USDT, aligning with the channel’s lower boundary.
Preferred strategy: look for buying opportunities if the price pulls back toward 112,000 – 110,000 USDT, targeting a return to 121,000 USDT and potentially new highs. The bullish trend remains intact as long as the price stays within this ascending channel.
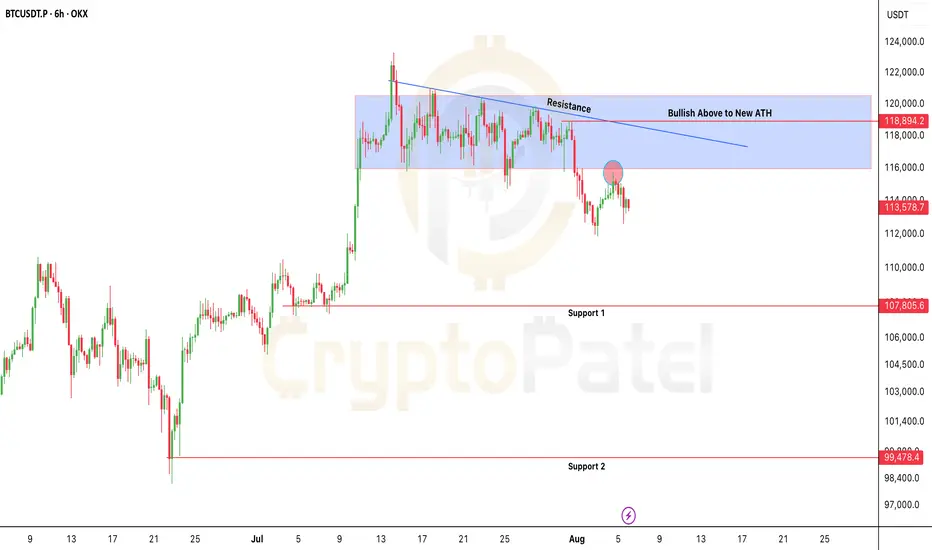
BTC range play in HTFI think CRYPTOCAP:BTC is still in Range here, Eth close to ATH, BTC not giving much a bigger move currently
There is no reason to be bearish currently but we got to see the range play in this entire bull run till now from the bottom every time we played range and then move higher, i think this time is still the same and we are going for range Lows again,
As i snipped BTC from the range lows and even posted it live on my Trading View post, i really CRYPTOCAP:BTC to play RANGE Game again for 150K$
This is the time to become conservative in your long as soon as we are getting closer to ATH, i think only keeping 30-40% is more than enough if you longed with me previously from the bottom..
ETH idea will be shared soon.
FOLLOW FOR MORE SUCH CONTENT.
Hope you all have a great week, month and year

[SeoVereign] BITCOIN BEARISH Outlook – August 12, 2025Today, I will introduce my short position outlook for Bitcoin on August 12.
There are two grounds for this idea.
First, an arbitrary wave X forms a 0.382 length ratio with another arbitrary wave.
In general, the 5th wave often has a length ratio of 0.382 compared to the 1st wave.
In this case as well, it can be counted in the same way.
Second, as a result of applying the Fibonacci in reverse to the wave that appears to be in a diagonal form,
the point where the ratio of 2 is formed almost exactly matched the recent high of around 112,360.
I often use this kind of “reverse Fibonacci.”
Normally, Fibonacci is drawn with the past point as the first point and the future point as the second point,
but I do the opposite — setting the future point as the first point and the past point as the second point.
In this case, ratios such as 1.618 / 2 / 2.24 / 2.618 / 3 / 3.618 are often used.
It is especially effective for measuring ratios between wave pairs that skip one wave,
such as between wave A and wave C, or between wave 3 and wave 1.
thank you.

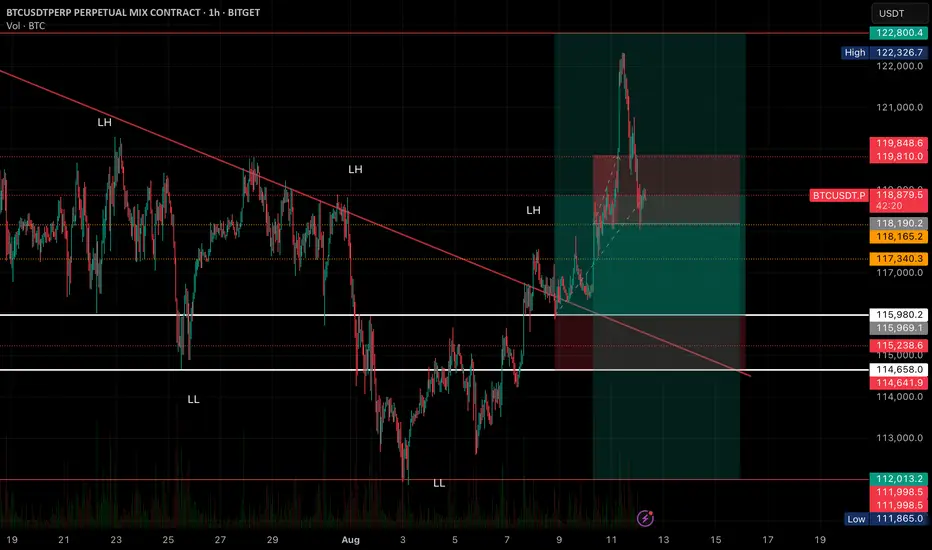
BTC upward moveThis BTC/USDT 1-hour chart is showing a transition from a downtrend to a potential uptrend.
Here’s what’s going on step-by-step:
⸻
1. Past Price Action (Left Side)
• Price was making Lower Highs (LH) and Lower Lows (LL) — a classic downtrend.
• The red diagonal trendline marks that descending resistance.
⸻
2. Breakout
• Price broke above the descending trendline around Aug 9.
• After breaking out, it came back to retest that breakout level — confirming it as new support.
• This retest is often a strong bullish signal.
⸻
3. Rally
• After the retest, BTC rallied sharply, reaching near 122,800 USDT.
• This move triggered a long trade zone (highlighted in green) with a stop-loss area (red box below).
⸻
4. Current Situation
• BTC is now pulling back after hitting resistance.
• The main short-term support zone is 118,150 – 118,190.
• If this holds, the uptrend can continue.
• If it breaks, price may revisit 117,340 or the white zone between 115,980 – 114,658.
⸻
5. Key Levels
• Supports: 118,150 · 117,340 · 115,980 · 114,658
• Resistances: 119,848 · 122,326
⸻
6. Trading Bias
• Bullish above 118,150 → possible retest of 119,848 and 122,800.
• Bearish below 118,150 → correction towards 117,340 or lower.

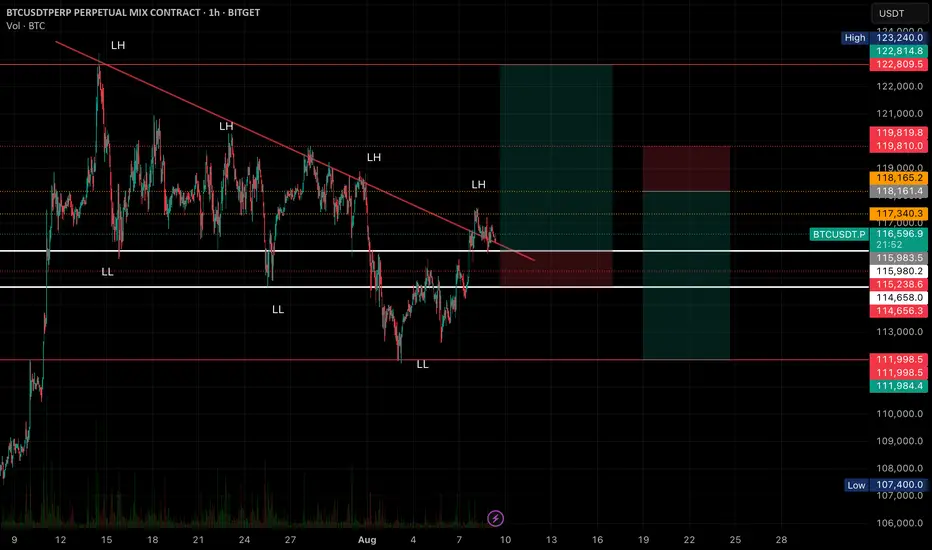
BTC 1H Time FrameBTC/USDT – 1H Analysis
Price has broken out of the descending trendline after forming a series of lower highs (LH) and lower lows (LL). The breakout was followed by strong bullish momentum, pushing price into the long trade zone.
• Breakout Confirmation: Price retested the breakout zone before continuing upward.
• Current Price Action: After reaching a local high near 122,800, BTC is in a minor pullback, retesting support around 118,150 – 118,190.
• Key Supports: 117,340 · 115,980 · 115,238 · 114,658
• Key Resistance: 119,848 · 122,326
• Bias: Bullish above 118,150; deeper correction possible if support fails, targeting 117,340 and lower white zone.
BTC - 12thAug2025 - 4th wave bottom and 5th wave TP - 1248004th wave has fallen more because 2nd wave was also bigger. 4th wave bottom is expected in the zone marked in green where we have W formed support and this area is vital to call the trend is in bull trend and no change of character untill this area holds. my wave count is in line with all analysts so far and if this support is broken then BTC is too much manipulation, This view is shared before important US data so stay cautious in money management. Its good level to buy BTC and hold at least 60% long as its a key technical support area and potential move to new ATH from here with out further down move.

BTC Weekly and Daily analysisOverall BTC Analysis – Weekly + Daily View
Trend: Strong bullish structure on both weekly and daily.
Current Position: Price is sitting just below 118.5k–118.7k, a heavy resistance/equal highs zone with big buy-side liquidity.
Weekly View:
Major demand/support at 110.5k–111.8k (unmitigated OB + FVG).
Market likely to remain bullish unless we close below 109.6k.
Space above 118.7k for continuation if highs break.
Daily View:
Short-term demand at 115.5k–116.0k (last bullish base before recent push).
Small imbalance in this zone could attract a retest before any breakout.
Liquidity Picture:
Buy-side liquidity: Above 118.7k → could trigger strong upside if taken.
Sell-side liquidity: Below 116k → could be swept in a pullback.
Overall Bias: Bullish trend intact, but we’re at premium pricing and near resistance.
Healthy pullback into 115.5k–116k (daily) or deeper into 110.5k–111.8k (weekly) would strengthen the next leg up.
Bitcoin Long idea:On the post previously as i was longed CRYPTOCAP:BTC since 115K$ and i think i will take partial profits @ 120500$ and next area will be New ATH
I think we are going up anyways to New ATH in bitcoin, But there is one scenario which i think is pretty much suitable for the market, we reach 120500 and market dump and we enter the consolidation period for CRYPTOCAP:BTC i.e. 111k$-120K$ area so i am bullish currently which is correct and will be bullish in every bullish dump we get, but i will build any big position keeping this range in mind if get
BASIC UNDERSTANDING-
I will look for a dump from 120500$ and i think we are going to be in the HTF choppy trend and if its gonna be true i will be longing that dip
BTC SHORTTrade Plan:
Price is expected to extend towards the 117,800 resistance zone. Upon reaching this level, monitor for signs of exhaustion. A 15-minute bearish rejection candle will serve as confirmation for a potential reversal entry. Maintain patience and allow the candle to close before initiating any short positions.
Key Levels:
Resistance: 117,800
Confirmation: 15-minute rejection candle close
Bias: Short after confirmation
Note: Avoid premature entries; confirmation is critical to minimize false signals.

Bitcoin is at Edge This is a very rare Pattern where it gives an option to Open Hedge Positions.
Upper Trend line is The Strong Resistance so we may se a small correction in price. ( 2% to 3% )

$BTC 15Mins Chart AnalysisCRYPTOCAP:BTC 15Mins Chart Analysis
Bitcoin has formed a Double Top pattern on the 15-minute timeframe at 117,000, signaling possible short-term exhaustion.
🔹Double Tops often indicate a potential pullback if the neckline is broken — here, the key neckline support sits around 116,350.
🔹Price is consolidating between 116,350 – 116,800 after the second top.
🔹A break above 117,000 could invalidate the pattern and invite bullish momentum.
🔹A drop below 116,350 may open the way toward 115,800 – 115,500.
🔹Bulls need to reclaim 117K+ quickly to avoid deeper correction.
🔹Bears will eye the neckline for confirmation.
BINANCE:BTCUSDT

BTCUSDT – 1H Chart Analysis📊 BTCUSDT – 1H Chart Analysis
Current Structure
• Market has been in a downtrend with a sequence of Lower Highs (LH) and Lower Lows (LL).
• Price recently broke above the descending trendline and is now testing it for support.
• Key horizontal levels marked in white and red provide both breakout and rejection opportunities.
⸻
📈 Bullish Scenario (Breakout Confirmation)
• Trigger: If price holds above 116,000 – 116,200 and closes 1H above trendline.
• Entry Zone: 116,500 – 116,800 (post retest confirmation)
• Targets:
• TP1: 117,340 (immediate resistance)
• TP2: 118,165 (strong supply zone)
• Extended: 119,810 – 122,800 (major liquidity zone)
• Stop Loss: Below 115,980 (trendline break + support fail)
⸻
📉 Bearish Scenario (Rejection & Breakdown)
• Trigger: If price fails to hold above the trendline and breaks below 115,980.
• Entry Zone: 115,800 – 115,500 (after breakdown retest)
• Targets:
• TP1: 115,238 (previous demand)
• TP2: 114,656 (strong support)
• Extended: 112,000 – 111,984 (major demand)
• Stop Loss: Above 116,700 (fakeout invalidation)
⸻
💡 Summary:
• Bulls need a clean hold above the trendline to reverse the downtrend structure.
• Bears regain control if support breaks and price returns inside the descending channel.
• Watch volume closely — a breakout with weak volume may lead to a fakeout.
BTCUSDT – pressure building before the breakoutMarket context:
US trade policy eases restrictions for certain major tech companies → risk appetite improves.
Expectations of a more dovish Fed → capital flows return to the crypto market.
Sentiment & flows:
Short-term Bitcoin holdings increase by around 20 billion USD → trading activity is heating up, but profit-taking pressure is also building.
Investors are closely watching the 116,000 USDT level before adding aggressive long positions.
8H technicals:
Support: 112,600 USDT – a zone that has repeatedly triggered rebounds, maintaining the bullish structure.
Resistance: 116,000 USDT – the “gate” that could open the way to 123,000 USDT.
Bullish scenario remains favored if price closes above 116,000 USDT with confirming volume.
Key takeaway:
The market feels like it’s “winding the spring” – tight consolidation before a potential breakout.
A break below 112,600 USDT would invalidate the short-term bullish view and increase the risk of a deeper pullback.

[SeoVereign] BITCOIN BEARISH Outlook – August 10, 2025In the August 10th idea I’m sharing today, I would like to focus on the bearish perspective.
As a swing trader, I am not particularly tied to the major trend, but I believe that this decline is meaningful enough within the short time frame, and I would like to share this perspective with you.
The main bases used in this idea are as follows:
-Harmonic 1.902 Crab Pattern
-Traditional ratio relationships in Elliott Wave Theory (1.618)
-Full Fibonacci 0.618 retracement
Based on this, I have set the average target price at approximately 114,500 USDT.
As time goes by, I plan to add more specific drawings to support this idea so that you can understand it more easily, and if the target price is reached, I will also share the entry price and take-profit price for your reference.
Thank you very much for reading,
and I sincerely wish you an overwhelming amount of strong luck.
Thank you.

Bitcoin targets $133,000 with institutional capital inflowsBitcoin is currently trading in an upward channel, forming higher highs and higher lows, indicating a strong bullish trend.
Capital inflows from major financial institutions like JPMorgan and Citigroup are increasing into BTC, combined with expectations that the Fed will cut interest rates in September, providing positive momentum for the price. The Trump administration's cryptocurrency policies and Syz Capital reopening its BTC Alpha fund with 2,000 BTC have driven strong participation from institutional investors.
Technically, BTC has bounced off the support at $112,816 and could continue toward the resistance at $119,249. A break above this level could set the next target at $133,000 by the end of 2025. Investors should carefully monitor signals and manage risk accordingly.

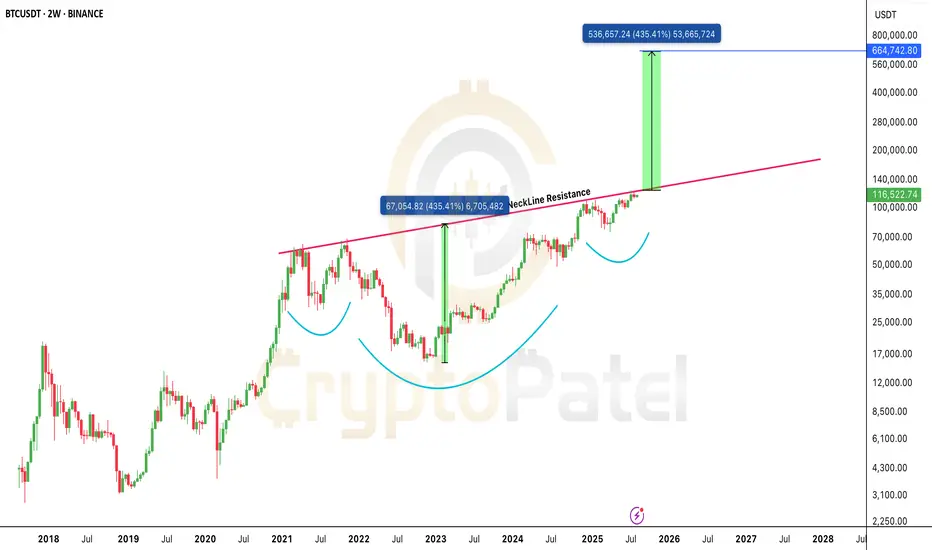
Bitcoin’s $664K Target Is Not a Joke: It’s a Chart-Based WarBitcoin is forming a massive macro structure and the neckline is the final barrier.
Break above it, and the technical target stretches to $664,000.
Yes, you read that right.
This isn’t hopium. It’s based on measured move projections from the breakout zone.
The only question now:
Does BTC explode to $664K this cycle… or in the next?
One breakout changes everything.
Watch the neckline. Stay focused.
Note: NFa & DYOR
BTCUSDT Buy View
BTCUSDT showing bullish momentum. Expecting upside movement towards the target of 115,242 in the coming sessions

BTCUSDT facing resistance near recent highs - Short viewBTCUSDT losing bullish steam near resistance zone.
Selling pressure building up – signs of trend reversal visible.
🔻 Short Setup Activated
🎯 Target: 114,499 USDT

BTCUSDT – Institutional Money Returns, Signs of a Strong ReboundBitcoin is showing positive recovery signals as major capital flows are re-entering the market. Notably, Syz Capital has successfully raised $200 million to invest in BTC – a strong indicator of growing long-term confidence from institutional investors.
On the H8 chart, BTC remains in a downtrend channel but is forming an accumulation pattern around the 111,000 USDT support area. Previous FVG zones have been filled, suggesting buying pressure is absorbing supply well. Volume is also slightly increasing at the lows – indicating selling pressure is weakening.
If BTC holds above 111,000, a move toward 117,500 is likely, with potential to reach 120,000 if it breaks above the descending channel. This would confirm a clearer medium-term uptrend.

BTC Short Below: $113,500 SL: Above: $116,000 Target Levels (Take-Profit Zones):
🎯 TP1: $112,000
🎯 TP2: $110,000
🎯 TP3: $108,000
Consider partial profit-taking at each level and trailing stop to secure gains.
This setup aims to capitalize on potential bearish continuation following a breakdown below the $113,500 support zone. A 15-minute candle close below this key level would indicate weakening buyer interest and a shift in momentum. With proper confirmation, this setup offers a clean risk-to-reward ratio.
💡 Never enter on anticipation — wait for the 15m close. Manage your position sizing based on your capital and risk appetite. Don’t just trade to win, trade to last. 😎

BTC long planThis order I am playing in my Main account And this is safe order who wants safe side play

Bitcoin at Risk: $115.7K Is the Line Between Bounce or BreakdownBitcoin at Risk: $115.7K Is the Line Between Bounce or Breakdown
CRYPTOCAP:BTC is trading below key resistance ($115.7K–$118.9K) and rejected cleanly at the trendline.
As long as price holds below $115,700, bearish bias remains.
⚠️ Failure to reclaim = high risk of breakdown toward $107K and even sub-$100K levels.
Bearish invalidation only above $119K
NFA & DYOR