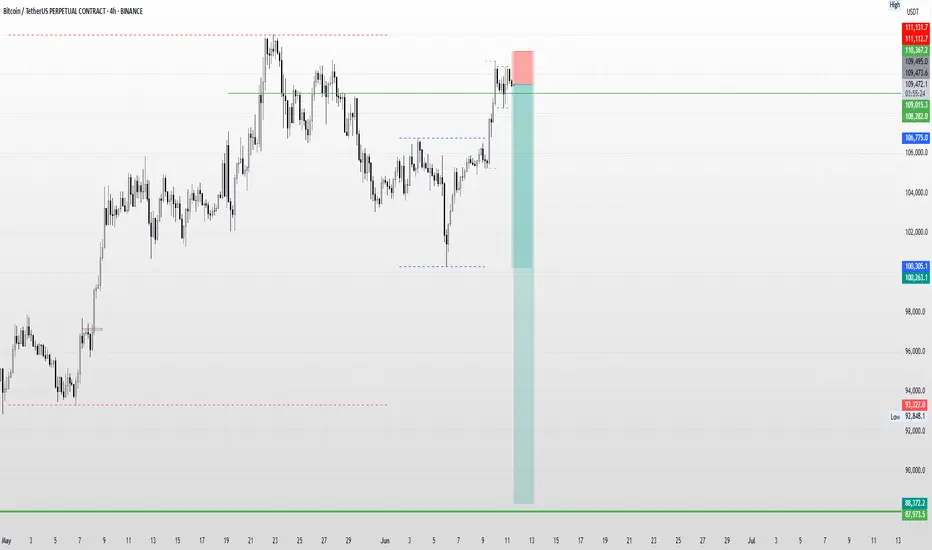
Danger Ahead? Bearish Signal Spotted on the Daily Timeframe!Price Action Analysis (Daily & Intraday)
A bearish pattern has formed on the Daily Timeframe, and early signs of execution are visible on the 1-hour chart, indicating a potential Double Top formation. If confirmed, the price may drop with an initial target around 100263. Should the bearish momentum continue, the next significant weekly support could be tested near 88372.
Caution:
This setup is considered risky, primarily because the higher timeframe (Monthly) still shows an overall uptrend. However, with a well-defined stop-loss above 16367 and proper risk management, the trade could offer a favorable risk-to-reward ratio.
Disclaimer:
Trading, especially in futures and options, involves a high degree of risk. Losses can exceed capital if not managed properly. This is not financial advice. Please do your own analysis or consult a certified financial advisor before making any investment decisions.
Trade ideas
Long $BTC above $107000, Target $109500, $11900 and 19500 Long CRYPTOCAP:BTC above $107000, Target $109500, $11900 and 19500.
CRYPTOCAP:BTC has changed direction in Swing trade above $107000. Add between $107000-$108000. Target $109500, $11900 and $19500. Stoploss $105000.

BTCUSDT – Strong rebound, waiting to break previous highsBitcoin is maintaining a fairly positive uptrend after bouncing from the support zone around 105,245 USDT – a confluence area of the EMA89 and previous lows on the 8H chart. Currently, the price has approached the key resistance area between 110,192 and 111,931, which has previously rejected bullish attempts twice.
Price action suggests that BTC may temporarily pull back to gather momentum before continuing to test the green resistance zone around 113,331. A short-term accumulation pattern is forming with a higher-low structure – a good sign for buyers as long as the price holds above the 106,000 area.
On the news front, investor sentiment has improved following weaker U.S. jobs data, reinforcing expectations that the Fed may cut interest rates sooner. This has prompted a return of safe-haven flows to the crypto market, adding fuel to BTC’s upward momentum.

Inverse Head and Shoulders Breakout Signals Bullish The chart under review presents a classic Inverse Head and Shoulders pattern, a reliable and widely recognized bullish reversal formation in technical analysis. This structure typically forms after a downtrend, indicating a potential shift in market sentiment from bearish to bullish.
The pattern is composed of:
Left Shoulder: A modest price decline followed by a temporary upward correction.
Head: A deeper price decline forming the lowest point in the pattern.
Right Shoulder: A higher low that mirrors the left shoulder, followed by another upward movement.
The neckline, which acts as a critical resistance level, is clearly illustrated at approximately 106,840.37 USDT. A confirmed breakout above this neckline suggests the completion of the reversal pattern and validates the potential for a sustained bullish movement.
---
2. Breakout Confirmation
The current price action confirms a successful breakout above the neckline, with the market currently trading around 107,586.58 USDT. This breakout is a key signal for bullish continuation, provided it is supported by increased volume and follow-through price action.
From a technical standpoint, the breakout is reinforced by:
A clean violation of neckline resistance
Price consolidation near breakout zone before a strong upward thrust
Higher lows preceding the breakout, indicative of growing buying pressure
This confluence of technical signals strengthens the case for an upward price trajectory in the near term.
3. Projected Price Targets
Upon confirmation of the Inverse Head and Shoulders breakout, target levels can be derived using the measured move technique. This involves projecting the vertical distance from the head to the neckline upward from the breakout point.
Target 1 (Initial Resistance):
108,878.29 USDT – This level represents a potential short-term resistance where price may consolidate or retrace slightly before continuing.
Target 2 (Measured Move Completion):
110,752.24 USDT – This is the ultimate price target derived from the height of the head-to-neckline structure. Reaching this level would represent the full realization of the reversal patt
4. Key Support and Risk Levels
Risk management is a critical component of any trading strategy. The following support levels should be closely monitored:
106,840.37 USDT (Neckline Support):
Former resistance turned support. Holding above this level post-breakout is essential for sustaining bullish momentum.
105,997.09 USDT:
Acts as a secondary support level and potential stop-loss region for conservative traders.
If price fails to hold above the neckline and falls back below these levels, the breakout could be classified as a false breakout, warranting caution.
5. Strategic Implications for Traders
This setup provides a favorable risk-to-reward ratio for long entries, particularly for traders seeking to capitalize on momentum-based patterns. An optimal trading approach could involve:
Entry: Near the neckline breakout or on a minor retest of 106,840.37 USDT
Stop-Loss: Below 105,997.09 USDT or under the right shoulder to account for volatility
Take-Profit Zones: Partial profits near 108,878.29 USDT, with final target at 110,752.24 USDT
6. Final Remarks
This chart illustrates a textbook example of a bullish reversal pattern in play. While the technical outlook is favorable, traders should remain cautious of potential invalidation scenarios, especially in highly volatile or news-driven markets. Confirmation through volume analysis and supportive macro/fundamental conditions can further enhance confidence in the bullish thesis.
Overall, the current setup indicates a well-structured opportunity for upward price movement, with a clearly defined entry, risk, and reward framework.
Let me know if you'd like this tailored for a trading journal, client report, or automated strategy setup.

BTC Daily Bias – Bullish – 10 June 2025 (PDH + PMH Liquidity)📌 Notes:
This analysis is part of my daily bias posting. Use it as an educational reference only. Always manage risk properly.
🧠 Market Overview:
Today, my bias on Bitcoin (BTC) is bullish, with a focus on liquidity resting above the Previous Day High (PDH) and Previous Month High (PMH). Price is showing signs of strength and may aim to take out these highs before any significant reversal.
🕵️♂️ Intraday Bias:
– Session Focus: London & NY
– Liquidity Targets:
🔹 PDH: 110655.0
🔹 PMH: 120000
🎯 Trade Setup Plan:
– Ideal Entry: On retracement or after liquidity grab below LO
– SL: Below short-term swing low / demand
– TP1: PDH | TP2: PMH | Optional: Trail beyond
📌 Notes:
This is my directional bias based on Smart Money Concepts (SMC) and liquidity framework. Use for educational purposes and always follow your risk management rules.
—
Posted by
🎥 YouTube: Trading Pulse

Intraday Long Setup | June 9th 2025 | Valid Until Daily ClosePrice is retracing to a strong pivot zone (marked by the red box).
Structure remains bullish with potential for continuation after pullback.
The green box represents a high-probability long opportunity with tight risk control.
Watch for price reaction within the red zone. Entry only if confirmation (e.g., bullish engulfing, strong wick rejections) appears.
The setup expires at end of the daily candle close.
Bitcoin (BTC) Technical Analysis for the Week of Jue 10 -June 16~~ Technical Analysis ~~
- Trend: Bitcoin is in a bullish trend on higher time frames (3-day and above), forming higher highs and higher lows. However, short-term signals are mixed, with some indicators suggesting consolidation or a potential pullback.
4-Hour Chart: Bullish, with the 50-day moving average (MA) sloping up, but the 200-day MA is sloping down since December 27, 2024, indicating a weaker short-term trend.
Daily Chart: Bullish, with the 50-day MA rising and below the current price, potentially acting as support. The 200-day MA has been rising since June 5, 2025, signalling a strong long-term trend.
Weekly Chart: Bullish, with the 50-day MA below the price and the 200-day MA sloping up since July 9, 2024.
Monthly Chart : Bullish which has a potential to hit All Time High
# Support, resistance and Targets marked in the chart for your reference
-- Disclaimer --
This analysis is based on recent technical data and market sentiment from web sources. It is for informational purposes only and not financial advice. Trading involves high risks, and past performance does not guarantee future results. Always conduct your own research or consult a SEBI-registered advisor before trading.
#Boost and comment will be highly appreciated

BTC Daily Bias – Bullish – 9 June 2025📌 Notes:
This analysis is part of my daily bias posting. Use it as an educational reference only. Always manage risk properly.
Posted by Vicky
📺 YouTube: Trading Pulse

BITCOIN 1:19 RR trade with good potential tradeBITCOIN can Reverse or Breakout from this zone
ENTRY: sell at 107839
tp:93322
sl:108666

Btc about to break all time high After hitting 1,12,000 BTC has shown some weakness and give low of 1,00,370 however in 4H and 1D time frame we can see Bull flag patterns and as i said in previous post it has also created inverse head and shoulder pattern in Daily time frame (target of 1,50,000). And now created bullish flag in that head and shoulder (Target of 1,35,000).

Intraday Long Setup | June 8th 2025 | Valid Until Daily ClosePrice is retracing to a strong pivot zone (marked by the red box).
Structure remains bullish with potential for continuation after pullback.
The green box represents a high-probability long opportunity with tight risk control.
Watch for price reaction within the red zone. Entry only if confirmation (e.g., bullish engulfing, strong wick rejections) appears.
The setup expires at end of the daily candle close.

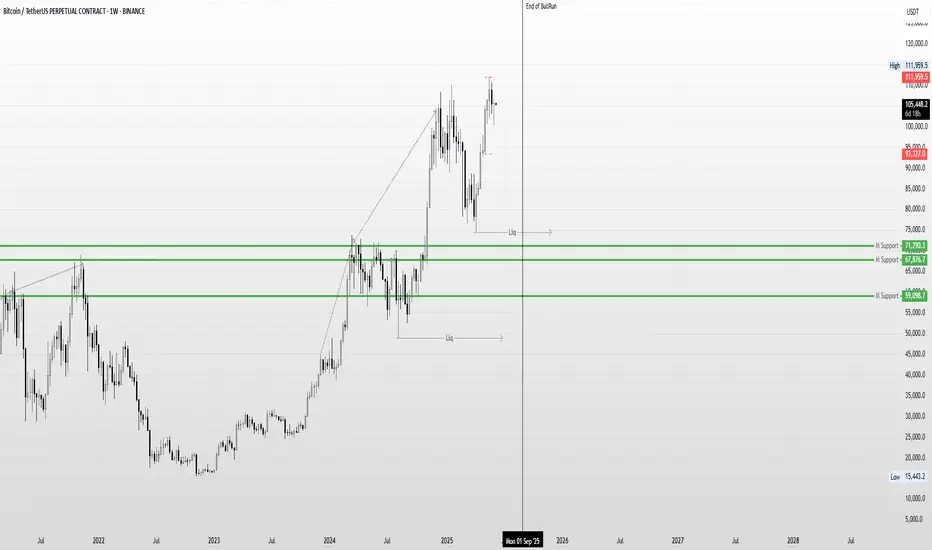
Bitcoin Weekly Analysis: Potential Exhaustion in Price ActionWhile Bitcoin continues to form Higher Highs on the Weekly Time Frame, the overall price action appears to be gradually losing momentum. From my perspective, this could be an early sign of exhaustion, suggesting that the current bullish trend may be nearing its end.
If this weakening momentum continues, there's a possibility that a broader correction or even the beginning of a bear market could unfold post-September. In such a scenario, the market may attempt to hunt significant downside liquidity levels, potentially targeting zones around $74,000 and even as low as $48,000.
Of course, this is purely a personal prediction based on current price structure and market behavior. Only time will reveal how accurate this outlook turns out to be.
Disclaimer :
This content is for informational and educational purposes only and does not constitute financial or investment advice. The views expressed are based on personal analysis and should not be considered as a recommendation to buy, sell, or hold any asset. Cryptocurrency markets are highly volatile, and past performance is not indicative of future results. Always do your own research (DYOR) and consult with a licensed financial advisor before making any investment decisions.
BITCOIN Short Position Update – June 9, 2025We are the SeoVereign Trading Team.
With sharp insight and precise analysis, we regularly share trading ideas on Bitcoin and other major assets—always guided by structure, sentiment, and momentum.
🔔 Follow us to never miss a market update.
--------------------------------------------------------------------------------------------------------
Bitcoin (BTC) Short Position Strategy
Position Basis: Expected decline after touching the upper diagonal trendline, with additional confirmation from the Deep Crab pattern
1st Target: 104,936
Analysis Summary:
Currently, BTC is likely to face selling pressure after touching the upper trendline of the ascending diagonal pattern. In addition, the formation of the Deep Crab pattern, one of the harmonic patterns, further strengthens the technical basis for a bearish reversal.
The targets are set based on key support zones, and a partial take-profit strategy may be effective depending on market conditions. Setting a stop-loss to prepare for pattern invalidation and sudden rebounds is an essential element of risk management.

BTC Daily Bias – Bearish – 6 June 2025📌 Notes:
This analysis is part of my daily bias posting. Use it as an educational reference only. Always manage risk properly.
Posted by Vicky
📺 YouTube: Trading Pulse
SHORT NEAR RESISTANCEafter getting my SL twice, I can see another rejection from a resistance on 4H where candle look like an inverted hammer but there's still ~2H left for the candle to close, looks like this is the reversal from major resistance level
Entry : $105,960
SL : $106,330
Max RPT : $5
R:R to be captured : 1:5
Planned TP : $104,020

BTC Just Chose Its Side - The Silent Confirmation....The structure has shifted.
Price didn’t shout — it whispered.
It crossed the threshold silently… a confirmation only visible to those who understand structure without indicators, without noise.
This isn't a pump.
It's alignment.
The mark I’ve drawn is not support — it’s the echo of decision.
A place where buyers proved their intent without needing volume to scream.
Now, above that line — the bias is bullish.
Not because of emotion, not because of hope —
but because price has shown commitment.
If it returns and breaks beneath that origin point...
the bullish script vanishes.
The structure flips — cold, clean, without apology.
This is not a prediction.
This is structure unfolding.
And I’m not reacting.
I’m witnessing what I already knew.
BTC is playing a script.
And Leviathan saw the outline long before the market made its first move.
#LeviathanFX #StructureSpeaks #MarketWhispers #PriceKnowsFirst #ScriptedMoves #LiquidityLogic #TradingProphecy #SilentConfirmation #DecodeTheMarket #TheChartNeverLies #BTCUSD #BitcoinTA #SmartMoneyConcepts #MarketStructure #PriceActionTrader #4HChart #SupplyAndDemandZones #TechnicalFlow #OrderFlowMindset #HighProbabilitySetups

BTCUSDT | Weekly Analysis June 9-13 2025Hi,
I am sharing my view on BTC further upside movement if sustatined above 107391 then next will be 109501 and 111429.
Disclaimer: This is only for educational purpose.
Thanks

BTC Daily Bias – Bearish – 8 June 2025 (Target: 106000)🧠 Market Overview:
Today’s bias on Bitcoin (BTC) is Bullish. I’m expecting a move towards the previous day's High at 106000, targeting liquidity beneath that level.
🎯 Trade Setup Plan:
– Entry: After liquidity grab / SMC confirmation near
– SL: Above recent swing Low
– TP: 100305 and possibly lower if momentum continues
📌 Notes:
This analysis is part of my daily bias posting. Use it as an educational reference only. Always manage risk properly.
Posted by Vicky | Trading Pulse
📺 YouTube: Trading Pulse

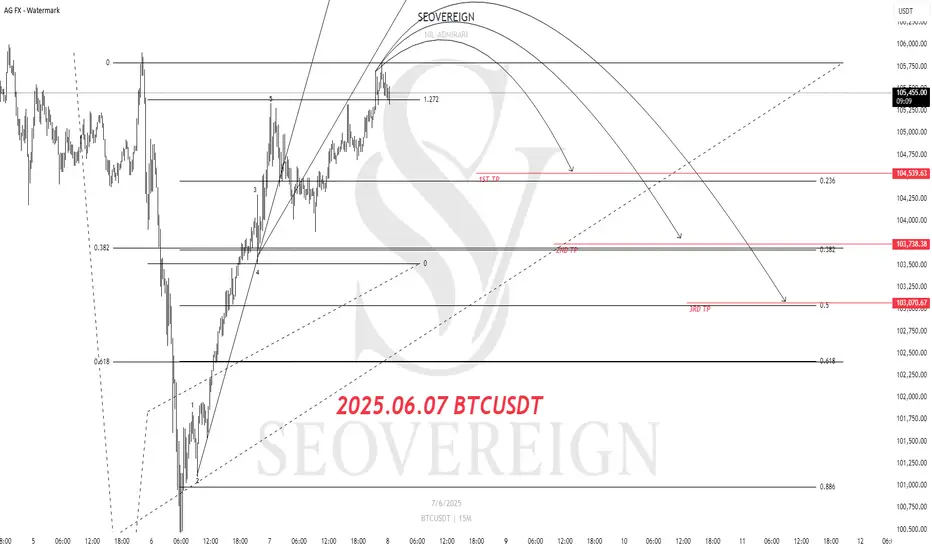
Bitcoin Short Position Update – June 7, 2025We are the SeoVereign Trading Team.
With sharp insight and precise analysis, we regularly share trading ideas on Bitcoin and other major assets—always guided by structure, sentiment, and momentum.
🔔 Follow us to never miss a market update.
--------------------------------------------------------------------------------------------------------
Bitcoin Analysis
After a prolonged downtrend, Bitcoin is attempting a temporary rebound in the form of a dead cat bounce. This current upward move appears to be more of a technical rebound within the broader downtrend rather than a strong trend reversal.
From an Elliott Wave structure perspective, the current rebound is being captured as an impulsive wave, which suggests it could either be the final leg of a 5-wave move or the movement just before a corrective phase begins. Based on this view, I am considering entering a short position by targeting the point at which the upward momentum starts to exhaust.
Wave Ratio:
The length of the current 5th wave is approaching 1.618 times the length of the 1st wave, a ratio often observed in overextended wave patterns.
Target Price:
The initial target is set at 104,500, which coincides with the retracement zone of the previous decline and the prior support level.
The current area is considered favorable for a short entry in terms of risk-reward ratio. However, it is crucial to confirm whether the upward wave has truly concluded.
With overbought signals from oscillators and the appearance of a trend-reversal candlestick pattern, a short entry can be considered upon confirmation.
BTC Breaks Downtrend – Eyes on 105911📊 Cycle Status:
🔼 HWC: Bullish
🔽 MWC: Bearish
🔼 LWC: Bullish
Because of this cycle configuration, I’m not looking for short positions. The larger structure still favors bullish momentum.
📈 Structure & Channel Breakout:
BTC broke out from a descending channel with 6 confirmed touches. On the 7th touch, we saw a breakout.
You might ask: "Parsa, what’s the use of a broken channel now?"
Well, here’s why it still matters:
The channel hasn't had a proper pullback yet.
Price might reject from the 10,5911 resistance, which is a strong level.
If rejected, price could revisit the channel’s upper boundary as a retest.
That retest could create a strong R setup on the 15m chart — if we get a clear structure and confirmation.
🧠 Important Notes:
If BTC breaks and holds above 10,5911, this could flip our MWC to bullish, which would be a strong continuation signal.
Until then, I’m waiting and watching for either:
Retest of the broken channel
Clean break and hold above 10,5911
🎯 Targets:
If price holds above current levels, next resistances are:
✅ 108890
✅ 110490
As long as BTC stays above 103880, I won’t be talking about short setups.
📌 Got a coin in mind? Drop it in the comments and I’ll analyze it for you.
⚠️ Without proper risk management, you're just a ticking time bomb.

BTC: Saturday Range Play - Targeting PDH Liquidity & Downside CoGood morning/afternoon, traders!
My daily bias for Bitcoin today (Saturday) is cautiously bearish, anticipating a potential range-bound day with a downside lean.
Here's the rationale:
Weekend Dynamics: With lower trading volume typically seen on Saturdays, I expect a relatively tighter daily range (1.5-2%).
PDH Liquidity Grab: My primary scenario involves BTC potentially making a move towards the Previous Day's High (PDH) to sweep liquidity.
Downside Confluence: After interacting with PDH (either a liquidity sweep or a clear rejection from a reactive area near PDH), I'll be looking for bearish confirmations on lower timeframes to plan entries for a move to the downside.
Key Levels to Watch:
Previous Day's High (PDH): 105283
Previous Day's Low (PDL): 101003
My Plan:
I'll be patiently waiting for price action around the PDH. A strong rejection, market structure shift on lower timeframes, or confirmation from a supply zone will signal potential short opportunities, targeting the day's lower range.
Invalidation: A strong, sustained break and close above PDH without any bearish follow-through would challenge this bias.
Remember to always practice sound risk management.
This is my personal analysis and not financial advice. Do your own research.
ALERT: BTC TRAPPING SELLERSBTC can trap sellers before going to original sell. Here psychology is more important.Trail after entry to ctc let it run huge.
sell 1:105600
sell 2:107000
BUY 1:107400

BTC Daily Bias – Bearish – 6 June 2025 (Target: 100305)🧠 Market Overview:
Today’s bias on Bitcoin (BTC) is bearish. I’m expecting a move towards the previous day's low at 100305, targeting liquidity beneath that level.
🎯 Trade Setup Plan:
– Entry: After liquidity grab / SMC confirmation near 103000
– SL: Above recent swing high
– TP: 100305 and possibly lower if momentum continues
📌 Notes:
This analysis is part of my daily bias posting. Use it as an educational reference only. Always manage risk properly.
Posted by Vicky | Trading Pulse
📺 YouTube: Trading Pulse
