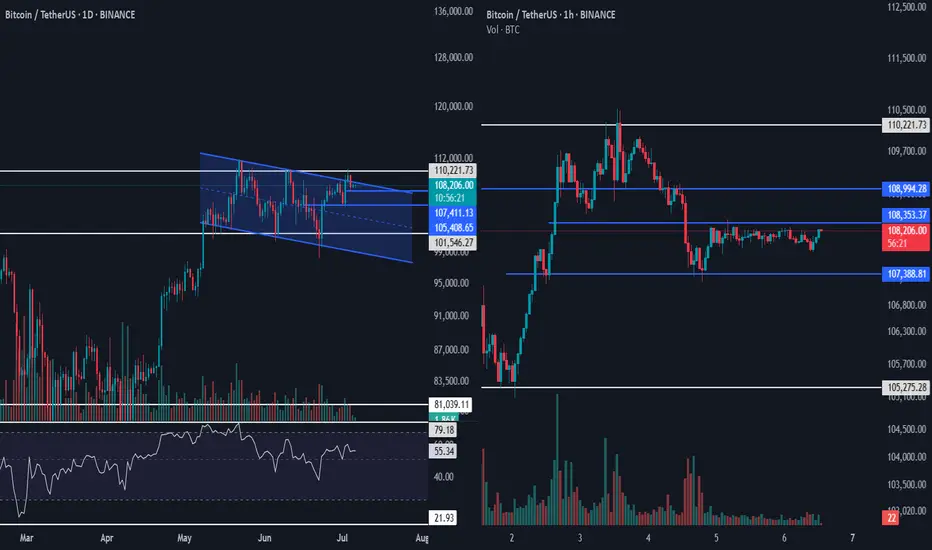
Bitcoin Price Update – Key Levels in Daily & 1H Charts for StratOn the right side of the image, we have the daily chart of BTC, and on the left, the 1-hour chart. Let’s first break down the current price action in the daily timeframe:
📉 Daily Timeframe (BTCUSDT)
We can currently interpret the market in two ways:
As part of a descending channel
Or as a range-bound movement between $110,221.73 (resistance) and $101,546.27 (support)
If we consider the descending channel, it’s important to note that the upper trendline has not been broken yet. If price fails to decisively move above $110,221.73 by tomorrow—or worse, gives a fake breakout and rejects—this would confirm a channel rejection, and we could expect price to move back toward the midline or even the lower boundary of the channel.
📌 Keep in mind: The broader trend is still bullish, but this analysis focuses on the current short-term structure.
🔹 Long trigger: A confirmed breakout above $110,221.73
🔻 Short trigger: A breakdown below $105,408.65
🕐 1-Hour Timeframe (BTCUSDT)
The 1H chart allows for more precise and early entries, from both directions.
A short-term profit target could be set around $108,353.37, assuming price moves up.
However, before that, we need to watch for a failure swing or fakeout near $107,388.81 — this is crucial for determining the validity of any bullish setups.
📌 We need confirmation that buyers are still active before entering longs.
For short positions:
Since price already rejected from $110,221.73 and is now consolidating in a range, a valid short trigger could also be $107,388.81, especially if we see a minor rally and failure to break above it.
For better risk/reward, it would be ideal to see price bounce slightly above the support, then form a lower high below $108,353.37, giving us a tighter stop-loss and potentially RR > 2.
🧠 Important Note: Since shorting goes against the overall bullish trend, any short positions should be taken with reduced risk, tighter stops, and strict risk management.
#Bitcoin #BTCUSDT #CryptoTrading #TechnicalAnalysis #TradingView #BTCAnalysis #CryptoStrategy #CryptoTA #PriceAction
Trade ideas
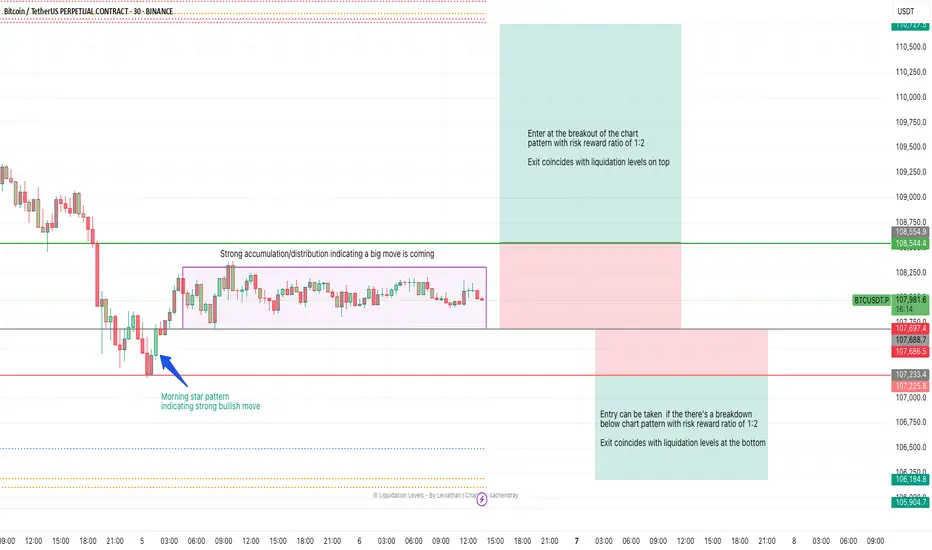
BTCUSDT – Accumulation Breakout Setup (30-min Chart)This setup highlights a potential breakout trade on the BTCUSDT perpetual contract, based on clear price action and chart patterns:
• Morning Star Pattern: A strong bullish reversal signal formed at the recent low, suggesting the possibility of an upward move.
• Accumulation/Distribution Zone: Price has consolidated within a well-defined range, indicating accumulation or distribution and foreshadowing a significant move.
Breakout Entry:
• Long Position: Enter on a confirmed breakout above the range, targeting a minimum risk-reward ratio of 1:2. The exit aligns with the upper liquidation levels.
• Short Position: Enter if price breaks down below the range, also with a 1:2 risk-reward ratio. The exit coincides with the lower liquidation levels.
Key Levels:
• Long Trigger: Break above 108,544.4 USDT.
• Short Trigger: Break below 107,233.4 USDT.
Risk Management : Both entries are structured with clear stop-loss and take-profit levels, ensuring disciplined trade management.
This setup is ideal for traders watching for volatility expansion after a period of sideways price action, with well-defined risk and reward parameters.
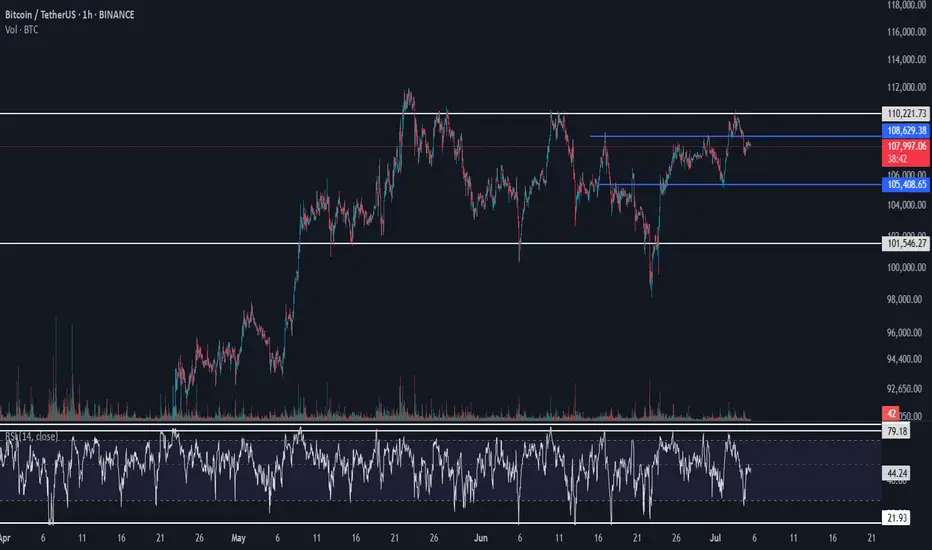
Bitcoin (BTCUSDT) Weekend 4H Analysis – RSI Fakeouts, VolumeToday is Saturday, and with global markets closed, volume across the crypto space is expected to remain limited. As a result, we shift our focus to the 4-hour timeframe, where more actionable signals may appear.
🔸 Key 4H Observations:
The latest pullback was accompanied by rising volume, which is notable — however, it's not yet sufficient for me to open a short position, as it lacks a full confirmation.
We are closely watching the support at 105408.65, which could provide a low-risk opportunity to test a long position if respected.
🔸 Important RSI Signal:
In uptrends, when RSI briefly dips below the 30 zone and quickly recovers, it often acts as a bullish fakeout — and that's exactly what we saw recently.
After this RSI fakeout, BTC bounced off the support near 105408.65 and surged toward 110221.73 — further validating that support.
This retest of 105408.65 will be critical. If price reacts again at that level, I’ll consider two possible strategies:
A low-risk short if we see a rejection with confirmation.
An early-entry long if price fakes below the level and recovers with strength.
⚠️ Weekend Trading Tip:
Since it’s the weekend, liquidity is thinner — make sure to adjust your risk accordingly. Keep in mind:
Primary long entry remains above 110221.73 (the confirmed breakout zone).
Risky short consideration is only valid around 105408.65 and must be supported by volume and structure.
✅ Capital Management Reminder:
Whether you're trading potential fakeouts or preparing for breakout setups, be disciplined with your capital. Weekend volatility can give false signals — stay patient and wait for confirmation.
#BTCUSDT #BitcoinAnalysis #CryptoTrading #4HChart #RSIStrategy #FakeoutSetup #WeekendTrading #CryptoVolume #TechnicalBreakout #TradingViewCrypto
Update BTC 5/7Bitcoin I wait to sell at the high price zone and take profit at the price zone below these two zones when the price has broken through and returned to test the price we expect at the price to reach profit.

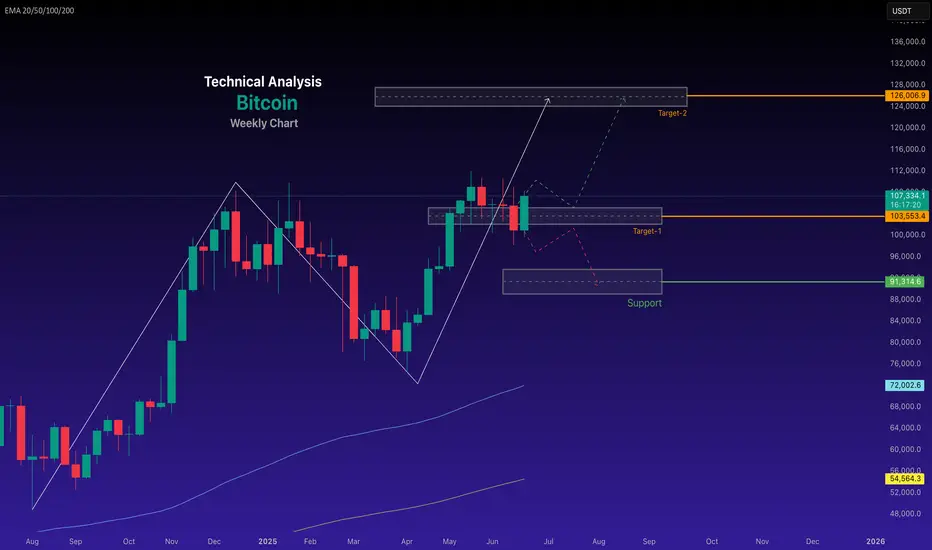
BTC - new ATH will happenIn the month of April, I clearly pointed out BTC will take support and will move upside only and all news are favorable for up move. In less than 3 months we are seeing the expected up move. From July first week I am expecting BTC to make new ATH and T1 is near 118K and T2 is around 130K and BTC could even see 145 K easily in this year 2025. All the news coming from US are only indicating higher levels for BTC. Avoid all other Alt coins and stay long in BTC for few more weeks to see the biggest profits in 2025.

BTCUSDT Update – Testing Major Resistance | Volume Insights & TSince yesterday, Bitcoin hasn’t made any significant moves, but it's now testing a critical resistance level at 110221.73, where price has started to pull back slightly.
🧭 Chart Context:
On the left side of the image, we observe the daily timeframe, and on the right side, the 1-hour chart gives us microstructure clarity.
On the 1H chart, we can clearly see that volume increased during the move toward resistance, and now, as price consolidates, volume is decreasing — a healthy sign of a bullish pause rather than a reversal.
While this detailed volume behavior isn’t visible on the daily chart, what we do notice there is that BTC has formed a higher high and higher low, making this pullback a natural and expected correction within an uptrend.
📌 What We Need Now:
As price revisits 110221.73, we need to see renewed volume and momentum on lower timeframes to confirm a valid long entry.
Remember: this zone is not just any resistance — it’s a key HWC (Higher Weekly Close) level that holds long-term significance.
So price action may look volatile on lower timeframes, but it's perfectly normal from a daily perspective.
🎯 Execution Plan:
Personally, I’ll be tracking this setup primarily on the 4H chart, and I’ll consider placing a wider stop-loss to accommodate potential whipsaws near resistance.
If my stop is hit, it will likely signal that we’ve entered a deeper correction phase, and I’ll then wait for a fresh long setup aligned with my strategy.
This mindset protects me from getting stopped out prematurely during normal pullbacks.
📉 No Short Setup for Now:
There is no compelling short scenario at this point. I’ll wait to see if the market delivers a clean rejection with a confirmed leg down before considering any short trades.
📈 Summary:
BTC is approaching a critical resistance zone with declining volume during pullback — a healthy sign. A breakout with rising volume will activate a long setup. Until then, it's all about waiting with structure, risk control, and patience.
#BTCUSDT #BitcoinUpdate #CryptoAnalysis #ResistanceTest #BreakoutSetup #HWCLevel #VolumeAnalysis #PriceAction #DailyChart #4HStrategy #TradingViewAnalysis #CryptoOutlook #RiskManagement

[SeoVereign] BITCOIN Bearish Outlook – June 29, 2025We are the SeoVereign Trading Team.
With sharp insight and precise analysis, we regularly share trading ideas on Bitcoin and other major assets—always guided by structure, sentiment, and momentum.
🔔 Follow us to never miss a market update.
🚀 Boosts provide strong motivation and drive to the SeoVereign team.
--------------------------------------------------------------------------------------------------------
Hello,
This is Seobeorin, approaching technical analysis not as a result but as a prediction, from a realistic perspective.
I am presenting a bearish view on Bitcoin as of June 29, 2025.
If you refer to the Ethereum idea from June 27, 2025, you can confirm that I presented a bearish perspective on Ethereum at the time. The basis for that perspective is still valid, and we are currently waiting for the take-profit level to be reached. The reason I selected Ethereum at the time was because I believed that the downward pressure on Ethereum was relatively stronger than that on Bitcoin.
However, based on today’s Elliott Wave count on the Bitcoin chart, I now judge that Bitcoin is also likely to experience some short-term downward pressure. Therefore, I am presenting a short position idea on Bitcoin.
The first take-profit target is set near $106,056. Depending on future price movements, this take-profit target may be narrowed or expanded. I will continue to track this idea, and as it develops, I will align the reasoning accordingly to organize the thought process more clearly.
Thank you.

$BTC Potential Opportunity$105,398.80 is a promising zone for the next potential long entry on $BTC.
If this level fails to hold, the next key area I'd be watching for a possible long opportunity is around $303,000.
This is not financial advice. Always trade at your own risk.

Bitcoin: Ready to Break Psychological Resistance?BTC is maintaining its bullish structure with strong rebounds from the trendline since April. The price is now approaching the psychological resistance zone at 119,000 – a level that has been rejected three times before.
If support at 104,700 holds and the resistance is broken, BTC could target the 125,000 area. On the other hand, losing this support could interrupt the bullish momentum.
Trade Setup:
Buy around 104,700–106,000
TP: 119,000
SL: below 103,000
Note:
The upcoming NFP report on July 5 may trigger sharp moves if strong data boosts the USD.
Do you expect a breakout or another rejection?

Bitcoin (BTCUSDT) Market OutlookBitcoin has lost the minor support level at 106083, marking a short-term weakness. However, I have not opened any short positions, since the primary trend on higher timeframes remains bullish. There is no strong reason yet to take aggressive short positions under current market conditions.
🔸 Key Observations:
Yesterday’s downward move was accompanied by rising volume — this could be an early warning of bearish continuation if volume keeps increasing.
If the price drops further toward 101546.27, and volume also expands, a low-risk short setup may emerge — but only against key confirmation signals.
🔸 Long Entry Zones:
First trigger level for long positions: 108746.08
Main breakout level for continuation: 110221.73
👉 Until one of these two levels is reached with momentum, it’s best to stay out of the market and avoid forced entries.
📦 Range Box Alert:
BTC is currently consolidating inside a clear box between 101546.27 and 110221.73.
The safest strategy here is to wait for a confirmed breakout above or below the box boundaries before engaging.
📈 Momentum + RSI Notes:
Daily RSI is sitting near the 50-level, which often acts as a balance zone. We might see a bounce or rejection soon.
Regardless, price remains directionless inside the range, so any trade must be backed by momentum + volume confirmation.
📌 Cautious Trader Tip:
If you’re looking for high-probability, low-risk setups, the best approach is to wait for a breakout from the box, then follow the trend in that direction — but only when supported by volume and structure.
#BTCUSDT #BitcoinUpdate #CryptoTechnicalAnalysis #BTCOutlook #BreakoutTrading #RangeStrategy #MomentumTrading #VolumeConfirmation #BitcoinForecast #TradingViewAnalysis

In Bitcoin we may see the small or about 25% correction in priceBitcoin may be heading toward a healthy correction in the coming days.
This is not any financial advice or tips. This is just a informative video and sharing my opinion on Bitcoin.

BITCOIN: Wait For The Drop! Fellow Traders,
Hope you are doing great, in our view bitcoin is likely to drop around 90k region. So Expect price to breakthrough the sellers pressure and then drop around 95k first and then 90k which will be a key level for swing buyers.
Thank you

BTCUSDT – Targeting 125,000 if Resistance BreaksBTCUSDT is holding a strong uptrend, with price respecting the ascending trendline and consistently filling fair value gaps. The pair is approaching key resistance around 110,000 and may form a breakout–retest pattern, potentially unlocking a move toward 125,000.
On the news front, institutional inflows are returning, spot ETFs continue to attract capital, and the Fed is keeping rates steady — all supporting bullish momentum. As long as price holds above 101,200, the upside scenario remains in play.

Bitcoin (BTCUSDT) UpdateBitcoin successfully broke above the resistance level at 108475.34, which served as our early entry trigger. If you entered long positions based on this breakout, you're currently in profit — and this position can still be held while we wait for a cleaner breakout through the main resistance at 110221.73 to open further long opportunities.
🔸 Key Observations:
Price has not yet confirmed a break above 110221.73, our major trigger.
If the price fails to reach this level and instead forms a lower high, it may signal potential downside or a local trend shift.
The market is currently in a wait-and-see phase — patience is key.
🔸 Momentum Indicator Watch:
Price is nearing the SMA 7, and its interaction with current candles could signal whether the bullish move will continue or weaken.
The High Wave Cycle (HWC) pattern will reactivate above 110221.73, strengthening bullish continuation probabilities.
📌 Cycle & Trend Context:
Both the Mid Wave Cycle (MWC) and Low Wave Cycle (LWC) remain bullish.
The Primary Trend is also upward, so long setups still offer more favorable risk-to-reward.
It’s acceptable to engage more aggressively in long positions under this structure, but shorting should be approached cautiously.
📉 Short Scenario Setup:
Only consider short positions if we see a fake breakout above 110221.73, or a new lower high below this key resistance, with proper rejection signals.
In that case, a low-risk short could be considered with tight stops.
⏰ Final Note:
Stick to the dominant trend. Until we see clear invalidation of the bullish structure, favoring long setups — especially after clean triggers — will likely provide more consistent results.
#BTCUSDT #BitcoinUpdate #CryptoAnalysis #TradingView #CryptoOutlook #BitcoinPrice #TechnicalAnalysis #BTCBreakout #SmartTrading

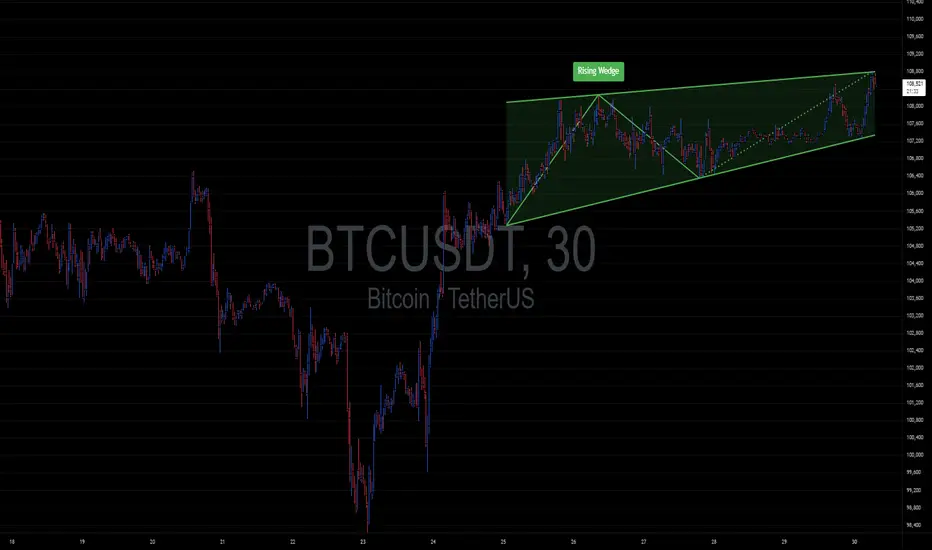
$BTC 30mins Chart Analysis
⚠️ Rising Wedge Formation Detected!
Bitcoin is currently moving within a clearly defined Rising Wedge—typically a bearish reversal pattern indicating possible exhaustion of upward momentum.
🔸 Upper Resistance Zone: ~$108,700 – $109,000
🔸 Lower Support Zone: ~$106,400 – $106,700
🟢 Bullish Scenario:
If price breaks upward decisively (high volume above $109K), it can invalidate the wedge and target $110K+.
🔴 Bearish Scenario (more likely):
If price loses the lower boundary (~$106.4K), expect accelerated selling pressure with potential downside targets near $105K–$104.5K.
Wait for clear breakout/breakdown confirmation before entering trades.
BTC PLAN TO SELLHtf in sell area and shift in market strcuture in lower time frame and also vsa confirmation

Bitcoin Technical Analysis for the Week of 29, June - 07, July
Here's a Bitcoin price analysis for June 29, 2025, based on available data and technical indicators from recent sources:
#Current Market Overview
Price: Bitcoin is trading around $107,331.08 as of June 28, 2025, with a slight 24-hour decrease of approximately 1.99%.
#Market Sentiment: The market shows a neutral to bullish sentiment. The Fear & Greed Index is at 65 (Greed), indicating optimism but not extreme euphoria. Technical indicators suggest a 67% bullish sentiment, with 25 bullish signals versus 5 bearish signals.
Trading Volume: 24-hour trading volume is around $43.1 billion, slightly below recent averages, suggesting cautious trading amid volatility.
~~ Technical Analysis ~~
Price Trends:
Bitcoin is currently testing support at the 20-day EMA ($106,211), with additional support at the 50-day EMA ($103,110) and 100-day EMA ($98,807). The 200-day EMA ($93,092) serves as a key macro support level.
The 50-day moving average is rising and remains above the 200-day moving average, forming a golden cross, a bullish indicator.
Bitcoin is within a descending triangle pattern, which could resolve by July 1, 2025. A breakout above $110,000 could signal a new bull run, while failure to hold $102,000–$104,000 may lead to a drop toward $95,000–$98,000. even to $90,000.
Key Levels:
Support: $100,000 (recently held), $98,000 (psychological), $95,000 (flag pattern lower border).
Resistance: $108,700 (recent high), $110,000 (key psychological level), $112,000 (all-time high from May 2025)
Trend Bullish - Chart for your reference
-- Disclaimer --
This analysis is based on recent technical data and market sentiment from web sources. It is for informational purposes only and not financial advice. Trading involves high risks, and past performance does not guarantee future results. Always conduct your own research or consult a SEBI-registered advisor before trading.
#Boost and comment will be highly appreciated
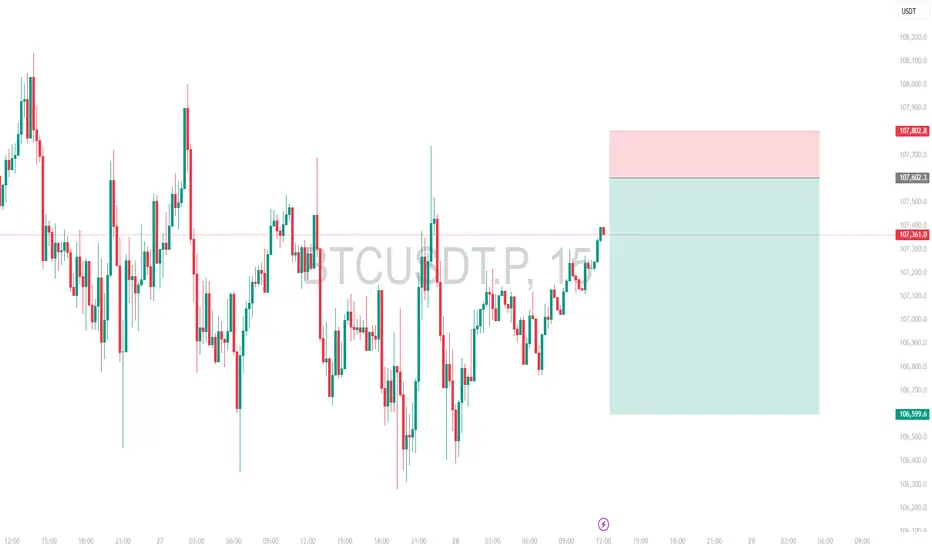
Intraday Short Setup | June 28th 2025 | Valid Until Daily ClosePrice has pushed into a potential intraday Pivot supply zone (red box) where sellers may step in. This trade is based on the expectation of a rejection from this area.
Entry: Red box — a short entry zone aligned with overhead supply
Stop Loss: Above the red zone (invalidates the setup)
Target: Green box — area to consider partial/full exit based on momentum
Risk-reward is favorable with a tight invalidation and clean downside target
Price may stall or reverse near the red box, creating short opportunity
Note:
This is an intraday trade idea that expires at 00:00 UTC (Daily Candle Close). Re-evaluate the setup if price remains indecisive near the entry zone close to that time.
BTCUSDT DAILY UPDATEAfter a strong bullish leg from the channel bottom support at 81,039, Bitcoin rallied to 110,221, where it entered a consolidation phase. The price is now ranging between 110,221.73 (resistance) and 101,819.47 (support), forming a sideways structure within a clear ascending channel.
🔍 Technical Overview:
This range has seen multiple touches on both support and resistance levels, which makes it possible to trade both sides (range trading setups). However, since the macro structure on the monthly and weekly charts remains bullish, short positions are not recommended unless very specific conditions are met.
📈 Key Insight:
We recently witnessed a fake breakout below 101,819.47, which was quickly absorbed by buyers, followed by a strong bullish volume spike. This indicates that demand is active, and the range is more likely to resolve to the upside.
✅ Long Setup:
Primary Long Trigger: A confirmed breakout above 110,221.73 is the main trigger for a larger move.
Early Entry (Aggressive): A breakout above 107,513.98 could offer an early entry, especially on lower timeframes like the 4H or 1H, with a tighter stop. This can be used to position early ahead of the 110K breakout, but proper risk management is critical here.
⚠️ Short Setup (Not Recommended but Possible):
If you insist on a short position, you must first see a lower high formation relative to 110,221 and strong rejection signals.
Only consider shorting below 101,819.47, and even then, prefer confirmation through a retest or pullback, as a fake breakdown is still a risk.
📌 Final Thought:
Bitcoin is consolidating within a bullish structure. As long as price stays above 101,819, the bias remains bullish. Prepare for upside continuation — but enter with structure, manage risk, and always align with the broader trend.
#BTC #BitcoinAnalysis #CryptoTrading #BTCUSDT #PriceAction #TradingView #CryptoTechnicalAnalysis #BitcoinPrice

BTCUSDT MONTHLY UPDATE 📈 Bitcoin (BTCUSDT) Monthly Outlook | Bullish Trend within High Wave Cycle Channel
As observed in the chart, Bitcoin is currently moving within a bullish high wave cycle (HWC), forming higher highs and higher lows inside an upward channel. Each touch of the lower channel boundary has resulted in a fresh bullish leg, with consolidation phases lasting around 6–7 candles, indicating a recognizable and repeating market behavior.
🔍 Market Structure & Key Resistance:
At the moment, price is testing both the midline of the channel and a key resistance zone around $107,234.25. A confirmed breakout above this level would act as a technical trigger for long positions, as it would suggest strong bullish continuation and increased momentum.
There are no signs of a bearish reversal at this point. The market structure remains firmly bullish, so there’s no edge in shorting against the trend unless clear reversal signals appear.
📉 Short Setup Scenarios (Only if Market Weakens):
A short position should only be considered under specific reversal conditions:
Price pulls back to $105,940.40, then bounces to form a lower high relative to the $107,270.72 resistance.
Look for a potential failure swing or double top pattern.
A breakdown below $105,940.40 could offer a risky short entry.
For higher confidence: wait for a clean break, followed by a pullback (retest) to confirm bearish momentum before entering a short.
📊 RSI Insight:
The RSI is currently flirting with the 70 level. If a daily candle closes above $107,270.73 and RSI crosses into overbought territory, it could trigger bullish acceleration. This would likely bring strong buying activity and sharp upward moves, potentially forming new monthly highs.
✅ Summary:
Trend: Bullish (High Wave Cycle)
Primary Long Trigger: Breakout above $107,234.25
No clear short signal unless reversal patterns form
Watch RSI and candle close above $107,270.73 for bullish confirmation
A break above this zone could activate a new phase of institutional participation
Stay focused and reactive. Let the market give you confirmation before entering aggressive trades. This breakout zone is key — once breached, expect sharp upside movement.
#BTCUSDT #BitcoinMonthlyAnalysis #CryptoOutlook #BitcoinBreakout #TechnicalAnalysis #BullishBitcoin #PriceAction #RSI #ChartPatterns
📅 June 28, 2025

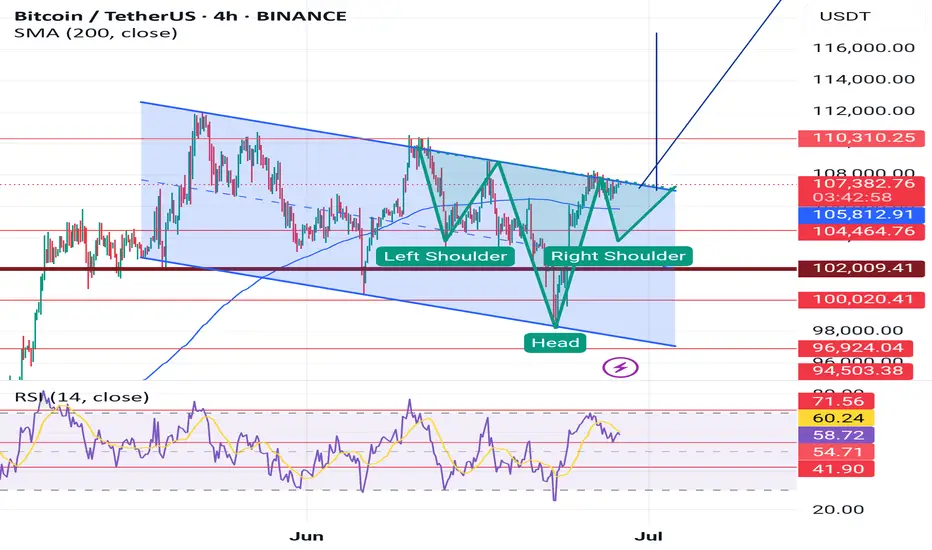
BTCUSDT creates another head and shoulder pattern BTC is creating inverse head and shoulder pattern in daily time frame as well as in 4H time frame, currently BTC is creating Bullish flag pattern in larger time frame and in that Bullish flag it's likely to create inverse head and shoulder pattern, however in both scenarios it's look Bullish with target of 1,17,000$ for inverse head and shoulder pattern, And 1,45,000$ for Bullish flag pattern, And in daily head and shoulder pattern target is 1,50,000$. It can come to retest 1,03,000$ to 1,04,000$ for LIQUIDITY purposes and to complete Right shoulder.
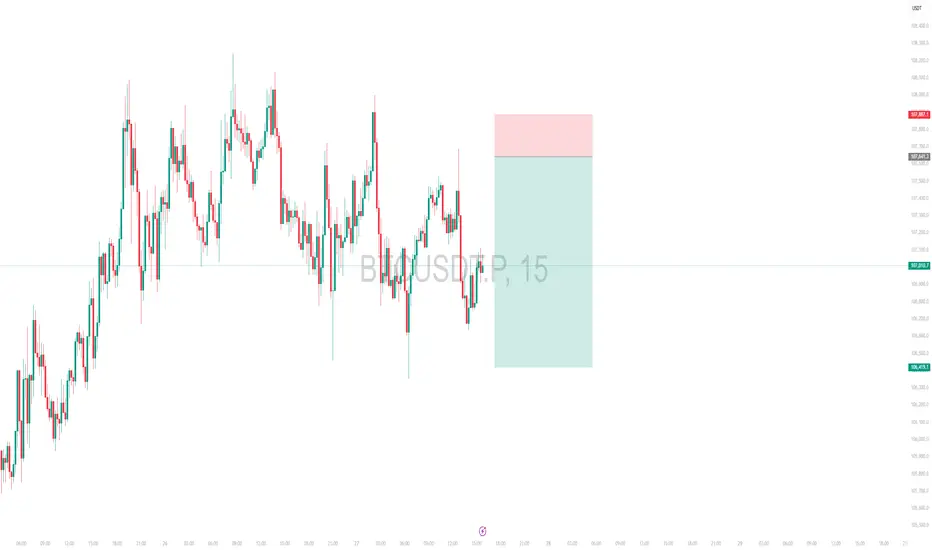
Intraday Short Setup | June 27th 2025 | Valid Until Daily ClosePrice has pushed into a potential intraday Pivot supply zone (red box) where sellers may step in. This trade is based on the expectation of a rejection from this area.
Entry: Red box — a short entry zone aligned with overhead supply
Stop Loss: Above the red zone (invalidates the setup)
Target: Green box — area to consider partial/full exit based on momentum
Risk-reward is favorable with a tight invalidation and clean downside target
Price may stall or reverse near the red box, creating short opportunity
Note:
This is an intraday trade idea that expires at 00:00 UTC (Daily Candle Close). Re-evaluate the setup if price remains indecisive near the entry zone close to that time.
Bitcoin go to the moon!! BTC/USDT Technical Analysis (4H Timeframe)
1. Overall Trend
The chart shows BTC trading within a wide range between a Supply Zone at the top (~111,500 – 112,500 USDT) and a Demand Zone at the bottom (~100,500 – 102,500 USDT).
The current price is around 107,050 USDT, recently breaking out of a downtrend line and now retesting the upper Demand H4 area.
2. Key Zones
Supply Zone (Sell Area): 111,500 – 112,500 USDT
Strong resistance zone where price was sharply rejected previously.
Resistance H4: ~108,800 – 109,200 USDT
First resistance level if the bullish move continues.
Demand H4 (Short-term Buy Zone): 105,000 – 106,000 USDT
Price is currently retesting this zone after breaking out.
Demand H4 (Stronger Buy Zone): 100,500 – 102,500 USDT
A deeper support zone in case the current demand fails.
3. Trading Scenarios
BUY Scenarios
Buy #1 (Short-Term Entry):
Entry: Around 105,000 – 106,000 USDT
Stop Loss: Below 104,000 USDT
Take Profits:
TP1: Resistance H4 ~109,000 USDT
TP2: Supply Zone ~111,500 – 112,500 USDT
Buy #2 (Safer Entry):
If price breaks below the current Demand H4 and drops to the lower zone (100,500 – 102,500 USDT), consider entering there.
Targeting a bounce back to the resistance or higher zones.
SELL Scenario
Sell Limit Setup:
Entry: At Supply Zone 111,500 – 112,500 USDT
Stop Loss: Above 113,000 USDT
Take Profits:
TP1: ~109,000 USDT
TP2: ~106,000 USDT
TP3 (extended): ~102,000 USDT
4. Conclusion
Since the price is currently testing a breakout + demand confluence area → BUY setups are preferred if bullish confirmation occurs at the 105–106K zone.
If the zone fails, wait for a deeper pullback to the 100.5–102.5K demand zone.
The upper supply zone remains a high-probability SELL area if price rallies that far.
