Re-entry after liquidity sweepOn 1H, a big doji indicates activity in demand zone, hence taking the bet for long trade, contrarian trade
Trade ideas

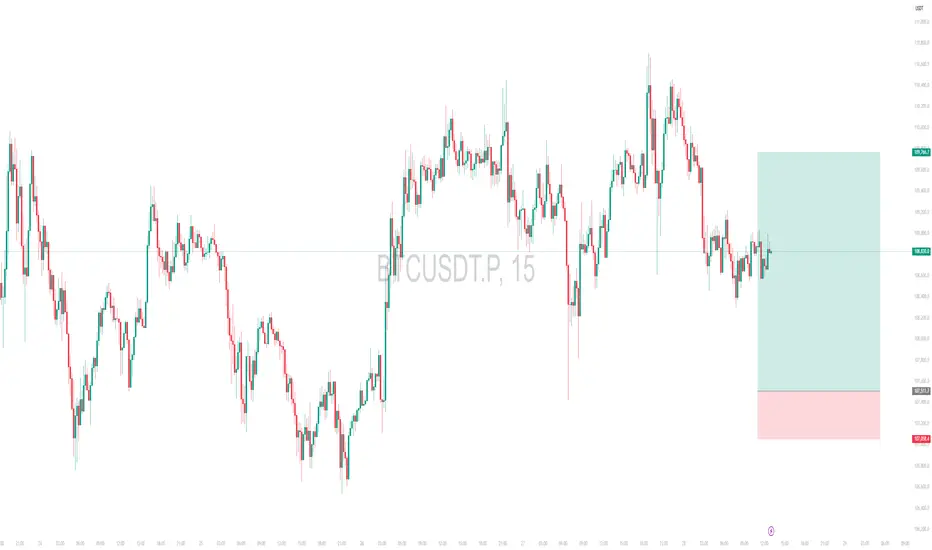
Intraday Long Setup | May 28th 2025 | Valid Until Daily ClosePrice is retracing to a strong pivot zone (marked by the red box).
Structure remains bullish with potential for continuation after pullback.
The green box represents a high-probability long opportunity with tight risk control.
Watch for price reaction within the red zone. Entry only if confirmation (e.g., bullish engulfing, strong wick rejections) appears.
The setup expires at end of the daily candle close.
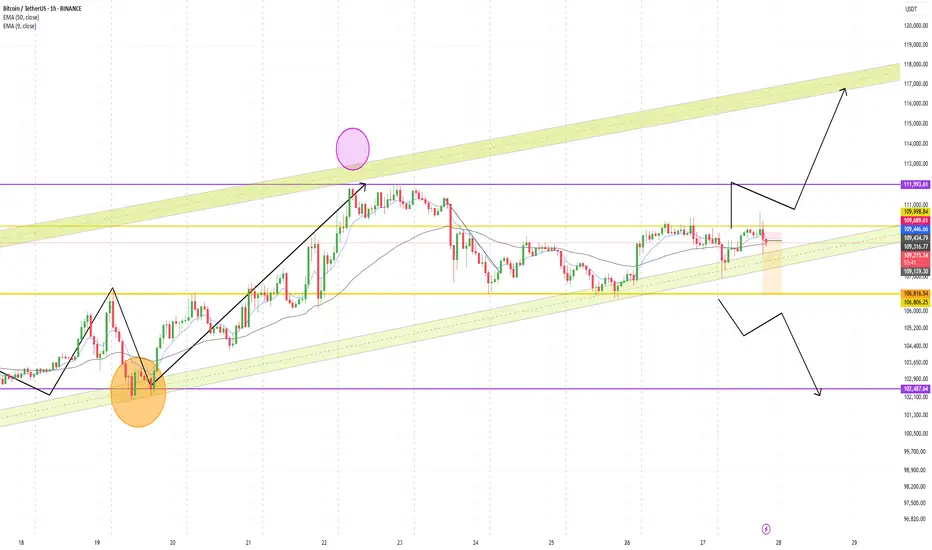
Cycle Conflict in BTC — Long Bias Despite Bearish Price Action📊 Cycle Structure:
⬆️ HWC (Higher Wave Cycle): Bullish
⬆️ MWC (Middle Wave Cycle): Bullish
🔁 LWC (Lower Wave Cycle): Ranging (Neutral, no clear direction)
📌 Always keep cycles in mind — they are key tools to understand both long-term and short-term trends and help us manage risk better.
📉 Price Action Inside the Channel:
Price is moving inside a defined channel.
We’ve seen about 6 touches to the channel bottom, but the 5th and 6th touches were weak and didn’t even reach the mid-channel line. This shows buyer weakness at the support zone.
Candles and volume also indicate bearish pressure.
🔄 Conflicting Signals:
Cycles suggest avoiding shorts and keeping a long bias.
But the channel and bearish pressure indicate a possible breakdown.
⚠️ Risk Management:
This is where risk management saves the day!
Enter long with low risk.
Place a tight stop loss so if price moves against us, we exit fast.
If the market moves in favor of longs, we can quickly take the position.
Also, quick profit-taking is advised since this move contradicts the cycle signals.
📍 Key Level:
105,250 — This level can trigger strong reactions but it’s not a confirmation for long entries. It’s mainly a good zone for taking profits and managing positions.
📌 If you want me to analyze a specific coin or pair, just drop a comment.
⚠️ Without proper risk management, you’re just a ticking time bomb.
— PXA

BTCUSDT Price Analysis – Potential Drop Incoming! 🔲 Chart Zones
🟥 Resistance Zone (~111,000–112,000):
Price has touched this zone multiple times and failed to break higher – this is a strong resistance area. 🚫📈
🟪 Support Zone (~101,000–102,000):
A historically strong demand area where price previously bounced up. 💪📉
🔍 Current Price Behavior
📊 Price Level: Around 108,666.66
🔄 The chart shows lower highs forming, indicating weakening bullish momentum.
📉 Bearish projection drawn (blue zigzag line) suggests a potential double top forming below resistance.
📉 What’s Expected?
🔵 Big Drop Alert! ⬇️
If the price fails to break above and gets rejected again, the chart predicts a sharp move down toward the support zone.
🎯 Target Area: ~101,000–102,000 (Support zone)
📌 Summary
🧱 Resistance holding strong
💤 Momentum slowing down
⚠️ Bearish move likely
🏹 Targeting support zone for potential bounce
⚠️ Trading Tip 🧠
Watch for confirmation before entering trades! A break below the recent lows could trigger a short opportunity, while a bounce near support could offer a buy setup. 🛑📈

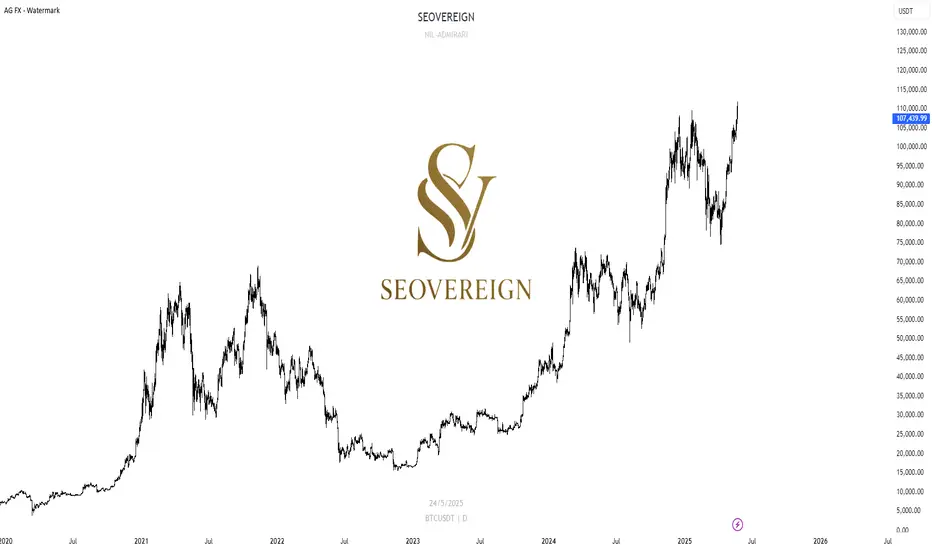
Bitcoin Chart Analysis – May 28, 2025We are the SeoVereign Trading Team.
With sharp insight and precise analysis, we regularly share trading ideas on Bitcoin and other major assets—always guided by structure, sentiment, and momentum.
🔔 Follow us to never miss a market update.
--------------------------------------------------------------------------------------------------------
📈 Bitcoin Breaks 112K — Upward Counting Continues
Bitcoin has now reached 112,000 USDT, continuing to break new highs.
In my May 24, 2025 idea, I had already mentioned that a rebound would occur around the 106K area.
(Click the image to go to the May 24, 2025 idea.)
Since that idea, I have continued with the wave counting.
The basis of the wave counting at the time was as follows:
Wave 1 analysis: Wave 1 ~ Wave 3 × 0.618 = Wave 5
Wave 3 analysis: Wave 1 × 0.618 = Wave 5
Wave 5 analysis: Wave 1 × 1 = Wave 5
Wave C analysis: Wave 1 × 2.618 = Wave 3
(*Some mentioned that Waves 1 and 4 overlapped, but please note that the impulse in question is a terminal type as per Glenn Neely.)
--------------------------------------------------------------------------------------------------------
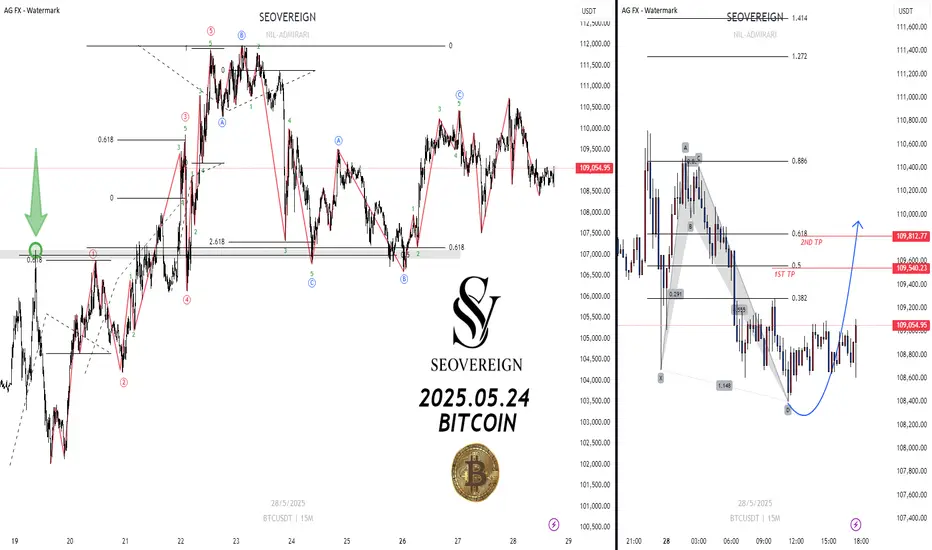
🧭 Wave Counting Update After May 24
One new point emphasized in this idea is that Wave C formed an impulse wave during the rise.
The wave counting after May 24, 2025, can be seen in the chart below:
In the chart, you can see that Wave C (impulse) moved up, and impulses and corrections continue to alternate.
--------------------------------------------------------------------------------------------------------
📐 Harmonic Pattern Analysis (Bat Pattern Confirmation)
Around the May 27, 2025 low of 107,540 USDT, one of the most well-known harmonic patterns — the Bat pattern — was confirmed.
This area was a very attractive point to enter a long position.
If wave counting and direction were set accurately, it was a position that could have been clearly captured.
--------------------------------------------------------------------------------------------------------
Also, in the chart below, the 1:1 ratio between wave A and wave C in the abc correction strongly indicates a bullish move.
🎯 Entry and Target Strategy — Based on Alt Bat Pattern
The basis for this bet is the 1.13 Alt Bat pattern in harmonic theory.
Point B: 0.382
PRZ (Potential Reversal Zone): 1.13
--------------------------------------------------------------------------------------------------------
📌 If entering a long position, the targets are as follows:
1st TP: 109,540 USDT
2nd TP: 109,812 USDT
3rd TP: 110,057 USDT
It is not recommended to take profit on all positions when the target price is touched.
Since the current wave count strongly suggests further upside, I recommend holding some positions instead of fully exiting.
--------------------------------------------------------------------------------------------------------
🗺️ Long-Term Wave Counting Reference (Roadmap Presentation)
Lastly, I am reattaching the daily-based long-term wave counting ideas that I previously shared.
They will be very helpful in setting the big direction going forward.
(Click the images to go to the related idea.)
SHORT $BTC 10X -> 25X🔴SHORT CRYPTOCAP:BTC 10X -> 25X
Entry: Currently in the zone → can enter immediately
SL/TP: Set as shown in the image
Reason: The uptrend line has broken and it's retesting the previous high
Risk: M15 is still moving sideways, and the main trend is still up! Be cautious with this trade, everyone.
If you're already in the position, don't add more! If you haven’t entered yet, take the shot now!

BTC is ready to breakdown channel patternas per my view becoze BTC taken support 3 times so this time will break
Make or brake For the past few days, BTC has been showing signs of distribution — meaning large players are booking profits.
This often indicates the beginning of a trend reversal.
Entry -1097000
SL-112000
Target -106400/105000/103000

BTCUSDT.P | Intraday Short Setup | 26th May 2025Price is pushing into a key pivot based resistance area (highlighted in red).
Looking for a clean rejection with a 1R move to secure partials, then possible continuation toward lower levels.
Managing risk tightly as structure unfolds.

BTC Bull Run Ending Soon?"September could mark the climax of Bitcoin’s bull rally, triggering a correction phase as smart money begins profit-taking — key levels like $74,457 and $48,888 may become attractive accumulation zones in the upcoming bear market."
Disclaimer : This content is for informational and educational purposes only and should not be considered financial or investment advice. Cryptocurrency trading involves significant risk and may not be suitable for all investors. Always do your own research (DYOR) and consult with a qualified financial advisor before making any trading decisions.

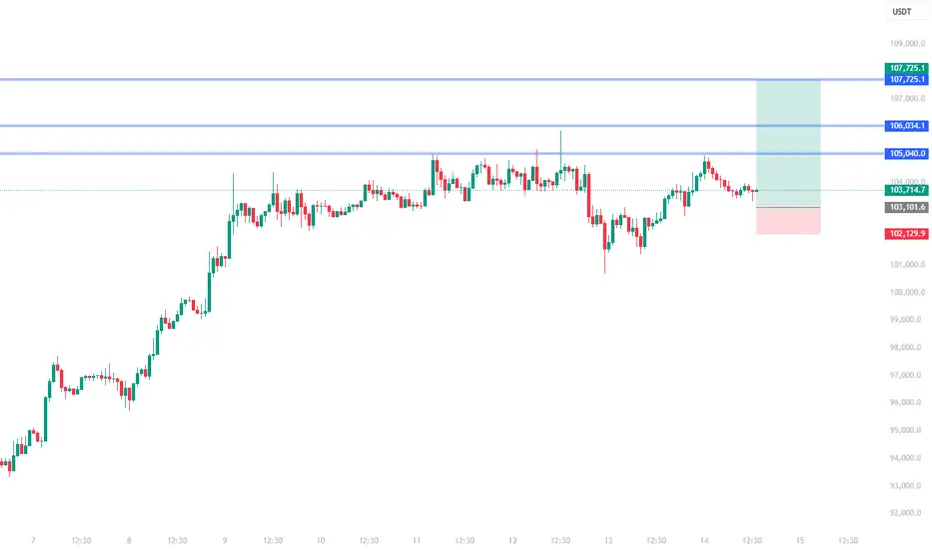
Intraday Long Setup | Pivot-Based StrategyPrice is retracing into a strong pivot zone (marked by the red box), which acted as a previous resistance and is now flipping into support.
Structure remains bullish with potential for continuation after pullback.
The green box represents a high-probability long opportunity with tight risk control.
Watch for price reaction within the red zone. Entry only if confirmation (e.g., bullish engulfing, strong wick rejections) appears.
The setup expires at end of the daily candle close.
BTCUSDT.P Weekly Short Setup | Pivot-Based StrategyPrice has pushed into a potential weekly Pivot supply zone (red box) where sellers may step in. This trade is based on the expectation of a rejection from this area.
Entry: Red box — a short entry zone aligned with overhead supply
Stop Loss: Above the red zone (invalidates the setup)
Target: Green box — area to consider partial/full exit based on momentum
BTCUSDT has shown a strong bounce but is now approaching a key pivotal resistance zone
Risk-reward is favorable with a tight invalidation and clean downside target
Price may stall or reverse near the red box, creating short opportunity
Note:
This is a swing trade idea that expires at Weekly Candle Close. Re-evaluate the setup if price remains indecisive near the entry zone close to that time.
BTCUSDT is getting ready for big moveBtc is in consolidation above trendlyne , expected a bullish move above the rectangle box'
levels for buy 109850
if does not break the rectangle box them trade idea will be invalidated.
upper arrow will be target for buyers

BTCUSDT.P | Intraday Short Setup | 24th May 2024Price has pushed into a key resistance area (highlighted in red).
Looking for a clean rejection with a 1R move to secure partials, then possible continuation toward lower levels.
Managing risk tightly as structure unfolds.

2025.05.18 BITCOIN Short-term long positionWe are the SeoVereign Trading Team.
With sharp insight and precise analysis, we regularly share trading ideas on Bitcoin and other major assets—always guided by structure, sentiment, and momentum.
🔔 Follow us to never miss a market update.
📈 Bitcoin (BTC) Long Position Outlook
Currently, Bitcoin has confirmed support after two valid Bat patterns played out. From an Elliott Wave perspective, the market is in a consolidation phase, and it’s unclear whether the next move will be an impulse or a corrective wave.
However, what’s important is that the next wave is very likely to be bullish.
So regardless of its type, this is a zone to consider a long position.
One important point to emphasize:
Do not try to predict the distant future with Elliott Wave or Harmonic patterns.
These tools are excellent for identifying short-term direction and entries, and our accuracy over time has proven this.
Instead of drawing overly extended scenarios, focus on high-probability short-term setups and place your bets accordingly.
For this reason, I’m presenting a long position at the current level.
🎯 Target Levels
1st Target: 103341
2nd Target: 103569
3rd Target: 103793
Adapt to the market structure,
and place strong bets only on what’s predictable.
📊 Strategic Implications of Rising Bitcoin Dominance
Recently, Bitcoin dominance has been rising significantly. This indicates that Bitcoin's upward momentum is currently the leading force in the overall market.
During such periods, many novice investors tend to accumulate altcoins instead.
They expect similar gains from altcoins as they see in Bitcoin, and often bet on relatively "cheaper" assets.
However, in reality, this is precisely the time to buy more Bitcoin aggressively.
There’s always a reason why certain assets fail to rise.
If a coin doesn't move even when the broader market is going up, it should be interpreted as a lack of relative potential.
✅ In conclusion,
In a dominance environment like this, a Bitcoin-centered portfolio is a more rational strategy than focusing on altcoins.
Staying aligned with Bitcoin’s trend is the smarter approach to increase the probability of profit.

BTC consolidation Waiting for breakout or breakdown but looking BTC price structure taking short bad idea but who knows this might be a correction starting point, but still green candles strong but no use until breakout 110000 and hold above the level

Bitcoin (BTC) Technical Analysis for the Week of May 26 - June 1#Current Price and Market Context (as of May 24, 2025):
Price: Bitcoin is trading around $103,000–$111,000, with recent consolidation near $103,000 after facing resistance at $105,000.
Market Sentiment: Bullish, with the Fear & Greed Index at 78 (Extreme Greed) and 28 technical indicators signaling buy versus 6 bearish signals.
Volatility: Bitcoin has shown increased volatility recently, with a 0.94% daily volatility estimate.
# Forecast for Next Week (May 26 - June 1, 2025)
--Bullish Scenario:
Probability: High (based on 73% bullish market sentiment and technical indicators favouring buy signals).
Price Target: $124,000–$127,000, with a potential push toward if resistance at $105,000 is decisively broken in weekly time frame
Catalysts:
Continued institutional inflows (e.g., $6.9B in U.S. spot Bitcoin ETF inflows over three weeks).
Sustained trading above key EMAs and support levels ($103,000–$106,000).
Bearish Scenario:
Probability: Moderate (due to overbought RSI and recent resistance at $105,000).
Price Target: A pullback to $100,000–$103,000, with a deeper correction possible to $95,000 if support at $103,000 fails.
-- Disclaimer --
This analysis is based on recent technical data and market sentiment from web sources and X posts. It is for informational purposes only and not financial advice. Trading involves high risks, and past performance does not guarantee future results. Always conduct your own research or consult a SEBI-registered advisor before trading.

BTC is breathing right now for next rally.if the BTC is breaking and closing below the level i marked then it will start going down otherwise it will continue to rise. trust me guys i am very confident about what i said.

Future Trading Strategy as of 2025.05.24We are the SeoVereign Trading Team.
With sharp insight and precise analysis, we regularly share trading ideas on Bitcoin and other major assets—always guided by structure, sentiment, and momentum.
🔔 Follow us to never miss a market update.
Serverin Team's Upcoming Trading Strategy – Full Disclosure
Hello, this is Serverin, operator of the Serverin Team.
After Bitcoin surpassed its all-time high of $112,000, it has experienced a decline of approximately 4% as of May 24, 2025.
The primary cause of this downturn is believed to be the global market risk triggered by President Trump's announcement of a 50% tariff on Europe.
Technical Analysis
Let’s begin with the technical analysis.
As shown in the following chart, a Shark pattern has formed within the harmonic pattern framework, and the Potential Reversal Zone (PRZ) is confirmed at a 1:1 extension level.
Additionally, since Bitcoin decisively broke through its previous all-time high of $109,700, a short-term correction in this zone is a likely scenario.
Due to the highly volatile nature of cryptocurrencies, it is common for prices to revisit and consolidate around previous highs after a breakout.
We believe the current price action reflects this typical behavior.
Key Factors Behind the Current Decline
Psychological correction following the breakout of previous highs
Technical confirmation of the Shark pattern
President Trump's announcement of European tariffs
Future Trading Strategy
The Serverin Team still maintains a bullish outlook on Bitcoin.
This view remains consistent with the idea posted on May 18.
Accordingly, we are holding significant long positions in both Bitcoin and major altcoins.
If a deeper correction occurs, we plan to increase our positions. Conversely, if the price resumes its upward movement, we will continue to add to our longs.
However, if Bitcoin forms a top around $112,500 and begins to reverse, we are prepared to gradually exit the market.
For trend reversal confirmation, we rely on the Fibonacci 1.414 extension level.
This level is approximately at the $59,000 range for Bitcoin.
Scenario Overview
We are currently focusing on the green and blue scenarios.
Should either of these play out, we will continue to aggressively increase our exposure.
On the other hand, if the market follows the red scenario and shifts into a downtrend,
we will start reducing our positions with stop-losses, using the $59,000 level as our reference.
That concludes the Serverin Team’s trading strategy briefing.
Thank you.
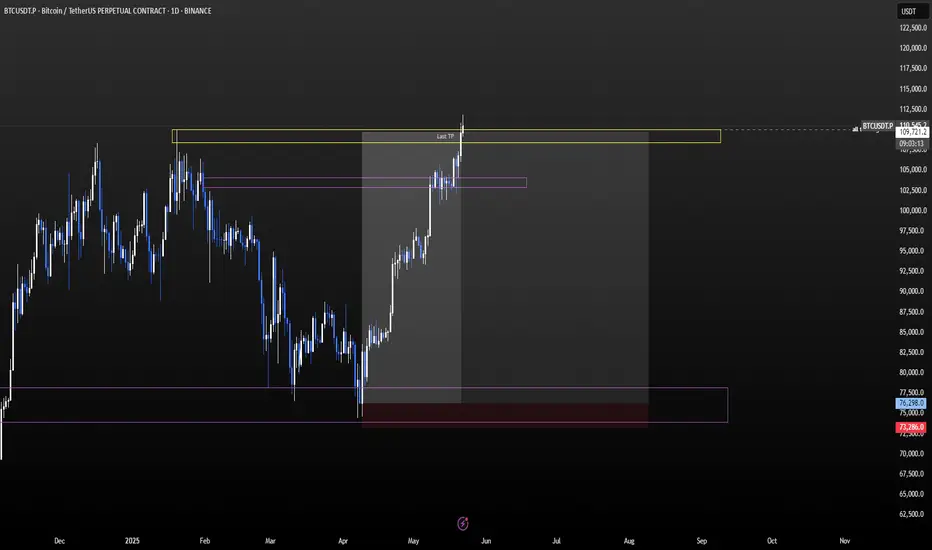
last target for short term BTC This is linked to tehe priovious analysis. It's just the set of the trade from april to may with a clarified design.
I use ineffincency levels to set trades and targets, liked with fibonacci level, thinking about the fact that btc is always recoveing empty zones (backtesting for beliving).
In this case:
BTCUSDT
Enter 76-78K inefficiency zone (purple)
TP1 102-104K inefficiency zone and support
TP2 110-112K inefficiency zone and last fibonacci target.
Nice month :)
in italian we say #godo
thanks for reading,
M
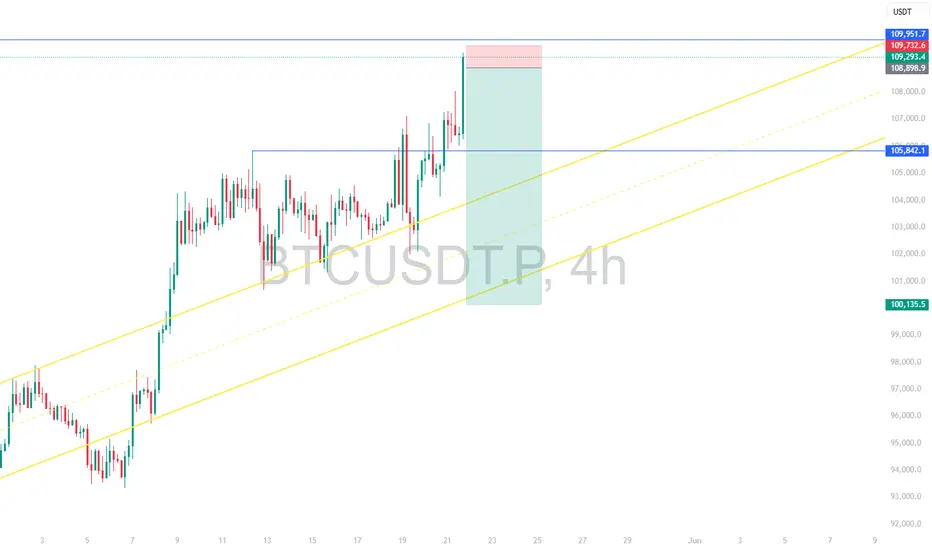
after one year, here we are 110KI just wanted to share an interesting analysis I did on May 12th to understand the typology of growth BCT has been experiencing. I wanted to determine whether it was a bubble, inflation, FOMO, or something else.
The "lower band short-term Daily" represents, in the short term, the lowest point from which the movement (in this case, bullish) started. This was identified using a double bottom and triple candle structure.
From this point, the price grew and consolidated, grew and consolidated again, without the hyped spikes or unstoppable runs we saw a few months ago.
This is positive as it indicates a certain level of consistency for the asset and a potential shift in investor behavior.
There were three flag patterns, each lasting about two weeks, following the same momentum and shaping the price:
High momentum bullish
Consolidation with a drawdown at the 0.236 or 0.382 Fibonacci levels
Consistent and strong break of ranges and supports
✅ TP1: Break of range at 102-104K
✅ TP2: 0.27 Fibonacci level at 106-107.5K
✅ TP3: 110-112K
I’ve been waiting for the last TP since the beginning of the year. The next target is 120-124K, but I hope the price experiences a drawdown before reaching that level. This would unlock liquidity, make it more attractive to external retail investors and institutions, and create new entry opportunities without triggering FOMO or panic selling.
This would lead to consistent growth, similar to what we saw in May, rather than something that happened in November 2024, which was completely reversed within six months.
what's next ?
lets find out :)
thanks for reading,
M

BITCOIN MAY TOUCH 75000 IN NEAR FUTUREBitcoin may touch 75k in near future as all technical showing price overbought. I was planning to short at 114780 sl 118804 tp 75000. This is my personal entry please take financier advice before taking any entry. which has good rr.

BTC Long ideaBitcoin is keeping doing a pattern of higher lows with each bullish flag, which is exactly what happens in this current bullish flag.
