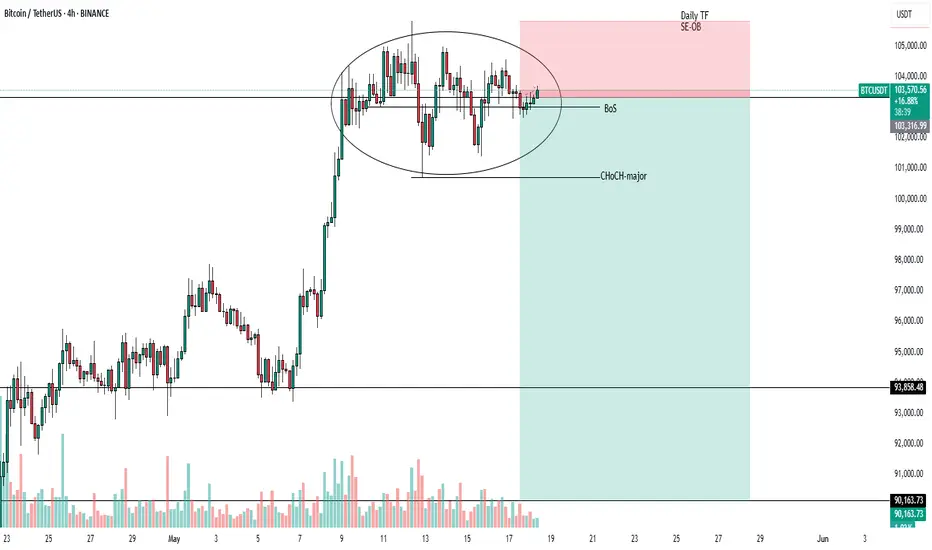
BTCUSDT HAS FORMED ELLIPSE ON 4H TF NEAR DAILY TF SE-ORDER BLOCKBTCUSDT is currently trading near daily timeframe selling order block(103333-107793.07) and has broken its structure at the level of 103005.33 and has also formed an ellipse on 4h timeframe i've entered a short position in BTCUSDT at the level of 103333 with stop loss above the high of the ellipse at the level of 105819.45 once it breaks the level of 100718.37 and changes its character it will give a mirror move till the levels of 93858.48 and 90163.73
Trade ideas
BITCOIN - SYMMETRICAL TRIANGLE FORMING WITHIN A BULLISH TRENDSymbol - BTCUSDT
Bitcoin is consolidating. A symmetrical triangle pattern is forming within the context of a prevailing bullish trend. Based on the current technical setup, it is reasonable to interpret this consolidation as a preparatory phase for a continuation of the upward movement.
Fundamental nuances have gradually improved over recent weeks, contributing to a moderate revival in the cryptocurrency market. From a technical standpoint, the market structure on the daily chart appears constructive. Following a period of strong upward momentum, the price has entered a consolidation phase rather than showing signs of reversal. The overall market remains bullish. After approximately 2–3 weeks of consolidation, a bullish distribution pattern appears to be developing. This cycle has repeated on two previous occasions. On the daily timeframe, the presence of extended lower wicks during the consolidation phase suggests that large market participants (whales) are actively absorbing downward pressure, thereby preventing the price from entering risk zones. Accordingly, it is likely that the current consolidation could persist for a time, and there remains the possibility of a retest of the triangle’s lower boundary or even a deeper move to test the liquidity zones around 1,01,400 and 1,00,700 before resuming the upward trend.
Resistance levels: 1,03,600, 1,04,400, 1,05,000
Support levels: 1,02,500, 1,01,400, 1,00,600
A downside scenario may be considered if the price breaks through the triangle’s lower boundary and stabilizes around the 1,01,400 level, potentially forming a pre-breakdown consolidation-assuming no immediate rebound follows.
However, at present, intraday trading strategies can be considered within the range of the ongoing consolidation. A breakout to the upside and continuation of the bullish trend would likely be signaled by consolidation within the 1,03,500 to 1,05,000 range, accompanied by price compression toward the upper boundary.

bntcusdt bulllish viiew all views are edu purpose only i am ecpecting btcusdt for bullish moving till 107200 and 108131. level safe selling possible. just watch

2025.05.15 BITCOINWe are the SeoVereign Trading Team.
With sharp insight and precise analysis, we regularly share trading ideas on Bitcoin and other major assets—always guided by structure, sentiment, and momentum.
🔔 Follow us to never miss a market update.
The formation of the Deep Gartley pattern has been clearly confirmed, suggesting a valid short-term rebound scenario.
Buying pressure is emerging at the current price level, reinforcing the reliability of the pattern.
Short-term target levels are as follows:
1st Target: 102,807
2nd Target: 103,629
3rd Target: 104,567
Risk management is advised upon entry, and price action around each target level should be closely monitored.
As market volatility may increase, it is recommended to confirm signals in conjunction with supplementary indicators.

Can BTC go 110k again?Hell yeah, if it crosses 107k then chances of liquidity getting sweeped at 110k is possible

Strong buy signal in BTCUSDBuy BTCUSD at a limit of 103666 and hold with the given target an SL on the chart.

BTC LONGBTC is getting ready for 106000 levels in near term.
Consider the Long position only if this breakout is successful and can add on Dips or Retests too.
Stop loss can be kept at 83000 levels on closing basis.
Dislcaimer: We are SEBI & NISM Certified but not registered hence do your own analysis before trading or investing. We are also not responsible for your profits or losses in Crypto markets.

Is Bitcoin 100K the New Normal?We are the SeoVereign Trading Team.
With precision analysis and sharp market insight, we regularly publish Bitcoin and crypto trading ideas based on technical structure and momentum.
🔔 Follow us to never miss a market update.
📈 Bitcoin Reclaims the 100K Narrative — A New Bullish Wave in Motion
The Bitcoin market is showing renewed strength, with price action suggesting the early stages of a major bullish continuation. We're currently observing a well-formed Reverse Deep Crab harmonic pattern, indicating a potential short-term pullback driven by late-entry short positions — but more importantly, it's setting the stage for a strong long-side breakout.
As momentum builds, this retracement could offer a prime long entry opportunity before the next leg up.
🎯 Key Upside Targets:
1st Target: 105,180 — Initial resistance zone
2nd Target: 105,780 — Key structural breakout level
3rd Target: 106,277 — Measured move from harmonic projection
From a positioning standpoint, the market still shows signs of short-side overcrowding, which could trigger a short squeeze and further fuel upside momentum.
🧠 Strategy Insight:
We're looking to position long into weakness, aligning with both technical structure and broader market sentiment. Risk-managed entries with staggered take-profit levels are advised to capitalize on potential volatility and breakout acceleration.
🚀 Now is not the time to fade strength — it’s time to ride the trend.

4H Bitcoin Analysis — All Eyes on the Midline4H BINANCE:BTCUSDT Analysis
🔹 Cycle Structure Overview:
HWC (High Wave Cycle / Long-Term Cycle): Bullish 🔼
MWC (Medium Wave Cycle / Mid-Term Cycle): Bullish 🔼
LWC (Low Wave Cycle / Short-Term Cycle): Bearish 🔽
The market seems to be offering us a better entry opportunity, and since the higher-timeframe cycles (HWC & MWC) are both bullish, they carry more weight. That’s where our focus is. 📈
🔍 Channel Analysis:
We’ve drawn a clear ascending channel, and here are the key takeaways:
4 valid touches on the top of the channel, indicating buyer strength and a bullish bias.
3 confirmed touches on the bottom of the channel, supporting the structure.
What’s more important:
Price increases volume on the way up,
And volume fades during pullbacks — classic signs of bullish momentum. ✅
⏳ Current Situation:
Right now, price is stuck at the midline of the channel — which is a critical decision zone.
⚠️ If we bounce here, there’s a high probability we’ll head toward the channel top, possibly breaking out.
Also, pay close attention to volume behavior during the latest pullbacks — it’s been dropping, suggesting the correction is losing steam and buyers might be stepping back in soon.
🚫 About Short Positions:
While some may consider shorting if the midline breaks, remember:
That’s against the higher-timeframe bullish cycles.
If you still go for it, you need a tight stop-loss and aggressive partial exits.
Personally, I avoid fighting the bigger trend — not worth the trouble.
🎯 Long Setup Idea:
The key resistance at 102951 is our breakout level.
If price closes a 1H or at least a 15-minute candle above it, that’s your signal.
💬 Want a different coin analyzed next?
Drop it in the comments — if I see strong interest, I’ll cover it in the next update. ⚡
Without proper risk management, you're just a ticking time bomb. ⚠️
— PXA 📊

Who is going to win, bulls or bears, let's see There is a strong resistance in the daily timeframe. If it is successfully then I see a downfall in btc

BTC Bulls Must Defend $103K… Or Say Hello to $99K Again Bitcoin completed a clear 5-wave Elliott Impulse and is now forming an ascending wedge (abcde structure), typically hinting at a possible correction.
Key Levels to Watch:
🔴 Key Bull Level: $103,085 – must hold to maintain bullish structure
🟠 Support 1: $99,265 – breach = deeper pullback
🟡 Support 2: $95,965 – last stronghold for bulls
Outlook:
🔼 A breakout above the wedge = continuation toward $110K+
🔽 Breakdown below $103K = expect correction toward lower supports
Strategy:
➡️ Wait for confirmation. A wedge breakdown = potential short trade setup.
➡️ Breakout = bullish continuation. Always manage risk wisely.
Stay sharp, traders!

Bitcoin Technical Analysis: May 10, 2025# Current Price and Market Context
Price: Approximately $103,160, based on chart at posting time.
# Market Sentiment: Bullish, with 78% of technical indicators showing bullish trends and Fear & Greed Index at 73 (Greed).
Recent Performance: Bitcoin remains resilient, trading above key moving averages after a spring correction, with a strong bullish monthly trend. It hit an all-time high of $109,114.88 on January 20, 2025, but has since consolidated.
## My view: If weekly close exceeds $105,600, expect new all-time highs of $123,930–$127,482.
# Chart for reference

Bitcoin - Elliot Waves - Minor Counts (Last leg up)Here are the counts of the 5th of 5th that's going on. 108-110 should be max it goes.
Target after this is 60k.

XAUUSD Ultimate Bullish TargetsBulls - Assemble!
XAUUSD has recently shown a decent pullback. It opens new doors for all traders having a bullish view on Gold. According to my analysis, Gold is mirroring it's previous bull run moves, with a few extra volume bursts (50-100 pips) here and there.
So, the max upside potential for Gold is 3680 - 3700 which is Approximately 4000 pips from the current price (3300). This would be my absolute last target, after which it should see a decent correction once again because that would be extremely overbought region.
Refer to the chart for key reversal zones.
Let's see what happens.
Trade Safe, Don't overleverage your positions.
Cheers!

BTC - Elliot Wave - Last Leg - 60k Coming AgainBTC completing the pending 5th of 5th of 5th.
God - this is going to be a painful correction.
P.S.: There could still be some steam left, but once done we are looking for 60k again!
All the best!

Bullish View for BTC! Expecting to break the trendline and continue its moves towards the upside easily till 100k.
However, failing to cross above 85k will invalidate this trade.
⚠️ Disclaimer: This is NOT a buy/sell recommendation. This post is meant for learning purposes only. Views are personal. Please, do your due diligence before investing.⚠️
💬 What are your thoughts on this share it in the comments below. ✌️
🔥 Happy Trading!✅🚀

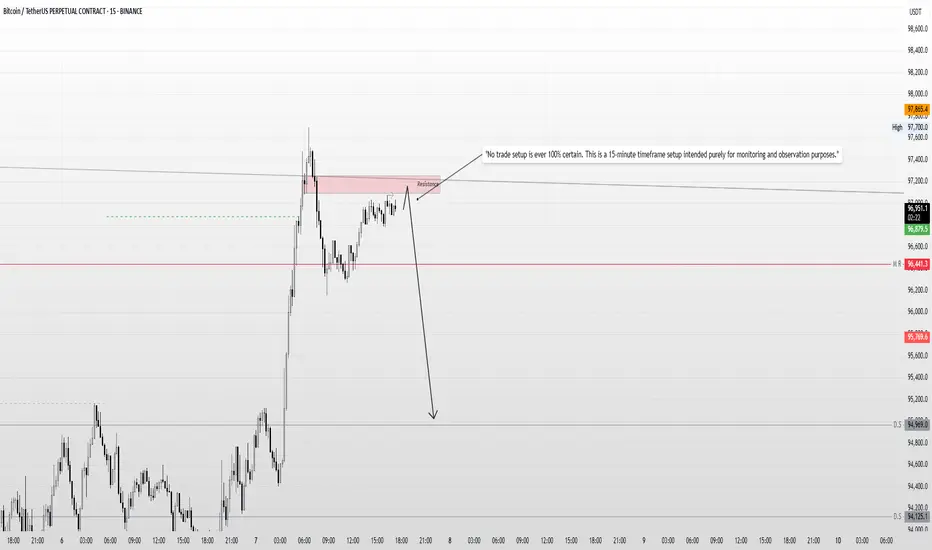
Bitcoin Intraday Bias – Liquidity Sweep & Rejection Setup"Intraday Setup: I anticipate that during the New York open, the market may sweep the liquidity around 97078, reject from the resistance zone, and potentially move lower."
"No trade setup is ever 100% certain. This is a 15-minute timeframe setup intended purely for monitoring and observation purposes."
Disclaimer: This is not financial advice. The analysis shared is for educational and informational purposes only. Please conduct your own research and consult with a licensed financial advisor before making any trading decisions. Trading involves significant risk and may not be suitable for all investors.
BTC can move from this point with good potentialBTC market structure is completed can move upward before moving market will grab BSL.
This is my personal view, before taking please take advice from your financial advisor.
As Per Technical StrategyAs per my Technical Strategy It gave sell Signal in 4 hours chart , previous buy was performed well... let us watch this sell signal. Also mainly Signal candle low has to break for further confirmation...

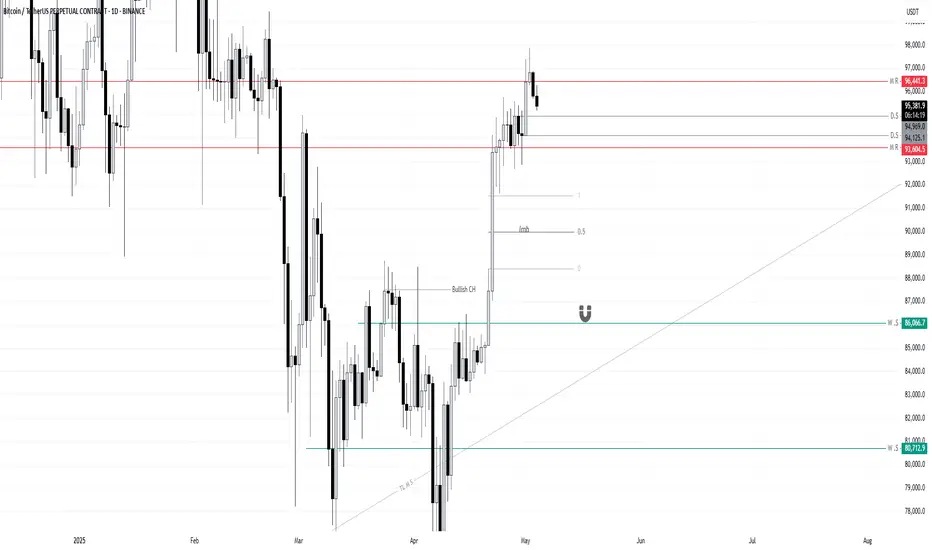
Bitcoin OutLook for Next Week BTCUSDT.pMarket Outlook (BTC/USD):
I’m currently observing the ₹94,125 level on the daily timeframe. A daily candle close below this level would significantly increase the probability of Bitcoin retracing toward the imbalance zone around ₹90,000.
However, there is a key demand zone near ₹86,000, which could act as a strong support and potentially push the market back upward. This area will be crucial in determining whether the bearish momentum continues or a reversal is triggered.
Let’s see how the market reacts around the ₹94,125 level. I’ll post the next update after Monday’s daily candle closes.
Thank you for your continued support — it's truly appreciated.
BTC/USD) bullish trend analysis Read The ChaptianSMC Trading point update
Technical(BTC/USDT) analysis outlines a bullish outlook with key technical levels and scenarios. Here's a breakdown of the idea:
Key Observations:
1. Trend Break and CHoCH (Change of Character):
The chart shows a clear break of the downtrend, confirmed by the CHoCH label — a common Smart Money Concept (SMC) signal indicating a potential trend reversal from bearish to bullish.
2. Key Zones Highlighted:
EVC-Buying Zone: Around 86,000 – 88,000 (aligned with EMA 200), marked as a strong accumulation area.
New Support Level: Around 92,000 – 93,000, potentially forming a bullish support after the recent rally.
Resistance Levels: Two major resistance zones near:
99,600 (intermediate resistance and target)
106,400 (final target)
3. RSI Indicator:
RSI is near 64, indicating strong momentum but not yet overbought — a potential sign of further upside.
4. Two Bullish Scenarios:
Scenario 1 (Aggressive Bullish): BTC continues upward from the current level and breaks above resistance toward the 106,447 target.
Scenario 2 (Retracement Bullish): BTC dips to the new support or even into the buying zone (86–88k), then rebounds to reach the same targets.
Mr SMC Trading point
---
Idea Summary:
The chart suggests bullish continuation, with potential pullbacks into strong demand zones. It supports both breakout and retracement entries, with targets at 99,632 and 106,447. If price holds above EMA 200 and RSI remains supportive, the upside thesis remains valid.
Pales support boost 🚀 analysis follow)

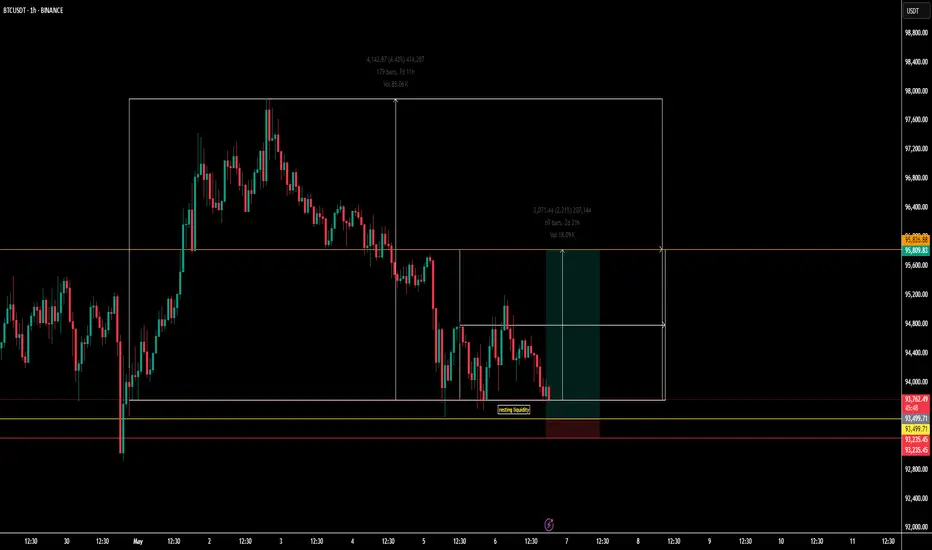
Bitcoin Wyckoff Distribution pattern Disclaimer: This is not financial advice. The following is for educational and informational purposes only.
Based on the current 1-hour timeframe, Bitcoin appears to be forming a potential Wyckoff Distribution pattern. If we see a liquidity sweep towards the upside—particularly around the 95,580 to 95,763 levels—and a subsequent bearish confirmation pattern forms on the same timeframe, we could anticipate a possible move down towards the 93,000 support zone.
Should the price fail to hold at that level, a deeper correction towards the 86,000 area could play out in the coming sessions. However, it is important to note that this scenario is valid only if a clear bearish structure forms post-liquidity sweep on the 1-hour chart.
No strategy guarantees 100% accuracy, and market conditions can change rapidly. This is merely a technical outlook and should not be construed as an investment or trading recommendation.

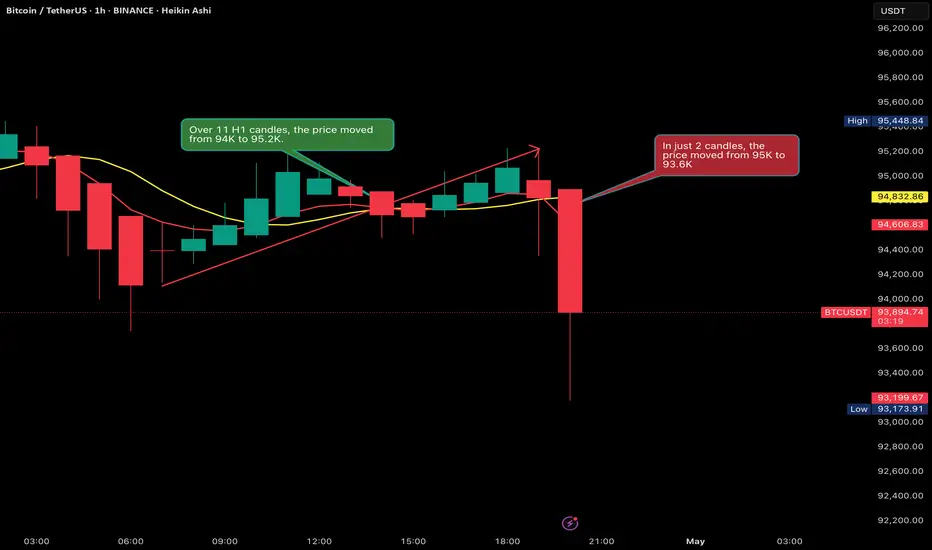
Why did I choose the short (scalping) direction?Why did I choose the short (scalping) direction?
BTC is currently trading in a narrow range, moving up and down. The D1 uptrend has already played out, from 82K to the 95K zone. Now, we’re waiting for a D1 correction to consider going LONG again. During this D1 downtrend, we can scalp SHORT on H4. However, I’m not choosing to BUY above 95K to chase 97K. Instead, I’ll wait to SHORT or, if no SHORT opportunity arises, wait to LONG again on D1.