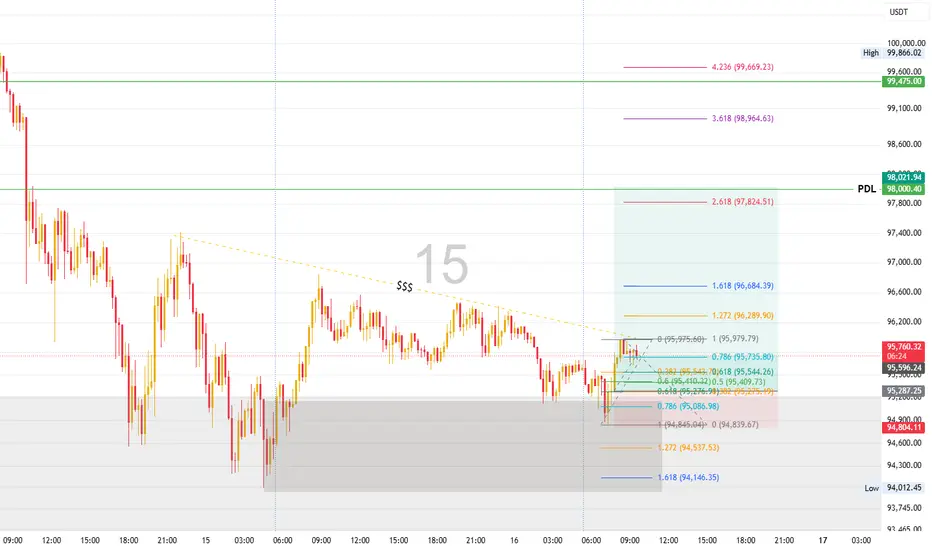
BTCUSD Retest Play: Buying the Dip Toward PDLYesterday BTC failed to tap the Previous Day’s Low (PDL), leaving an untouched liquidity pool below.
Today, price has already formed a liquidity buy zone at 95,665.95, which sits in a premium area.
I’m expecting BTC to potentially test the PDL, so I’m planning to buy on the dip.
📌 Entry: 95,279.63
🛡 Stop Loss: 94,814.54
🎯 Target: PDL 98,000
#BTCUSD
#Bitcoin
#BTC
#Crypto
#CryptoTrading
#LongSetup
#LiquidityGrab
#PDL
#SmartMoney
#PriceAction
#DayTrading
#SwingTrading
#LiquiditySweep
#MarketStructure
#BuyTheDip
#ForexCrypto
#PremiumZone
#OrderFlow
#TechnicalAnalysis
Trade ideas
Part 1 Ride The Big Moves Why Traders Use Options
Options offer several unique advantages:
1. Leverage
With a small premium, you can control a much larger position.
2. Hedging
Investors can protect portfolios from downside risk using puts.
3. Income Generation
Selling options—especially covered calls—creates consistent passive income.
4. Flexibility
You can profit in:
Upward markets
Downward markets
Sideways markets
High or low volatility environments
This flexibility gives options an edge over simple stock trading.


BTCUSDT/ETHUSDT WEEKLY ANALYSIS 17/11/2025 - 23/11/2025Wassup Lads!!
As discussed earlier we wanted BTC to take out the lows on the daily Time frame.
BTC has taken out the lows forming a potential SMT, to confirm this reversal I would like to see price form a swing point on Daily Time Frame with a Fair Value Gap for additional confirmation before looking for longs.
Plan for next week -
1. Wait for price to print more data
2. Wait for daily swing point for longs
3. Look for potential Longs
As always maintain risk and stay disciplined. Keep winning!!

Part 2 Intraday Trading Master ClassWhy Option Trading Is Growing Rapidly in India
In recent years, India has seen an explosive rise in options trading due to:
Weekly expiries (more opportunity)
Low entry capital
High liquidity in BankNifty and Nifty options
Rise of online brokerages
Wide availability of market data and tools
Social media awareness
Because of the leverage and excitement options offer, many new traders are drawn to them—though disciplined ones survive longer.

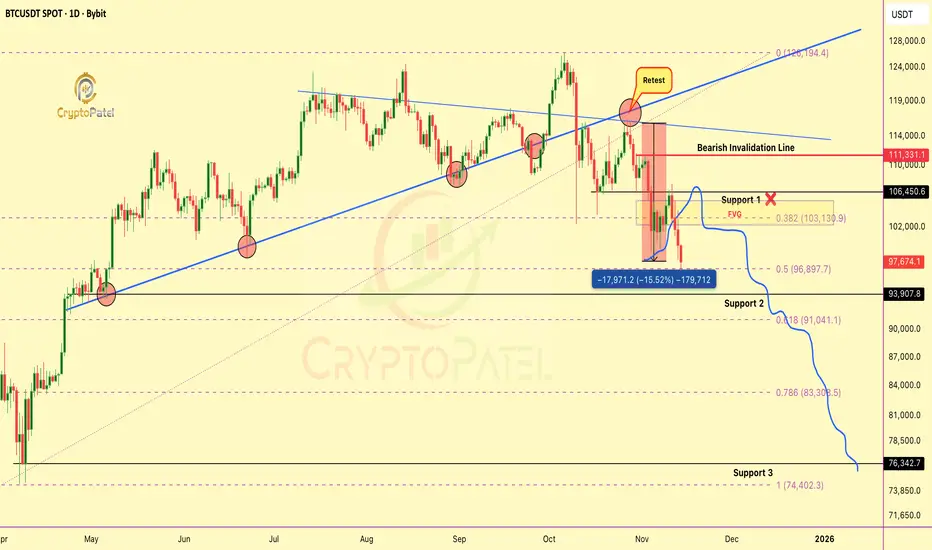
bearish retest I warned on Oct31 played out EXACTLY as projectedThe bearish retest I warned about on Oct 31 played out EXACTLY as projected
I clearly said CRYPTOCAP:BTC would dump again after filling the FVG at $106K–$107K and that’s exactly what happened.
BTC dropped from $107K → $98K (-9%) and from our retest entry, we’re now 15% in profit.
Hope you enjoyed the analysis and booked gains.
Now watch the 0.5–0.618 FIB zone closely.
✔️ If it holds → strong bounce possible
❌ If it fails → BTC could slide below $80K
I’ve been warning about this dump since BTC was above $120K+.
Structure always wins.
NFA & DYOR
BTC - Turned Bearish ?This unexpected longer US shutdown followed by another un expected temporary solution till Jan 2026 is causing panic in US market. These days Trump and his network moving the market as they want. And anything are possible these days by him. BTC has very strong Buyer network including ETFs, Strategy and other non stop accumulators. Its Golden time to buy Bitcoin at every dips since they have non stop flow of funds. But price drop un stoppable since margin issues cause weak hands to get liquidated. when 25X group gets liquidated then its huge sell off and it will take time to buy back the liquidity so SL kills all weak hands. But where is the Bottom. Cant predict because US shutdown has not got solution atleast for a year. Upcoming US data all expected to be slightly negative putting pressure on markets to be on sell side. Its all in the hands of Trump and his network or other banks who planned all these. I never seen a temporary solution for US shutdown in the past. At sending markets to the levels they want first big players will accumulate and then make policy move to move markets to up again.... Its sure bad news for Bitcoin Bulls planning for 130+ levels... It will come in 2026 but need to be loving and money management in SIP into Bitcoin will give rich returns in 2026

Part 9 Trading Master ClassChoosing the Right Strategy
Selecting the right options strategy depends on three factors:
Market Outlook:
Bullish → Long Call, Bull Call Spread, Short Put
Bearish → Long Put, Bear Put Spread, Covered Call
Neutral → Iron Condor, Butterfly, Short Straddle
Volatility:
High volatility → Buy options (Straddle, Strangle)
Low volatility → Sell options (Condor, Credit spreads)
Risk Appetite:
Low-risk → Spreads
Medium-risk → Covered/Protective positions
High-risk → Naked calls/puts

BTC/USDT Timeframe (4-hour)BTC/USDT Timeframe (4-hour)
Current price: ≈ $105,845
My drawn:
A descending trendline (showing previous resistance)
Ichimoku Cloud, and
Two target points marked with green arrows.
---
🔍 Chart Interpretation
From my image:
Price has broken above the descending trendline.
It’s also moving into/above the Ichimoku Cloud, a sign of a potential trend reversal.
My first target appears around $113,000 – $114,000, which aligns with the upper boundary of the drawn arrow.
The second target (higher arrow) points near $117,000 – $118,000, representing the extended bullish target zone.
---
🎯 Possible Targets Based on my Chart
1. Target 1: $113,000 – $114,000
(Short-term resistance / first profit zone)
2. Target 2: $117,000 – $118,000
(Next key resistance / full breakout target)
---
⚠ Risk Note
Watch for retests near $104,000 – $105,000 (the breakout zone).
If BTC closes back below the trendline or Ichimoku cloud, bullish momentum weakens.

BTCUSDT SHORT I was sitting in Short after a good bearish candle formed at resistance with very good volume, i just took 1:2 and i was out of the trade.
Logic :- Price was too stretched and bears were gaining control, bulls were trapped
But still the trend is bullish for me, lets see 🚀
Happy profits 🥂 enjoy guys, sorry i didn’t posted this trade earlier
LIKE AND FOLLOW FOR MORE TRADE IDEAS

As posted earlier 1:2 done As posted earlier i was sitting long in Btcusdt, 1:2 is done and i am out of the trade with 70% qunatity.
BINANCE:BTCUSDT
Like and follow for these types of trade ideas !!
And Join me with my journey so you can make yours 👍
Disclaimer: This is not financial advice. Please consult your financial advisor before making any investment decisions.

Bitcoin_Short Elliot WaveBitcoin appears to be completing an ABC pattern, potentially reaching up to 106,000. I anticipate a downside move below 99,000 once it tests resistance around 106,000. A short position could be considered near that level with a tight stop-loss.Please do your own research before taking any trade decisions.

bitcoin bullish bitcoin will bullish from 98 or 96 price If good candle near my OFL like positive engulfing or any other bullish candle than bitcoin will hit all time high and my pervious analysis is going to hit the target which was analysis before the crash of the bitcoin you can check it

#BITCOIN TECH UPDATE: BEARISH IN CONTROL#BITCOIN TECH UPDATE: BEARISH IN CONTROL
CRYPTOCAP:BTC is down 14% from $115K retest, clean rejection.
Trend remains bearish, structure forming lower highs & lower lows.
Key Zones:
Relief zone: $105K–$108K (short setup area).
Major support: $94K → break below = $76K next.
Momentum:
Selling pressure dominates; no bullish divergence yet.
Invalidation:
Only a close above $111.5K flips bias bullish toward $150K. ( Super Bullish Above $116.5K)
Plan:
Sell rallies. Manage risk. Avoid FOMO longs.
NFA & DYOR

$BTC LongLooks like bottom is in and 4hrs timeframe looks pretty decent to me for the next move at least to 108K$ and that will be the area where i will be more cautious and look into the daily timeframe and if we manage to break above the daily OB i believe we will make a new ATH

BTCUSDT Outlook 08/11/2025So right now, what I’m seeing on crypto today — honestly, it’s the weekend, and that’s never the best time to look for high-probability setups. But if we ignore the timing for a second and just focus on structure, I’m leaning bearish.
On the daily, the flow’s clearly bearish. ETH already cleared the daily FVG and showed SMT divergence with BTC, while Bitcoin couldn’t even take out the highs — basically an SMT sell setup between the two.
On the H4, you can spot the second stage of SMT divergence — one up at the top, and another with the previous candle.
Price looks like it wants to pull back and roll over from here.
So yeah, I’m kinda expecting a red weekend for BTC, as long as this structure keeps holding

My Journal - 08/11/2025 - BTCUSDT Scalp Idea Price has tapped into H4 FVG and has formed a bullish SMT with ETH, a 1 to 2 RR Trade. Do your own research.

Pat 9 Tradig Master ClassThe Greeks in Options
The Greeks measure the sensitivity of an option’s price to various factors:
Delta: Measures how much the option’s price changes for a ₹1 move in the underlying asset.
Gamma: Measures the rate of change of delta; it helps traders understand how delta will change as the market moves.
Theta: Measures time decay—how much the option loses value each day as expiration approaches.
Vega: Measures sensitivity to volatility changes.
Rho: Measures sensitivity to interest rate changes.
Understanding these helps traders manage risk and create balanced strategies.

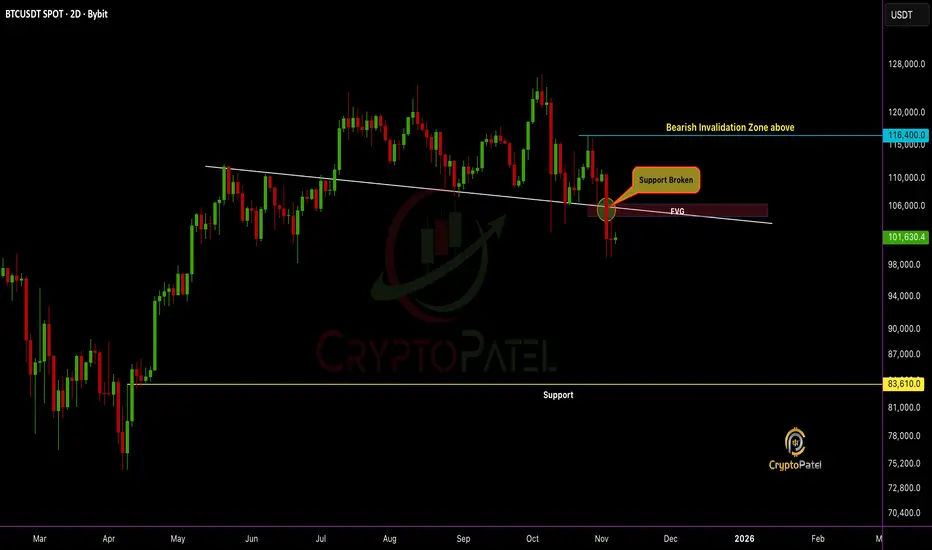
BTC Breakdown Confirmed, Structure Flipped Bearish: Next $88610?BTC Breakdown Confirmed, Structure Flipped Bearish: Next Stop $83,610?
Support is broken and the structure confirms a clear bearish shift.
#Bitcoin failed to reclaim the Fair Value Gap (FVG) zone, turning it into strong resistance.
High chances CRYPTOCAP:BTC could fill the FVG and continue the downside move toward $83,610.
Bulls remain trapped unless price reclaims $116,400, the bearish invalidation zone.
Trend bias remains bearish. Liquidity targets below are in play.
NFa & DYOR
Unlocking Trading Breakouts and Avoiding Costly Mistakes1. What Is a Breakout in Trading?
A breakout occurs when the price of a stock or asset moves outside a key support or resistance level with increased volume.
Resistance Breakout: Price moves above a resistance level (previous high or consolidation zone).
Support Breakout: Price drops below a support level (previous low or base).
This movement suggests that market sentiment is shifting—buyers or sellers are gaining control. A valid breakout often signals a new phase of volatility or the beginning of a strong trend.
For example, if a stock has been trading between ₹100 and ₹120 for weeks, a close above ₹120 on strong volume may signal a bullish breakout—potentially leading to a larger upside move.
2. Why Breakouts Matter
Breakouts often mark major transitions in supply and demand.
When price breaks above resistance, it shows that buyers have overpowered sellers.
When price breaks below support, it means sellers have overwhelmed buyers.
These moments attract large institutional traders and trigger algorithmic buying or selling. Breakout traders attempt to capture the early stage of a trend before the broader market catches on.
However, not every breakout leads to a sustainable move. Many fail quickly—these are known as false breakouts or “bull traps” and “bear traps.” Understanding how to differentiate them is key to success.
3. Characteristics of a Strong Breakout
To filter high-probability breakouts, traders should look for certain confirming signals:
a. High Volume
Volume is the heartbeat of any breakout. When price breaks a key level with high volume, it shows strong participation and conviction among traders. Low-volume breakouts often fail.
b. Tight Consolidation Before Breakout
A tight range or a base pattern (like a flag, pennant, or triangle) before breakout suggests accumulation or preparation for a major move.
c. Strong Close Beyond the Level
The price should close beyond the breakout point—not just spike intraday. Closing strength confirms that the breakout is genuine.
d. Favorable Market Context
Breakouts perform best in trend-supportive markets. A bullish breakout in a strong overall market (e.g., NIFTY 50 uptrend) has a higher chance of succeeding.
4. Common Types of Breakout Patterns
1. Horizontal Breakouts
Price breaks a flat support or resistance level, often after sideways movement or consolidation.
2. Trendline Breakouts
A long-standing trendline is breached, signaling a potential reversal or acceleration of momentum.
3. Chart Pattern Breakouts
Patterns like triangles, flags, rectangles, cups and handles, and head and shoulders often lead to breakouts. Each has its psychology of accumulation and release.
4. Volatility Breakouts
Price suddenly expands after a period of low volatility (e.g., after a squeeze on Bollinger Bands). Such breakouts are explosive but short-lived.
5. The Psychology Behind Breakouts
Understanding trader psychology is as important as chart analysis.
When price nears resistance, many traders expect rejection and place sell orders there. But once the price breaks above that level, short sellers are forced to cover, adding to buying pressure. Similarly, breakout traders jump in, driving price higher—a self-reinforcing cycle that fuels trends.
However, emotions can be dangerous. Many traders fear missing out (FOMO) and chase the price after the breakout has already extended too far. This often leads to losses when price retraces.
6. The Most Common Breakout Mistakes (and How to Avoid Them)
a. Entering Too Early
Jumping in before confirmation is a common trap. Wait for a daily or hourly candle close above resistance (or below support). Premature entries often get caught in false breakouts.
Solution: Be patient. Confirmation matters more than speed.
b. Ignoring Volume
Breakouts without volume often lack strength. Many traders ignore this and assume every move beyond a line is a breakout.
Solution: Use volume indicators (like Volume Profile or OBV) to confirm market participation.
c. No Stop-Loss Strategy
Many traders enter breakouts without pre-defined stop-loss levels, hoping the price will “eventually” go in their favor. This leads to big losses.
Solution: Always place a stop-loss just below the breakout point (for longs) or above it (for shorts). This protects against false breakouts.
d. Chasing Price
After the breakout, price may retest the breakout zone before resuming its trend. Impatient traders chase extended moves, only to see price pull back.
Solution: Wait for a retest or minor pullback before entering.
e. Ignoring Market Context
A breakout in a weak overall market is risky. Broader sentiment influences individual stock movement.
Solution: Align trades with broader trend direction. Bullish breakouts perform better in bull markets.
f. Over-Leveraging
Using high leverage amplifies both profit and loss. If the breakout fails, leveraged traders face margin calls.
Solution: Keep position sizes moderate—risk no more than 1–2% of capital per trade.
7. Smart Techniques to Trade Breakouts Effectively
a. Use Multi-Timeframe Analysis
Check higher timeframes (like weekly or daily) to confirm structure, and use lower ones (like 1-hour) for entries. This ensures alignment between short-term and long-term trends.
b. Employ Volume Profile
Volume Profile helps identify high-volume nodes (HVNs)—zones of strong support/resistance—and low-volume nodes (LVNs)—areas where breakouts are likely to accelerate.
c. Watch for Retests
Many valid breakouts come back to retest the broken level before continuing. This offers low-risk entry points.
d. Combine Momentum Indicators
Use RSI, MACD, or ADX to confirm momentum. If these show strength during breakout, chances of success rise.
e. Manage Emotions
Don’t let excitement or fear dictate action. Follow your trading plan strictly—discipline beats prediction.
8. Risk Management in Breakout Trading
Breakout trading works best with strict risk management because not all breakouts succeed.
Here’s how to manage risk effectively:
Stop-Loss: Place just beyond the opposite side of the breakout.
Position Sizing: Limit risk to 1–2% of capital per trade.
Trailing Stops: As price moves in your favor, trail your stop-loss to lock in profits.
Risk–Reward Ratio: Target at least 2:1. For every ₹1 risked, aim to gain ₹2.
Without proper risk control, even a few failed breakouts can wipe out profits from several successful ones.
9. Identifying False Breakouts
False breakouts happen when price temporarily breaches a key level and then reverses sharply. These are often caused by stop-hunting or lack of follow-through buying/selling.
How to Identify:
Breakout happens with low or average volume.
Price doesn’t close beyond the level.
Immediate reversal candle (like a shooting star or bearish engulfing).
How to Avoid:
Wait for confirmation on closing basis.
Avoid trading during major news events when volatility is erratic.
Use alerts instead of instant market entries.
10. Conclusion: Mastering the Art of Breakouts
Breakout trading offers tremendous potential—but only for disciplined traders who respect structure, volume, and risk. Successful breakout traders don’t chase—they anticipate, confirm, and control risk.
By focusing on volume confirmation, price structure, and broader trend context, you can distinguish between genuine and false breakouts. Equally important is patience—waiting for setups that align technically and psychologically.
Remember: every breakout is an opportunity, but only if you trade it with a plan. Stay objective, manage your emotions, and protect your capital. Over time, mastering breakout trading becomes less about prediction and more about precision—the art of entering when others hesitate and exiting when others panic.
BITCOIN TECH UPDATE: BEARISH DOMINATES MUST READ🚨 BTC TECH UPDATE: BEARISH DOMINATES MUST READ 🚨
CRYPTOCAP:BTC is down 14% from my bearish short at $115,000 retest.
✅ Those who shorted, well played.
✅ Those who avoided longing at the top, capital saved.
Price Action:
#BITCOIN hit 1st support and broke below, trend remains bearish.
Next target: $94,000.
Short-Term Relief:
Expect a bounce toward $105,000–$108,000 (retest + FVG zone) before the next leg down.
Longer-Term:
$94,000 key decision zone → potential drop to $76,000 if bearish momentum continues.
Will update with precision once $94k is reached.
Sentiment: Bearish as forecasted from $115k.
Bullish Trigger:
If BTC breaks $111,500 with HTF candle close, bullish scenario activates → potential ATH toward $150,000.
Trade smart. Watch levels. Manage risk.
Your move: Ride the bearish wave or wait for the relief rally?
NFA & DYOR

watch this trendline in BTCwe clearly havea trendline here, must hold 98k,
anyway looks like capitulation like IPOs, nowsecondvawe must begin imo
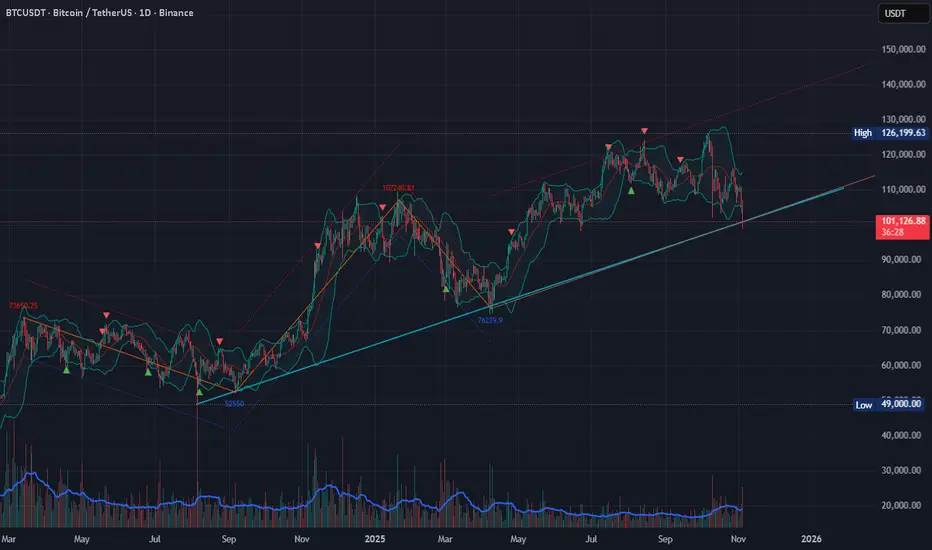
BTC First Weekly BB Break Since March: This Changes EverythingFirst Weekly BB Break Since March: This Changes Everything!
Bitcoin is currently testing a key support zone around $104K, forming what appears to be the 5th major support retest in this ongoing bullish cycle.
Historical Pattern Insight:
Each of the previous four support retests (1–4) led to substantial rallies ranging from +70% to +200%, as shown in the green zones.
If the pattern repeats, the next potential upside move (Wave 5) could project CRYPTOCAP:BTC toward the $200K region, marking a ~100% upside from current levels.
New Technical Development:
This week marks Bitcoin’s first breach of the lower Bollinger Band (BB) on the weekly timeframe since March, signaling heightened volatility and potential exhaustion of the current corrective phase.
Bearish Scenario:
A confirmed breakdown below this critical support could trigger a deeper correction toward the $50K area (–55%), similar to previous cycle corrections highlighted in red.
Key Levels to Watch:
🔹 Support: $103K–$100K
🔹 Resistance: $110K, then $135K
🔹 Upside Target: $200K
🔹 Downside Risk: $50K
Indicators:
Bollinger Bands remain squeezed, indicating volatility expansion is near. The weekly mid-band continues to act as dynamic support, but a sustained close below it could shift the bias short-term.
🟩 Bullish Bias remains valid above $100K, invalidated only on a weekly close below support.
🟩 Pattern repetition or deviation here will define Bitcoin’s next macro leg.
NFA & DYOR
