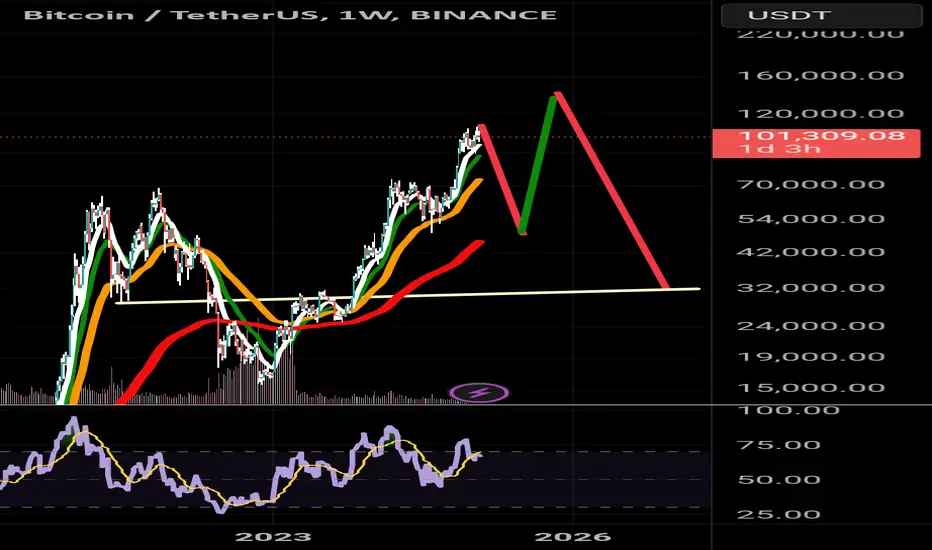
Is BTC not able to break new ATH and No Alt Season SADIf BTC not able to break New ATH with good volume and No Alt Season. Then this Scenario will be happen. I hope I am wrong. This Bull season has too pain
BTCUSDT.5L trade ideas
Bitcoin (BTC/USDT) Symmetrical Triangle Analysis: Next Move?Bitcoin (BTC/USDT) 4H Chart Analysis
Key Observations:
1. Symmetrical Triangle Pattern:
The chart shows a symmetrical triangle formation, characterized by converging trendlines.
This pattern typically signals a breakout, but the direction (up or down) depends on market momentum.
2. Current Price Action:
BTC is trading around $102,979.98 at the time of the chart.
It is above the 200 EMA ($100,003.64), indicating bullish strength.
The price recently bounced off support and is moving towards resistance.
3. Support and Resistance Levels:
Support: Around $97,785.55 (blue line).
Resistance: Around $109,636.60 (blue line).
4. Potential Scenarios:
Bullish Breakout:
If BTC breaks above the upper trendline, it may rally towards $109,636.60 or higher.
A confirmed breakout could push BTC to $112,500+.
Bearish Breakdown:
If BTC rejects at resistance and breaks downward, it could retest the $100,000 level or lower.
A breakdown could target $97,785.55 or even $95,000.
Final Thoughts:
Watch for a breakout or breakdown from the triangle pattern.
Volume is crucial—a high-volume breakout confirms strength, while low volume can indicate a fakeout.
If BTC stays above $100,000 (200 EMA support), the bullish bias remains intact.

BTC#8: Read BTC price line and trading plan
💎 💎 💎 Did you make a profit in the previous post #7? Like and follow the channel to follow the earliest trading plan. 💎 💎 💎
🔥 Let's plan for the next BINANCE:BTCUSD BINANCE:BTCUSDT 🔥
1️⃣ **Fundamental analysis:**
📊The Federal Reserve keeps interest rates unchanged
🚀Today is the expiration date of BTC futures
📌 US Senator Cynthia Lummis: will hold a public hearing on strategic Bitcoin reserves. This is important information. If BTC is accepted as a reserve asset. The cash flow into BTC will be huge in the near future.
2️⃣ **Technical analysis:**
🔹 **Frame D**: Once again, the price reacted in the 106xxx area. This test gives a weaker price reaction than the previous one.
🔹 **H4 frame**: The price has not surpassed 107xxx so it is not certain that BTC will break the peak.
🔹 **H1 frame**: The short-term price structure is still increasing. It is highly likely that the price will find the support zone below.
3️⃣ **Trading plan:**
⛔The price line has not completely escaped the SW zone, so if you participate in trading in this area, you must stick to the price structure.
✅ In my personal opinion, BTC will likely have another correction before it can break through the old peak. For the time being, we will wait for the price reaction at important support zones.
💪 **Wish you successful trading!**
📌 For any questions, please contact us directly. I am ready to answer you for free

A wise person will stop CRYPTO Soon after the oath of the so good person Mr Trump...crypto has gone out of control. Stay away from CRYPTO. Not only every person,every institution but even every country. Stay away. It is a scam. Save ur money. Listen to me. These bastards playing unfairly will be taken down someday,but till then stay away and use ur money for u

BTC#7: Will the price continue to break the peak? Trading plan💎 💎 💎 Did you make a profit in the previous post #6? Leave a comment and tag your friends to share. 💎 💎 💎
🔥Let's plan for the next BTC 🔥
1️⃣ **Fundamental analysis:**
📊 The US CFTC Chairman has launched a series of public roundtables, including topics such as digital assets. This predicts unforeseen fluctuations in the future.
🚀The BTC futures contract expiration date is approaching, plus the market's increasing demand to buy more BTC since Trump took office is the main driving force for the current uptrend
📌 The market is currently very sensitive to information related to BTC and government policies.
2️⃣ **Technical analysis:**
🔹 **D frame**: Yesterday ended with a pinbar that brought excitement to the market sentiment
🔹 **H4 frame**: Keylever has been broken, showing signs of a correction, but we still need confirmation at the resistance area above
🔹 **H1 frame**: The price has broken out of the triangle and is currently looking for important resistance zones. However, the current price structure is bullish.
3️⃣ **Trading plan:**
⛔As you can see, the main trend is important, even though the price has decreased, it still recovers quickly. At this time, absolutely do not FOMO when the price breaks the top and bottom because the price line needs confirmation. Wrong orders not only erode capital but also distort trading psychology, leading to wrong judgments
✅ In my personal opinion, the structural breakdown in the H4 frame shows signs that the market is likely to have a correction. In addition, because the price line has been increasing for a long time, adjustments to gain momentum to move to a higher price range are common
💪 **Wish you successful trading!**
📌 For any questions, please contact us directly. I am ready to answer you for free
👉 Follow to be updated with the earliest plans.

DeepSeek DUMP on BTC. A VIEW FROM THE PERSPECTIVE OF VOLUMEBINANCE:BTCUSDT
1. At point 1 on the price chart, we see a shooting star pattern during the formation of a range - a bearish signal
2. At point 2, we see the same pattern, which means a full-fledged bearish engulfment by sellers - a confirmation of the upcoming price drop.
3. At point 3, we can see the buyer's reaction, which causes the price to rebound from 97.778 to 102.112.
In terms of volume, there was a non-equivalent amount of sellers' volume - a bullish divergence.
EXPECTATIONS :
Scenario 1 (priority) - price rise from 99,000 to 102,000 with a range tightening and then a move to the upside
Scenario 2 - in the event of unfavourable news, 92,660 could be tested and a range formation possible

Bitcoin will fall back to $83,000 soon!Bitcoin has brocken out from the symmetrical triangle and took retest successfully and now moving down slowly. Hopefully we can see more dump on bitcoin and other alt coins soon 😊

BTC @ 99+ K Buying is visibleconsidering the last low and high then now price around 99+ K is between FIB buying levels of 50 and 61.8 levels where price seems to be holding for now which indicating some buying has been done. If price rise from here then it becomes wave 3 and price could easily move above 108K and making new ATH. one may consult your adviser or take your own decision for buying long positions in BTC at and below 99K. Below 100K is sure buying and no panic to sell considering all US and EU activities going on around crypto and BTC.

DOUBLE TOP 2025?My absolute bullish FIB fractal target ~ 222K
HOWEVER! Last cycle, the bull run from the bear low lasted 123 weeks. We are already 116 weeks from the most recent bear low. We have six more weeks until BTC made a local top last cycle from the bear low, and we are currently printing a bearish weekly divergence. I copy pastad the remaining candles from the last cycle, and I adjusted the scale to generally assume BTC will continue to face resistance around 110K, price will retrace more than 50% down to the order block, and the double top will happen 29 weeks after the first top like last time.
According to this charting, we will see a local upthrust to 120K mid March. I am assuming prices will retrace to around 58K, which would be such a gift. Sow some seeds in spring for fall harvest, I guess? Although it sounds bearish, we may see a local top of 128K. beginning the bear market the end of September 2025. Again assuming everything, BTC will bottom at around 36K, scaring MSTR investors for sure, early September 2026.
Alright. Enough of this analysis paralysis.

BTC is in a decision-making phase
Bitcoin is trending upward, with prices rising from about 90,000 USDT all the way to nearly 105,000 USDT. Since late January, Bitcoin prices are entering a converging triangle area. The area is limited by a descending trend line above and a support line below. The current performance of the market shows that price fluctuations are getting smaller and smaller, indicating that market participants are waiting for a clear breakout signal.
Support level: 91,361.70 USDT below, representing the recent low, this price has become a key support area. If Bitcoin prices fall below this support level, they may face greater downward pressure and even test lower support areas.
Resistance level: 107,813.12 USDT above the price is the main resistance level, forming the upper boundary of the current triangle consolidation. If Bitcoin prices break through this resistance level, it will be possible to launch a new upward wave again.
Currently, the price fluctuates above and below a gradually rising trend line, which is a typical triangle consolidation. In this form, the price usually enters a contraction range, and the fluctuation range gradually becomes smaller. At this point, we will closely watch whether the price breaks through the upper resistance line or falls below the lower support line. A breakout in either direction could bring a strong market reaction.
If Bitcoin breaks through the upper triangle resistance line of 107,813USDT, it may retest and break through the upper high, pushing the price to a higher area, with the target possibly close to 112,000 USDT or even higher.
If Bitcoin falls below the lower support line of 91,361.70 USDT, a strong downward trend may form, and the price may pull back to 90,000 USDT or even lower.
Overall, the current market pattern shows a typical triangle consolidation pattern, which means that Bitcoin may continue to consolidate in the short term until it breaks through the key price above or below.

As I told The bitcoin starting Bear rally nowIn previous posts i alert about the upcoming mega dump and here's is the result

BTC#6: SW is uncomfortable but coming to the breakthrough.💎 💎 💎 Plan #5 first helps you make a profit. Please leave a comment and tag your friends' names to share. 💎 💎 💎
1️⃣ ** Basic analysis: **
📊 Trump signed the executive command on cryptocurrencies: Clarifying the framework of management and discovery of national cryptocurrency reserves
Buffett of Buffett's Berkshire Hathaway is gradually grasping cryptocurrencies.
🚀 Ohio state proposes a Bitcoin reserve bill
📌 A series of information that brings optimistic psychology to the cryptocurrency market in general and BTC in particular.
2️⃣ ** Technical analysis: **
🔹 ** Frame D **: The price is still swing in the past few days
🔹 ** H4 **: Price structure is still increasing and has not changed.
🔹 ** Frame H1 **: The price is still swing in the triangle and progresses to the breakthrough
3️⃣ ** Transaction plan: **
⛔ This is the SW area that is not suitable for the command. It is difficult to predict the price line in the current area. Control greed.
✅ My personal opinion that about the structure of large and small frame prices is increasing. If there is a structure, we can confirm about a adjustment beat. The current trend should wait for Buy when the price is important.
💪 ** Wish you successful transactions! **
📌 Any questions please contact directly. I am ready to answer for free
#trading #trade #tradeindia #newtrader #newbie #Blockchain #Forex #tradingView #plants #trader #tradingforex #btcusd #bitcoin

BITCOIN EYES ON A BULLISH BREAKOUT (READ_CAPTION) !!💹 #BTCUSDT Analysis
📈 Bitcoin is showing signs of a bullish continuation pattern and is heading towards its support trendline. 🟢 If the price holds strong at this level, we could see price growth and a potential upward breakout. 🚀
🔥 Key Level: Support Trendline
🛑 Watch closely for confirmation before entering the market. Patience is key! 🧘♂️
Let’s see if Bitcoin is ready to take off! 🌟📊

BTC | GOLD | WEEKLY | PRICE ACTION ANALYSIS | HINDIThank you so much for watching my video on BTC and gold price action analysis. I really appreciate your time and support. I hope the analysis provided some useful insights into the market trends. Feel free to drop any questions or thoughts you may have

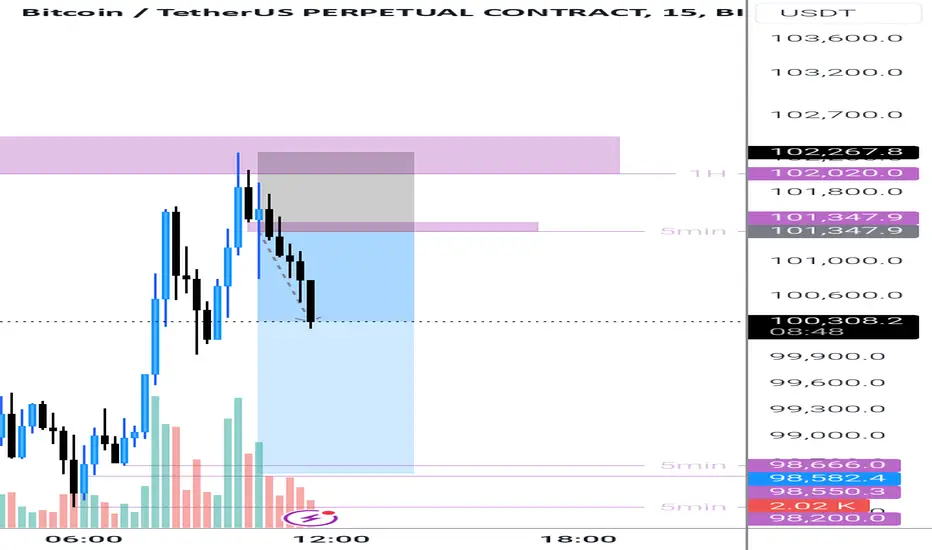
BTCUSDT-Short-15MinIn the 15-minute timeframe, first, identify and mark the order block. Then, wait for the order block to be mitigated. Once mitigation occurs, look for inducement signals. After identifying the inducement, switch to the 5-minute chart to wait for a confirmation of a Change of Character (CHoCH). Once the CHoCH is confirmed, mark the order block on the 5-minute chart. Wait for price to tap into this marked order block. Upon the tap, enter the trade with a stop-loss placed just above the last liquidity area. Set your profit target at the sell-side liquidity area.


Market trend is up So buy with Stop loss Market trend is up Last 24 hours chart see in 15 Minutes and See Slowly slowly down side move that indicates Market can go up side

BTC#5: Summary of trading plans for BTC💎 💎 💎 In post #4, we made the choice to stay on the sidelines. What do you think about this decision? Leave a comment 💎 💎 💎
Based on yesterday's price reaction. Today, I continue to bring you the BTC trading plan and price prediction in the coming time:
1️⃣ **Fundamental analysis:**
📊 In his speech, Trump did not mention cryptocurrencies or Bitcoin, which caused:
⚫Bitcoin decreased by 3.2%.
⚫Cryptocurrency Market Liquidations Hit $200M+
🚀 Google Cryptocurrency Searches Hit 5-Year High
📌 Acting SEC Chairman Mark Uyeda Announces New Crypto Task Force Led by Commissioner Hester Peirce to Develop a Clear Regulatory Framework for Crypto Assets
2️⃣ **Technical Analysis:**
🔹 **D Frame**: Although the price broke the previous high, the closing candle shows that the Resistance Zone is not completely broken
🔹 **H4 Frame**: We can see the appearance of the 2nd peak which is lower than the 1st peak. The price structure is still bullish.
🔹 **H1 Frame**: You can see the Sideway triangle I drew on the chart. The current price structure is still increasing
3️⃣ **Trading plan:**
⛔ Regarding the trend, everything is still in an increasing price structure. However, the price reaction at the old peak area and the market's upward momentum have "cooled down", so any possibility can happen and is mentioned in the H1 Plan
✅ In my personal opinion. The price line is likely to have an adjustment to gain momentum to overcome the old resistance zone. However, the structure has not been confirmed yet, so we still focus on finding opportunities to place BUY positions in accordance with the main trend of the market.
💪 **Wishing you successful trading!**
📌 For any questions, please contact us directly. I am ready to answer you for free
👉 Follow me to see the results

BTCUSDTBTC is in consolidation, so only small moves can be expected for a while. i think it will take the equal highs above and also 15 min liquidity. as it did not respect the 1h FVG, so the price may drop.

Buy trend withBitcoin pullback complete so continue change trend is buy si now buy it.
you can follow me 1 month then result showk.

BTC - Book Profits to re enter at lower priceThe much-awaited action from new president is getting delayed and it has caused bitcoin price to get rejected at previous high or not willing to spike up further. The much-wished banana spike does still not come. when we draw lines and see price is about to see small correction now. Its not safe to take fresh shorts but its good and safe to book profits now for sure. It will help to re enter at lower price below 98 or 92 K if it comes and any small lower levels compared to price at 107 or 106 K now. Take your own decision and any news from president office will move the price swiftly on either side. If you do not wish to take risk of losing your positions may hold on for days and do not mind missing the volatility opportunities.

BITCOIN 3 rd wave in progress.this weekly chart of BITCOIN has tried to capture its wave progression .
1st wave of of ungoing 3 rd wave is in progress.
2 nd wave in this main chart has retraced 50 percent of 1 st wave. in november 2022.
Now 5 th wave of 3 rd wave is in progree.
normally it should terminate at 127000.
This is not any trading recommendation.
It is my study only.
But bullishness of Botcoin is obvious.
If this study helps you like this post.
follow me to get updates.
