Bitcoin (BTCUSDT) – Bearish Setup Under ResistanceAfter the recent breakdown from 116,700 levels, BTC has been forming lower highs and consolidating in a range. The recovery towards 113,900 – 114,300 acted as a supply zone, leading to fresh selling pressure.
Currently, BTC is facing resistance near 111,100–112,000, marked in red on the chart. Price action shows repeated rejection and inability to sustain above this zone. The structure is developing into a descending channel (blue projection), indicating continued bearish momentum.
Trade Idea:
As long as BTC remains below 111,200, sellers are in control.
Expected price movement: gradual decline following the descending channel.
Short-term support is at 109,000 – 108,200.
Major downside target: 106,800.
Plan:
Entry Zone (Short): 110,800 – 111,200
Stop Loss: Above 112,100
Targets: 109,000 → 108,200 → 106,800
The bias remains bearish unless BTC reclaims 112,000+ with strong volume.
BTCUSDT.5S trade ideas

BTC LONG SETUPBTC/USDT – 1H Long Setup Analysis
🔹 Current Price: 111,653 USDT (Bitget Perpetual)
🔹 Trend: After a sharp drop from recent highs, BTC is showing signs of forming a base with a possible rebound setup.
⸻
Key Observations:
1. Support Zone:
• Strong support is visible around 110,744 – 110,747 USDT, marked by previous demand and horizontal structure.
• Below that, deeper support lies near 109,383 – 108,534 USDT.
2. Resistance Levels / Targets:
• TP1: ~115,078 – 115,980 USDT
• TP2: ~117,340 – 118,165 USDT
• Higher extension target: ~119,810 USDT
3. Trend Structure:
• Price broke a rising channel but has bounced back after a correction.
• Current pullback is retesting demand, indicating potential continuation to the upside if bulls defend the base.
4. Indicators:
• EMA 9 (blue) is currently under pressure, suggesting short-term weakness, but if reclaimed, momentum could shift bullish.
• Volume shows increased activity at recent lows, hinting at accumulation.
⸻
Long Trade Plan (Swing Bias):
✅ Entry Zone: Between 111,000 – 111,700 USDT (current price zone, near support)
✅ Stop-Loss: Below 110,744 USDT (to avoid fakeouts)
✅ Take Profit Targets:
• TP1 → 115,078 – 115,980 USDT
• TP2 → 117,340 – 118,165 USDT
• Extended TP → 119,810 USDT
📊 Risk-Reward Ratio: Favorable (approx. 1:3+ if targeting TP2).
⸻
Summary:
BTC is consolidating above a strong support base. If bulls hold the 111K–110.7K zone, upside targets remain valid towards 115K–118K. A break below 110.7K would invalidate this setup and could push price toward 109K or lower.

BTC Crashes to 3-Week Low: A True Nerve Test for TradersHello fellow traders, Bitcoin has entered an extremely tense phase!
BTC has slipped below 109,000 USD, marking its lowest point in three weeks. The main pressure comes from the looming expiry of a massive 22-billion-USD options contract at the end of the month, which is driving strong short-term selling.
On the daily chart, prices keep getting rejected at the downtrend line and the Ichimoku cloud, confirming that bears still hold the upper hand.
The current scenario points to further downside, with key support zones at 104,000 USD (TP1) and 98,900 USD (TP2).
These are the critical “do-or-die” levels to watch closely — only if BTC manages to hold above them can we expect a recovery once the options-driven selling pressure eases.
In short: Bitcoin is at a make-or-break moment. Traders, keep your stops tight and stay alert!

BTCUSDT Daily & 1H Analysis: Potential Surge to $100K & Scalping🌹🌹Daily Chart: We’re observing the completion of wave ‘c’ in an ABC pattern. This suggests a potential price surge towards $100,000, marking the end of wave ‘c’ and aligning with our drawn channel’s lower boundary.
1-Hour Chart: The market has been consolidating within a tight range, typical for low-volume days, forming a distinct box range. A decisive break above the resistance or below the support, with confirmation, will offer clear trading opportunities.
Bearish Outlook: Despite a sharp recent decline, the probability of further downside remains higher. This supports a strong entry for short positions.
Bullish Scenario: If the price breaks above the range resistance and confirms with good volume, a less aggressive long position could be considered. This might signal the start of a corrective wave, potentially facing resistance around the
113
𝐾
−
113K−
114K area. This zone features a significant trading cluster (order block) that, if it accumulates liquidity, could lead to a powerful move. This aligns with the 61% daily Fibonacci retracement and the 71% 1-hour Fibonacci level.
Key Takeaway for Traders: Amidst selling pressure and significant liquidations, focus on trend-aligned opportunities. Long positions should be treated purely as scalps.
Stay prosperous!👍🌹

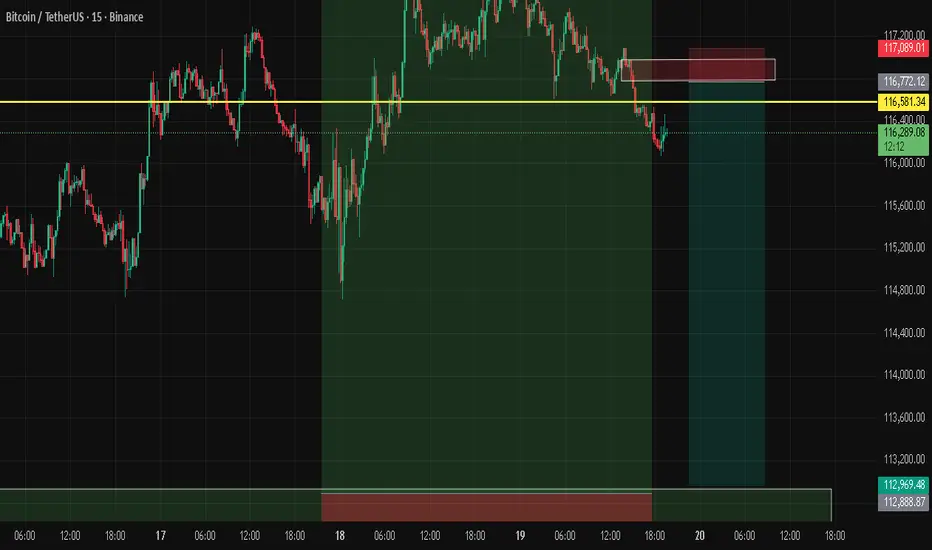
[SeoVereign] BITCOIN BEARISH Outlook – October, 03 2025The core basis for presenting a bearish perspective in this idea consists of two main points.
First, within the Double Zigzag pattern, each zigzag forms a 1:1 length ratio.
WAVE.Y1=WAVE.Z1
For easier identification, I have illustrated this section in the chart below.
The second is ZIF.
ZIF (Zone of Interpretive Freedom) is a concept I devised myself, and it refers to the price range between the 1.0 ratio and the 1.414 ratio when Fibonacci retracement is drawn.
This range serves as a critical zone for determining the validity of the idea, and as long as the range is not breached, the strategy is considered to remain valid. Also, the closing basis of ZIF is the daily candle’s closing price.
Simply moving outside of ZIF does not immediately invalidate the perspective.
Although the high of September 18 has been broken upward as of the current point in time, I regard this upward breakout as a false breakout (whipsaw).
The reason is that leading altcoins are moving sideways, failing to follow Bitcoin’s movement, and are showing declining momentum.
Accordingly, the average target price is set around 112.970 USDT.
Additional briefings will be continuously updated to this idea as the chart develops.

[SeoVereign] BITCOIN BEARISH Outlook – September 30, 2025Hello everyone,
Today, as of September 30, I would like to share my perspective on a Bitcoin short position. Once again, I am leaning toward the possibility of a decline, and the basis for this view consists of two main points.
First, from the perspective of Elliott Wave Theory, the ongoing 5th wave shows a 0.786 length ratio relative to the 1st wave. Traditionally, the 5th wave often has a specific proportional relationship with the 1st or 3rd wave, with the most ideal ratios being known as 0.618, 1.0, or 1.618. However, in actual markets, more unconventional ratios frequently appear, and one of these is precisely the 0.786 ratio structure of the 5th wave. While this ratio is not the textbook standard, it reflects market participants’ psychology and is repeatedly observed, which makes it a sufficiently valid analytical basis. In particular, at the current stage, the strength of the 5th wave’s advance is gradually weakening, and the typical characteristics of the end of a wave, such as the fading of buying momentum, are also being observed.
Second, a 1.13 ALT BAT pattern, one of the harmonic patterns, has formed. While the standard BAT pattern is based on the 0.886 level, the modified ALT BAT pattern sets the 1.13 point as the critical turning area, forming a Potential Reversal Zone (PRZ). In the current chart, a price reversal is indeed observed at the 1.13 point, which can be regarded as a strong signal where pattern theory and real market movement align. This situation is not a mere coincidence but indicates that selling pressure has intensified in an area where supply zones and psychological resistance are concentrated.
Based on these two factors, I set the average target for this decline around 111,633. Of course, since the market is fluid, I will continue to verify the validity of this idea as the chart develops and update it as necessary.
Thank you for reading.

BTC Long Setup – Black Line Reclaim & Demand Zone BounceBTC reached the green demand zone after the decline from 116,700.
Price stabilized near the black trend line (~112,000) – key bullish reclaim trigger.
Trade Details (Educational)
Entry (Long): Near black trend line (~112,000) after confirmation of demand.
Stop Loss: Below green demand zone (~111,100).
Targets: Recovery toward 113,900 → 114,300 supply zone.
Takeaways
1️⃣ Clear reclaim or confirmation needed before switching bias.
2️⃣ Combining major demand zone with trend line reclaim can signal a high-probability long setup.
3️⃣ Structure-based reversals possible even after a downtrend.
⚠️ Educational content only – not financial advice.

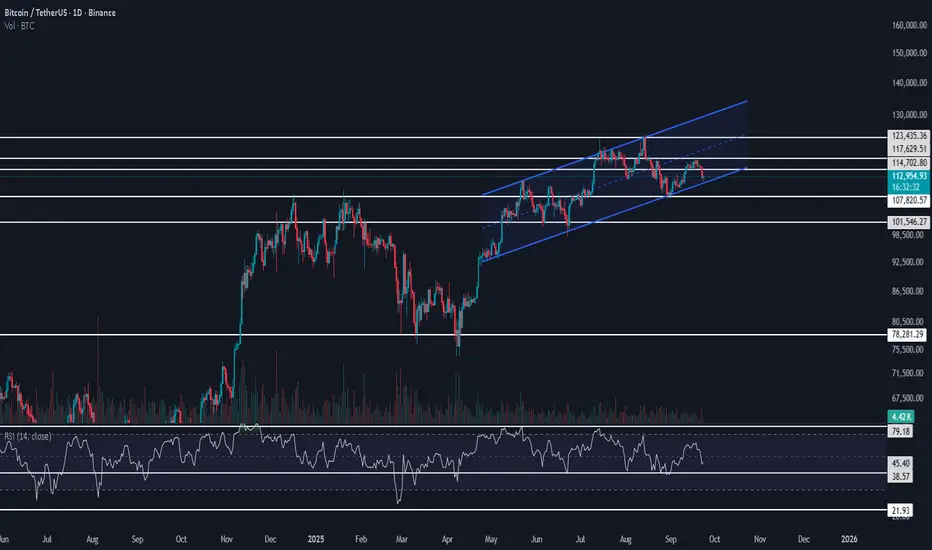
BTCUSDT Technical AnalysisBitcoin (BTCUSDT) has broken below its ascending channel with a strong bearish candle, confirmed by notable trading volume. At the same time, the RSI also lost the 36.12 support level, signaling weakness in momentum. From here, we can consider two main scenarios:
Scenario 1: Fake Breakdown
If the $107,820.57 support holds as a fake-out, it would indicate strong buyer presence.
This would provide a potential long entry opportunity, anticipating a bounce back toward the channel highs.
Scenario 2: Confirmed Breakdown
If BTC decisively breaks and closes below $107,820.57, it could trigger further downside.
A short position could be considered here, but with reduced risk, as the overall long-term trend remains bullish.
📌 For now, traders should wait for confirmation before committing to either direction.

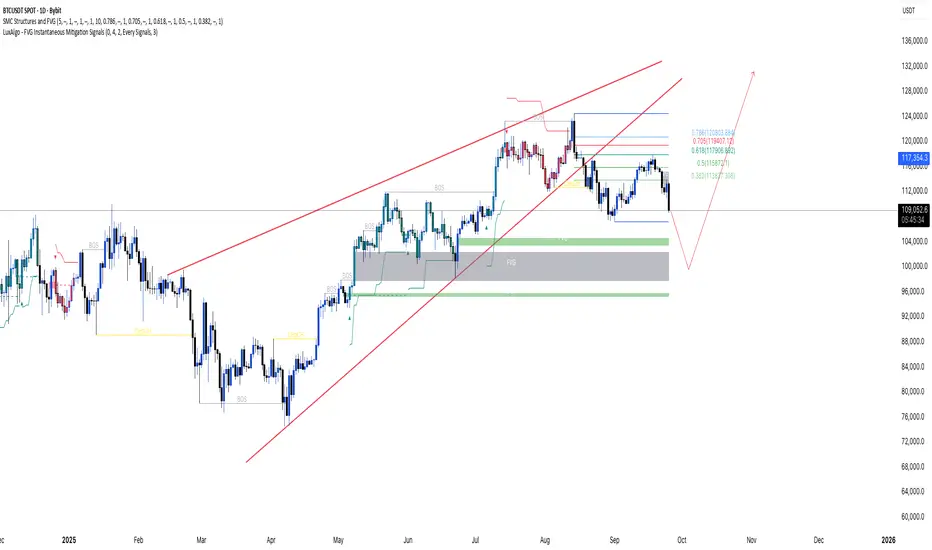
BTCUSDT Daily structure: liquidity run below 107k?Pair: BYBIT:BTCUSDT
Timeframes: 1D context, 4H execution
Type: Educational market study
Thesis
After printing a rising-wedge into ATH and breaking down, price is in a corrective leg within a higher-timeframe uptrend. I’m watching for a controlled pullback toward 107–106k A deeper flush could reach the D1 imbalance/demand around 101–104k, with a max-draw scenario toward 98K, If today’s daily close reclaims 111K, the near-term bounce path opens toward 115k, aligning with the 0.5–0.618 retracement cluster.
Market structure & SMC read
* Trend: HTF uptrend intact on D1/W1; local distribution after ATH.
* Pattern: Rising wedge into ATH, then breakdown and retest of the lower boundary.
* BOS/CHOCH: Most recent BOS occurred on the run to ATH; current move is corrective.
Supply/Demand:
Shallow demand: 106–107k.
Primary D1 demand/FVG: 101–104k.
* Liquidity: Resting liquidity sits below recent equal lows at 106–107k and deeper toward 98–100k. Overhead liquidity and confluence cluster around 113.9k / 115.8k / 117.9k / 119.4k / 120.8k (Fib 0.382→0.786).
Key levels
* Supports: 107.0k, 106.0k, 101–104k FVG, 98.0k.
* Reclaim gate:111k(daily close).
* Fib/targets: 0.382 -113.9k, 0.5 -115.8k, 0.618- 117.9k, 0.705-119.4k, 0.786 -120.8.
Scenarios
A) Base case: Dip then bounce
1. Sweep into 107–106k to clear local lows.
2. LTF **CHOCH/BOS** back above 107.5k with absorption tails.
3. Path: 111k reclaim → 113.9k** → 115.8k; stretch 117.9k.
B) Deeper flush: FVG mitigation
1. Failure to hold 106k on a D1 close opens 101–104k demand/FVG fill.
2. LTF confirmation from that block targets 109–111k first, then the Fib cluster.
3. 98k is the outer guardrail; a daily close below weakens the broader bullish case.
C) Immediate reclaim: Momentum continuation
* A daily close above 111k without tagging 106k first suggests strong demand. Look for follow-through toward **115.8k**, monitor reactions at 117.9k–120.8k.
Trigger criteria (educational, not signals)
* Price action: Liquidity sweep of 106–107k followed by LTF CHOCH/BOS back into structure.
* Volume:** Effort vs. result divergence on the dip or visible absorption at demand.
* Indicators (optional): RSI failure swing on LTF, session VWAPreclaim, MA(20/50) compression then expansion on the reversal impulse.
Risk framing (hypothetical)
* Define risk below the swept swing if engaging 106–107k; wider risk below 101k if waiting for the FVG fill.
* Initial R:R around 1:2 into 111k; scale at 113.9k, leave runner toward 115.8k.
Seasonal context
September often delivers corrective flows; Q4 has historically skewed bullish. This view aligns with a September pullback resolving into Q4 continuation, provided 98–101k remains protected on daily closes.
Chart notes
* Rising wedge into ATH, breakdown and retest
* D1 demand/FVG 101–104k and shallow demand 106–107k
* Fibonacci confluence 113.9k → 120.8k
Disclaimer : This is an educational market study, not financial advice. Do your own research and risk management.
BTCUSDTBitcoin has formed an head and shoulders with 0.5-0.61 ribb rejection recently.
Look for shots only upto 97k

[SeoVereign] BITCOIN BEARISH Outlook – September 30, 2025Today, as of September 30, I am writing to share my bearish perspective on Bitcoin with a short position.
In this idea as well, I am leaning toward a decline. There are two main reasons for this.
First, the 1.13 ALT BAT pattern. This harmonic pattern has already been confirmed, but since the detailed Fibonacci ranges do not fully match, we cannot rule out the possibility of one more upward wave. Therefore, I am first entering a short position with only a small portion, and then plan to flexibly increase the position depending on the price action. In other words, if the decline unfolds immediately, my analysis will be accurate; on the other hand, I also judge that there is a sufficient possibility of one more short-term wave forming before a reversal to the downside.
Second, the downward breakout of the trendline. Rather than analyzing the harmonic pattern independently, I prefer to combine it with trendline analysis. This is due to the flexible nature of harmonic theory, and through trendlines I can measure both the reference points for position sizing and the strength of momentum.
For these reasons, I entered the first short position, with an average target price set at 110,500 USDT.
Recently, not only the stock market but also the cryptocurrency market as a whole has been in poor condition. I hope that those who are experiencing losses will soon encounter better conditions, and I also hope that sharing my perspective can provide even a small help.
I will continue to update my ideas in line with the chart developments and transparently share my thoughts.
Thank you for reading.

BTCUSD Bitcoin USD has tried to take liquidity below the weekly FVG.After taking liquidity at the bottom, it turns bullish towards the top on demand at the bottom. After taking the liquidity of the niche, it can give an upward rally in the demand of the down. After taking the liquidity of the down, it can give an upward rally in the demand of the niche.

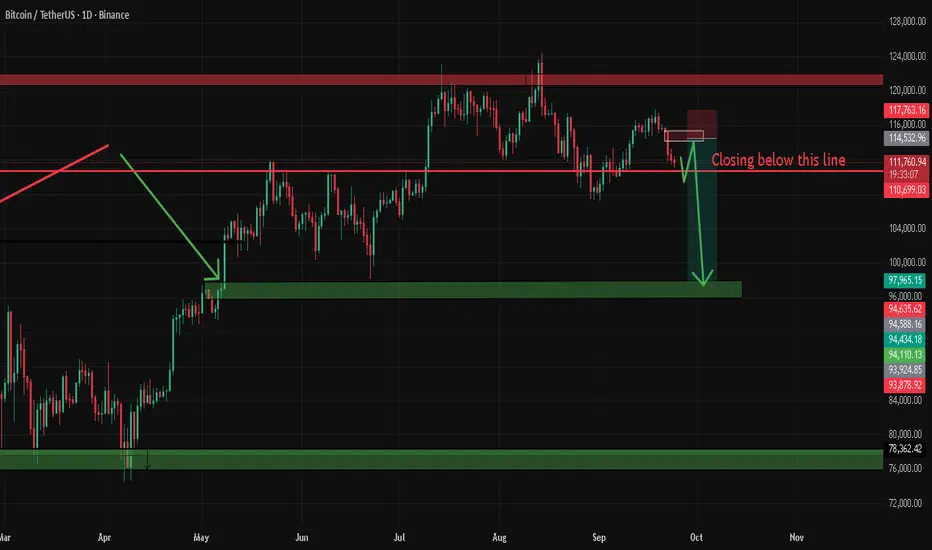
btc short entry waiting for closing as you can clearly see why i have marked demand and supply and pretty sure for a short trade once it closed below that red line
BTCUSDT – Possible Bounce Back Zone Ahead?Title:
🚀 BTCUSDT – Possible Bounce Back Zone Ahead?
Description / Note:
Bitcoin is at a decisive point. If price loses the Bull Market Support Band, the next key area of interest may be the 50-week SMA, currently lining up near the $100K region.
Why it matters:
📌 The 50-week SMA has been a reliable dynamic support in past market cycles.
📌 The ongoing bull flag formation suggests potential continuation after consolidation.
📌 Previous trendlines also converge in this area, adding confluence.
In short:
If BTC fails to hold the Bull Market Support Band, watch the 50-week SMA near $100K as a potential bounce-back zone.

BTC/USDT Outlook – Volatility Rises After Sharp DeclineBTC/USDT Market Report
Bitcoin recently faced heavy selling pressure, pushing the market into a sharp decline. This drop reflects a shift in sentiment where earlier stability has been replaced by increased volatility and downside momentum.
Price action shows signs of exhaustion after the fall, suggesting the possibility of a short-term rebound attempt. However, broader behavior still reflects uncertainty, with buyers needing stronger participation to shift momentum back in their favor.
If downward pressure continues, deeper corrections could emerge before any meaningful recovery. In the near term, traders should expect sharp swings as the market tries to stabilize.

Part 8 Trading Master Class1. Core Option Trading Strategies
These are the foundational option strategies every trader must know. They are relatively simple, easy to implement, and help beginners understand how options behave in different market conditions.
1.1 Covered Call Strategy
What It Is:
A covered call involves owning the underlying stock and simultaneously selling (writing) a call option on the same stock.
How It Works:
Suppose you own 100 shares of TCS at ₹3,500 each. You sell a call option with a strike price of ₹3,700, receiving a premium of ₹50 per share.
If TCS rises above ₹3,700, you may have to sell your stock at ₹3,700, but you keep the premium.
If TCS stays below ₹3,700, you keep both the stock and the premium.
Best Used When:
You expect the stock to remain flat or rise slightly.
Advantages:
Generates regular income (option premiums).
Provides partial downside protection.
Risks:
Limits profit if the stock price rises sharply, because you must sell at the strike price.
1.2 Protective Put (Married Put)
What It Is:
A protective put involves owning the underlying stock and buying a put option to hedge against potential losses.
How It Works:
Imagine you own 100 shares of Infosys at ₹1,600. To protect yourself from a market downturn, you buy a put option at ₹1,550 by paying a premium of ₹30.
If Infosys drops to ₹1,400, you can still sell at ₹1,550 (limiting your losses).
If Infosys rises, your put option expires worthless, but your stock gains.
Best Used When:
You’re bullish long-term but worried about short-term downside risk.
Advantages:
Insurance against big losses.
Peace of mind for long-term investors.
Risks:
Premium cost reduces net profit.
1.3 Long Call
What It Is:
Buying a call option when you expect the stock price to rise.
How It Works:
Suppose Nifty is at 24,000. You buy a call option at a strike of 24,200 for a premium of ₹100.
If Nifty rises to 24,500, your option is worth 300 points (500 – 200), making a profit.
If Nifty stays below 24,200, your option expires worthless and you lose the premium.
Best Used When:
You’re bullish on the market/stock.
Advantages:
Limited risk (only the premium).
High profit potential if the stock rises sharply.
Risks:
Options can expire worthless.
Time decay works against you.
1.4 Long Put
What It Is:
Buying a put option when you expect the stock price to fall.
How It Works:
Say HDFC Bank is trading at ₹1,600. You buy a put option at strike ₹1,580 for a premium of ₹25.
If HDFC falls to ₹1,520, you profit from the difference.
If it stays above ₹1,580, you lose only the premium.
Best Used When:
You’re bearish on the stock/market.
Advantages:
Limited risk, big profit potential if the stock falls sharply.
Can be used as portfolio insurance.
Risks:
Options lose value quickly if the stock doesn’t move.
1.5 Cash-Secured Put
What It Is:
Selling a put option while holding enough cash to buy the stock if assigned.
How It Works:
Suppose you want to buy Reliance shares at ₹2,300, but it’s trading at ₹2,400. You sell a put option at ₹2,300 for a ₹40 premium.
If Reliance falls below ₹2,300, you must buy it at ₹2,300 (your target price), and you also keep the premium.
If Reliance stays above ₹2,300, you don’t buy it, but you still keep the premium.
Best Used When:
You’re bullish on a stock but want to buy it cheaper.
Advantages:
Generates income if the stock doesn’t fall.
Lets you buy stock at your desired entry price.
Risks:
Stock could fall far below strike price, leading to losses.
1.6 Collar Strategy
What It Is:
A collar combines owning stock, buying a protective put, and selling a covered call.
How It Works:
You hold Infosys stock at ₹1,600.
You buy a put at ₹1,550 (insurance).
You sell a call at ₹1,700 (income).
This creates a “collar” around your stock’s possible price range.
Best Used When:
You want protection but are willing to cap profits.
Advantages:
Reduces risk with limited cost.
Works well in uncertain markets.
Risks:
Limited upside profit.
Complex compared to basic strategies.

BTCUSDT Technical AnalysisBitcoin is currently moving inside a bullish ascending channel, which is aligned with its previous upward momentum. If the upper boundary of the channel breaks, we can consider this structure as a bullish flag breakout, signaling continuation to the upside.
The High Wave Cycle (HWC) trend remains bullish, and for now, every pullback is seen as a buying opportunity for long positions. I’m not looking for shorts at this stage unless we see a clear break of the channel’s lower boundary followed by consolidation, which would confirm a structural shift.
At the same time, as Bitcoin approaches the lower boundary of the channel, the RSI is testing its own support zone. If today’s daily candle closes with healthy volume, it would strengthen the case for long positions in the upcoming sessions.
🔥 Trading Plan
Focus on long positions while the bullish channel holds.
Watch channel resistance for breakout confirmation (bullish flag scenario).
In case of a break below channel support → shift focus to short setups.
RSI support + volume confirmation = potential strong long entry.
#Bitcoin #BTCUSDT #CryptoTrading #PriceAction #TechnicalAnalysis #TradingView #BullishTrend #CryptoSignals
Part 1 Master Candlestick PatternIntroduction
Options trading has always attracted traders and investors because of its flexibility, leverage, and the ability to profit in both rising and falling markets. Unlike simple stock buying, where you purchase shares and wait for them to rise, options allow you to speculate, hedge, or even create income-generating strategies. But this flexibility comes at a cost: risk.
In fact, while options provide opportunities for huge rewards, they also carry risks that can wipe out capital quickly if not managed properly. Many new traders get lured by the promise of quick profits and ignore the hidden dangers. The truth is, every option trade is a balance between potential gain and potential loss — and understanding the nature of these risks is the first step to trading responsibly.
In this guide, we’ll explore all major types of risk in options trading — from market risk and time decay to volatility traps, liquidity issues, and even psychological mistakes.
1. Market Risk – The Most Obvious Enemy
Market risk is the possibility of losing money due to unfavorable price movements in the underlying asset. Since options derive their value from stocks, indices, currencies, or commodities, any sharp move against your position can create losses.
For call buyers: If the stock fails to rise above the strike price plus premium, you lose money.
For put buyers: If the stock doesn’t fall below the strike price minus premium, the option expires worthless.
For sellers (writers): The risk is even greater. A short call can lead to unlimited losses if the stock keeps rising, and a short put can cause heavy losses if the stock collapses.
👉 Example:
Suppose you buy a call option on Reliance Industries with a strike price of ₹3,000 at a premium of ₹50. If the stock stays around ₹2,950 at expiry, your entire premium (₹50 per share) is lost. Conversely, if you had sold that same call, and the stock shot up to ₹3,300, you’d lose ₹250 per share — far more than the premium you collected.
Lesson: Market risk is unavoidable. Every trade needs a pre-defined exit plan.
2. Leverage Risk – The Double-Edged Sword
Options provide huge leverage. You control a large notional value of stock by paying a small premium. But this magnifies both profits and losses.
A 5% move in the stock could mean a 50% change in the option’s premium.
A trader who overuses leverage can blow up their capital in just a few trades.
👉 Example:
With just ₹10,000, you buy out-of-the-money (OTM) Bank Nifty weekly options. If the market moves in your favor, you might double your money in a day. But if it goes the other way, you could lose everything — and very fast.
Lesson: Leverage is powerful, but without discipline, it’s deadly.
3. Time Decay Risk – The Silent Killer (Theta Risk)
Options are wasting assets. Every day that passes reduces their time value, especially as expiry nears. This is called Theta decay.
Option buyers suffer from time decay. Even if the stock doesn’t move, the option premium keeps falling.
Option sellers benefit from time decay, but only if the market stays within their expected range.
👉 Example:
You buy an at-the-money (ATM) Nifty option one week before expiry at ₹100. Even if Nifty stays flat, that option could drop to ₹40 by expiry simply because of time decay.
Lesson: If you are an option buyer, timing is everything. If you are a seller, time decay works in your favor, but risk still exists from sudden moves.
4. Volatility Risk – The Invisible Factor (Vega Risk)
Volatility is the heartbeat of options pricing. Higher volatility means higher premiums because there’s a greater chance of large price moves. But this creates Vega risk.
If you buy options during high volatility (like before elections, results, or big events), you may pay inflated premiums. Once the event passes and volatility drops, the option’s value can collapse, even if the stock moves as expected.
Sellers face the opposite problem. Selling options in low volatility periods is dangerous because any sudden jump in volatility can cause premiums to spike, leading to losses.
👉 Example:
Before Union Budget announcements, Nifty options trade at very high premiums. If you buy expecting a big move, but the budget turns out uneventful, volatility drops sharply, and the option loses value instantly.
Lesson: Never ignore implied volatility (IV) before entering an option trade.

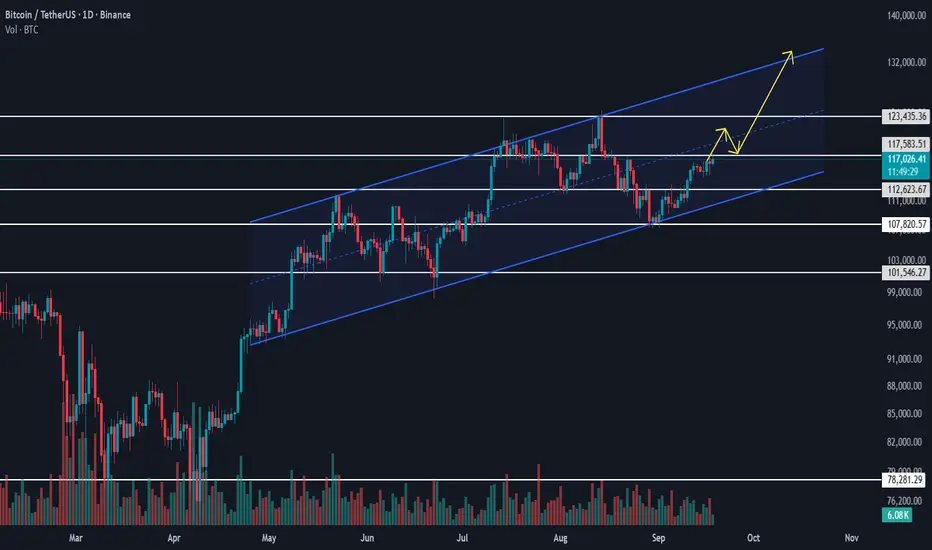
BTC/USDT Analysis📊 BTC/USDT Analysis
Since yesterday, Bitcoin (BTC) has not shown any significant movement and continues to consolidate within its bullish ascending channel. The market structure remains intact, and our previous analysis is still valid.
The key trigger level to watch is 117,583.51. A confirmed breakout above this resistance would provide a strong long entry signal, opening the path for continuation towards higher resistances and potentially activating broader bullish momentum.
Until this breakout occurs, BTC is expected to remain within the channel, with downside supported by the channel’s lower trendline.
📌 Key Levels to Watch
Resistance/Trigger: 117,583.51
Support: Channel lower trendline & 107,820.57
🔥 Trading Bias:
Remain patient inside the channel. Bullish confirmation comes with a breakout above 117,583.51, aligning with the broader uptrend.
Financial Market Types: An In-Depth Analysis1. Overview of Financial Markets
Financial markets can be broadly defined as venues where financial instruments are created, bought, and sold. They play a vital role in the economy by:
Facilitating Capital Formation: Allowing businesses to raise funds for investment through equity or debt.
Price Discovery: Determining the fair value of financial assets based on supply and demand.
Liquidity Provision: Enabling participants to buy or sell assets quickly with minimal price impact.
Risk Management: Allowing the transfer of financial risk through derivative instruments.
Efficient Resource Allocation: Channeling funds from savers to those with productive investment opportunities.
Financial markets are diverse and can be categorized based on the type of instruments traded, the trading mechanism, and the time horizon of the assets.
2. Classification of Financial Markets
Financial markets are typically classified into several types:
Capital Markets
Money Markets
Derivative Markets
Foreign Exchange Markets
Commodity Markets
Insurance and Pension Markets
Primary and Secondary Markets
Organized vs. Over-the-Counter (OTC) Markets
Each of these markets has distinct characteristics, participants, and functions.
2.1 Capital Markets
Capital markets are financial markets where long-term securities, such as stocks and bonds, are traded. They facilitate the raising of long-term funds for governments, corporations, and other institutions.
2.1.1 Equity Market (Stock Market)
Definition: A market where shares of publicly held companies are issued and traded.
Functions:
Provides a platform for companies to raise equity capital.
Allows investors to earn dividends and capital gains.
Examples: New York Stock Exchange (NYSE), National Stock Exchange of India (NSE), London Stock Exchange (LSE).
Participants: Retail investors, institutional investors, brokers, regulators.
2.1.2 Debt Market (Bond Market)
Definition: A market where debt securities such as government bonds, corporate bonds, and municipal bonds are traded.
Functions:
Helps governments and corporations borrow money at a fixed cost.
Provides investors with stable income through interest payments.
Types of Bonds:
Treasury Bonds
Corporate Bonds
Municipal Bonds
Participants: Governments, corporations, financial institutions, pension funds.
2.1.3 Features of Capital Markets
Long-term in nature (usually over one year)
Supports economic growth through capital formation
Includes both primary (new securities issuance) and secondary markets (existing securities trading)
2.2 Money Markets
The money market is a segment of the financial market where short-term debt instruments with maturities of less than one year are traded. It is crucial for maintaining liquidity in the financial system.
2.2.1 Instruments in Money Market
Treasury bills (T-bills)
Commercial papers (CPs)
Certificates of deposit (CDs)
Repurchase agreements (Repos)
2.2.2 Functions of Money Markets
Provides short-term funding for governments, banks, and corporations.
Helps control liquidity in the economy.
Serves as a tool for monetary policy implementation by central banks.
2.2.3 Participants
Commercial banks
Central banks
Corporations
Mutual funds
2.3 Derivative Markets
Derivative markets involve contracts whose value derives from an underlying asset, such as stocks, commodities, currencies, or interest rates.
2.3.1 Types of Derivatives
Futures: Agreements to buy or sell an asset at a predetermined price in the future.
Options: Contracts giving the right, but not the obligation, to buy or sell an asset.
Swaps: Agreements to exchange cash flows or financial instruments.
Forwards: Customized contracts to buy or sell an asset at a future date.
2.3.2 Functions of Derivative Markets
Risk hedging for investors and firms
Price discovery for underlying assets
Arbitrage opportunities to exploit market inefficiencies
Speculation for profit
2.3.3 Participants
Hedgers (businesses, farmers, exporters)
Speculators
Arbitrageurs
Brokers and clearinghouses
2.4 Foreign Exchange (Forex) Markets
The foreign exchange market is a global decentralized market for trading currencies. It is the largest financial market in the world by volume.
2.4.1 Features
Operates 24 hours across major financial centers
Highly liquid due to global participation
Involves currency pairs (e.g., USD/EUR, USD/JPY)
2.4.2 Functions
Facilitates international trade and investment
Enables currency hedging and speculation
Determines exchange rates through supply-demand mechanisms
2.4.3 Participants
Commercial banks
Central banks
Multinational corporations
Forex brokers
Hedge funds
2.5 Commodity Markets
Commodity markets are platforms for buying and selling raw materials and primary products. They can be physical (spot) or derivative-based (futures).
2.5.1 Types of Commodities
Agricultural: Wheat, rice, coffee, cotton
Energy: Crude oil, natural gas
Metals: Gold, silver, copper
2.5.2 Functions
Price discovery for commodities
Risk management through hedging
Investment opportunities for diversification
2.5.3 Participants
Farmers and producers
Consumers (manufacturers)
Speculators
Commodity exchanges (e.g., CME, MCX)
2.6 Insurance and Pension Markets
While not traditionally thought of as trading markets, insurance and pension funds mobilize long-term savings and provide risk management.
Insurance Markets: Provide protection against financial loss.
Pension Markets: Offer long-term retirement savings investment opportunities.
Participants: Insurance companies, pension funds, policyholders.
2.7 Primary vs. Secondary Markets
2.7.1 Primary Market
Deals with the issuance of new securities.
Companies raise fresh capital through Initial Public Offerings (IPOs) or debt issuance.
Example: A company issuing bonds for infrastructure development.
2.7.2 Secondary Market
Deals with the trading of already issued securities.
Provides liquidity to investors.
Examples: Stock exchanges, bond trading platforms.
2.8 Organized vs. Over-the-Counter (OTC) Markets
Organized Markets: Centralized exchanges with standardized contracts (e.g., NYSE, NSE, CME).
OTC Markets: Decentralized markets where trading is done directly between parties. Typically used for derivatives, forex, and certain debt instruments.
3. Participants in Financial Markets
Financial markets involve a wide range of participants, each with distinct roles:
Individual Investors: Retail traders who invest for personal financial goals.
Institutional Investors: Mutual funds, insurance companies, pension funds, and hedge funds.
Brokers and Dealers: Facilitate transactions and provide market liquidity.
Governments and Central Banks: Influence markets through policy and regulation.
Corporations: Raise capital and manage financial risks.
4. Functions of Financial Markets
Financial markets are crucial for economic development:
Efficient Allocation of Resources: Capital flows to projects with the highest potential.
Liquidity Creation: Investors can convert assets into cash quickly.
Price Discovery: Markets determine asset prices based on supply and demand.
Risk Sharing: Derivatives and insurance allow for hedging financial risk.
Economic Growth: By mobilizing savings and facilitating investments, financial markets drive growth.
5. Conclusion
Financial markets are a complex ecosystem of institutions, instruments, and participants that enable the smooth functioning of the economy. From money markets providing short-term liquidity to capital markets fueling long-term growth, each type of market plays a unique role. With the rise of global interconnectedness, technology, and financial innovation, understanding these markets is more critical than ever for investors, policymakers, and corporations. They are the backbone of economic development, ensuring efficient capital allocation, risk management, and price discovery across the world.

short term entry(Reliability on structure is low)short entry supply marked just wait how it reacts. at least 3% profit it works fine
Sentiment-Driven Surges: Understanding Modern Market Explosions1. Market Sentiment: Definition and Importance
1.1 What is Market Sentiment?
Market sentiment refers to the overall attitude of investors toward a particular security or financial market. It represents the collective feelings, perceptions, and expectations of market participants about future price movements. Unlike fundamental analysis, which evaluates intrinsic value based on financial metrics, sentiment analysis focuses on how participants feel and act.
Market sentiment can be bullish (positive, expecting price increases) or bearish (negative, expecting price declines). It often drives momentum trades—buying when others buy, selling when others sell—creating self-reinforcing feedback loops.
1.2 Why Sentiment Matters
While fundamentals provide the baseline value, sentiment often dictates short-term market dynamics. Stocks with strong earnings may stagnate if investor sentiment is negative, while speculative assets can skyrocket without fundamental support, as seen in numerous “meme stock” rallies.
Key points:
Sentiment amplifies price volatility.
It can override fundamental signals in the short term.
It often creates market bubbles and flash crashes.
2. Drivers of Sentiment-Driven Surges
Several factors can trigger sentiment-driven market explosions. Understanding these drivers is essential for anticipating sudden price movements.
2.1 Social Media and Retail Trading Communities
In the digital era, platforms like Twitter, Reddit, Telegram, and Discord allow retail investors to coordinate actions rapidly. The 2021 GameStop saga is a prime example:
Retail traders organized online to push the stock price upward.
Short sellers were forced to cover positions, creating a short squeeze.
Price movement was largely independent of fundamentals.
Impact: Social media has transformed market psychology into a highly visible, amplifiable force. Viral narratives can trigger mass buying or selling within hours.
2.2 Algorithmic and High-Frequency Trading (HFT)
Algorithms react to market sentiment indicators, news, and price trends faster than humans can. Sentiment-based trading algorithms scan news feeds, tweets, and financial forums to predict market direction.
Positive sentiment triggers buying algorithms, increasing upward momentum.
Negative sentiment triggers selling algorithms, exacerbating declines.
Impact: HFT accelerates sentiment-driven surges, making them more extreme and less predictable.
2.3 Economic Data and Policy Announcements
Macroeconomic events, central bank policy changes, or earnings announcements can shape sentiment quickly.
Rate hikes: Markets may panic or rally based on perceived economic impact.
Inflation data: Surprising figures can trigger bullish or bearish sentiment.
Earnings surprises: Positive surprises can ignite rapid buying in stocks, sometimes overshooting intrinsic values.
2.4 Herding Behavior
Humans have an innate tendency to follow the crowd. Once a price starts moving, others often join in, creating momentum:
Fear of missing out (FOMO) amplifies upward surges.
Panic selling accelerates downward crashes.
Impact: Herding behavior often turns small sentiment shifts into large market movements.
3. Mechanisms Behind Market Explosions
Market surges do not occur in isolation. They are the result of interconnected feedback loops that magnify sentiment.
3.1 Momentum and Feedback Loops
When investors see prices rising, they buy more, driving prices higher—a self-reinforcing loop. Conversely, negative sentiment triggers rapid sell-offs. Feedback loops are amplified by:
Social media chatter
Trading algorithms
News coverage emphasizing price movements
3.2 Short Squeezes and Gamma Squeezes
Short positions are vulnerable during sentiment surges:
Short squeeze: Short sellers must buy back shares as prices rise, pushing prices further upward.
Gamma squeeze: Options market hedging by institutions forces more buying as underlying stock prices rise.
These mechanisms can make sentiment-driven surges explosive, often detached from fundamentals.
3.3 Liquidity and Market Depth
In low-liquidity conditions, small buy or sell orders can cause large price swings. Market sentiment can exploit these situations, leading to sharp, short-term surges.
Retail-driven markets often exhibit low liquidity, enhancing volatility.
Institutional players can manipulate perception to induce sentiment-driven movements.
4. Case Studies: Modern Market Explosions
4.1 GameStop (GME) – 2021
Coordinated retail buying triggered a massive short squeeze.
Price rose from $20 to over $400 in weeks.
Media coverage further fueled sentiment, creating global awareness.
Lesson: Social media combined with short vulnerabilities can cause extreme surges.
4.2 AMC Entertainment – 2021
Retail investors used sentiment-driven strategies to push stock prices up.
Options trading amplified the impact via gamma squeezes.
Fundamental financial health was largely irrelevant during the surge.
Lesson: Sentiment can dominate fundamentals, especially in low-liquidity assets.
4.3 Cryptocurrencies
Bitcoin and altcoins frequently experience sentiment-driven surges.
Tweets from influential figures (e.g., Elon Musk) can trigger massive price swings.
Speculative trading, FOMO, and global access make crypto highly sentiment-sensitive.
Lesson: Digital assets are extremely prone to narrative-driven price explosions.
5. Measuring Market Sentiment
To understand and anticipate surges, traders need reliable sentiment metrics.
5.1 Technical Indicators
Relative Strength Index (RSI): Measures overbought or oversold conditions.
Moving averages: Trends combined with sentiment data can indicate momentum.
Volume spikes: Often signal emerging sentiment-driven activity.
5.2 Social Media Analytics
Tweet volume and sentiment analysis: High positive mention frequency can indicate bullish momentum.
Reddit/Discord monitoring: Large posts and discussions can foreshadow retail-driven surges.
5.3 News and Media Sentiment
AI-powered sentiment analysis scans headlines and financial news.
Positive coverage often triggers short-term buying, negative coverage triggers selling.
5.4 Options Market Sentiment
High open interest and unusual options activity often precede price surges.
Call/put ratios indicate market expectations.
6. Trading Strategies Around Sentiment Surges
Traders can leverage sentiment-driven dynamics, but risk management is crucial.
6.1 Momentum Trading
Buy when sentiment is strongly bullish and prices are rising.
Use technical indicators for entry and exit points.
Watch volume and volatility for confirmation.
6.2 Contrarian Trading
Identify overextended sentiment-driven rallies.
Sell into extreme optimism or buy during panic.
Requires careful risk management and timing.
6.3 Event-Driven Sentiment Trades
Track scheduled events like earnings releases, policy announcements, or influencer posts.
Anticipate sentiment reactions and position accordingly.
6.4 Risk Management
Set stop-loss and take-profit levels to manage volatility.
Avoid over-leveraging during explosive surges.
Diversify exposure to minimize emotional decision-making.
7. Risks and Challenges
While sentiment-driven surges offer opportunities, they carry significant risks:
Volatility: Prices can reverse sharply, leading to losses.
Speculation vs. fundamentals: Trading purely on sentiment ignores intrinsic value.
Market manipulation: Pump-and-dump schemes exploit sentiment.
Psychological pressure: FOMO and panic can cloud judgment.
Traders must balance the allure of explosive gains with the discipline of risk control.
Conclusion
Sentiment-driven surges represent a paradigm shift in modern financial markets. While traditional fundamentals remain important, the rapid dissemination of information, social media influence, algorithmic trading, and psychological behaviors have created conditions where sentiment alone can trigger explosive market moves.
Understanding these surges requires a multi-dimensional approach—blending behavioral finance, technical analysis, social media monitoring, and risk management. For traders, recognizing sentiment signals, anticipating herding behavior, and using disciplined strategies can turn volatility into opportunity.
Ultimately, modern markets are no longer just about what a company is worth—they are about what investors feel it is worth, and sometimes, those feelings can move the market faster than any earnings report ever could.
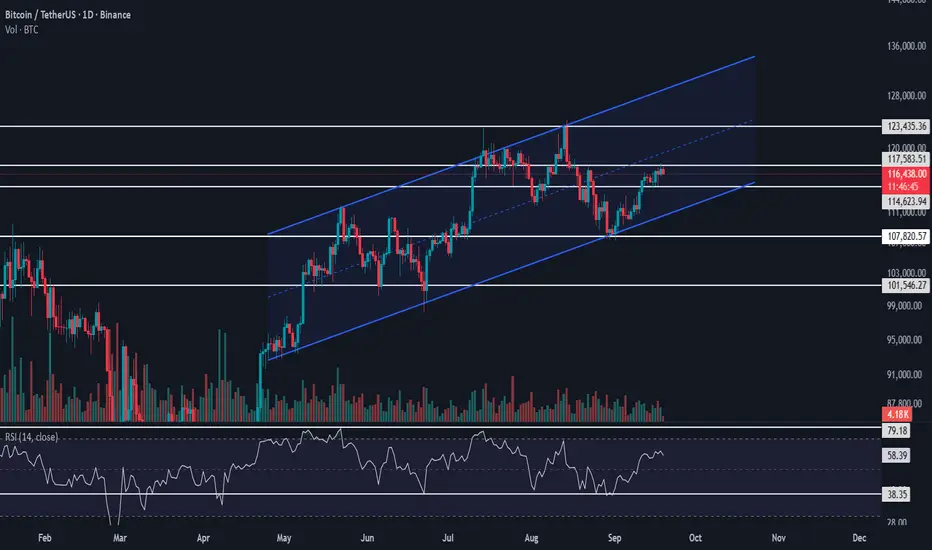
BTCUSDT Analysis – Channel Breakout in FocusBitcoin is currently moving inside an upward channel, where the $107,820.57 level acted as strong support. This level also aligned with the lower trendline of the channel, and price reacted well to it, triggering the latest bullish move.
At present, BTC is facing a critical resistance at $117,583.51, which serves as a potential long trigger. A breakout above this level could accelerate the upside momentum.
Given the expectation of a potential interest rate cut by the Federal Reserve, the crypto market could gain further bullish momentum.
Our main bullish confirmation remains a breakout of $123,435.36, which would validate the continuation of the macro bullish wave count. However, it is preferable to secure entry before price reaches that level in order to optimize risk-to-reward.
📌 Trading Plan: Watch $117,583.51 for a breakout entry. Manage risk properly as volatility is expected to rise with macroeconomic events
#Bitcoin #BTC #BTCUSDT #Crypto #CryptoTrading #TechnicalAnalysis #CryptoMarket #TradingView #Altcoins