BTC LONG SETUP📈 BTC/USD Long Setup – Eyes on the Rebound
Currently observing a potential bounce opportunity on Bitcoin from the 113,500 zone, which has been showing signs of acting as a near-term support.
🟢 Entry: 113,500
🔻 Stop Loss: 113,000 (conservative) / 112,900 (aggressive buffer)
🎯 Targets:
TP1: 114,000
TP2: 114,500
TP3: 115,000
TP4: 115,600++ (trail if momentum confirms)
Context:
Price is reacting off a micro support after a brief consolidation. RSI shows mild recovery from oversold territory, and we're seeing early signs of a potential short squeeze brewing. If bulls hold this level, we could see a clean rally into the mid-115K range.
⏳ Risk-Reward looks favorable here if BTC maintains above 113K. Manage sizing and consider scaling out at key resistance levels.
Trade ideas

Bitcoin consolidationBTC has good retracement point till 107k to 108k. Then only it will be ready for next big move. Just my view as per chart.

BTCUSDT – Bullish trend remains intactBitcoin is still trading within a long-term ascending channel. After a mild pullback to the FVG zone around 112,100 USDT, the price rebounded and is now consolidating above the ascending trendline support. If this level holds, BTC is likely to continue toward the upper channel target at 122,500 USDT.
Recent news supporting the uptrend:
Fidelity and BlackRock have continued accumulating Bitcoin-related ETF shares.
Weak US jobs data has fueled expectations of a Fed rate cut, drawing capital back into crypto.
Ethereum's upcoming hard fork upgrade is boosting overall market sentiment.
With both technical structure and fundamentals aligned, BTC remains bullish as long as it stays above 112,100.

BTC SHORT VIEWbtc short setup:
target levels – 113k / 112k / 110k / 109k
stop loss – 118k
expecting minor upside momentum possibly up to 117k, but bias remains bearish. watching for a reversal and drop from that region.

BTCWhere to next? 140K? Let's have a simple analysis on the chart, using daily candles closing and MACD. We can see that the daily closing was in green, which shows a possible reversal after being in consolidation for a few days.

BITCOIN PRICE UPDATE - JULY 1, 2025🔴 BITCOIN PRICE UPDATE - JULY 1, 2025
👋 Wrapping up the first half of 2025, BTC has closed the monthly candle around the ~$107,200 zone! Looking closely at Image 1 — BTC’s Monthly Candle Chart — we can see that June ended with a bullish green candle, forming a Pinbar ➡️ This indicates positive signals from the market.
📊 Personal Insights:
➡️ The primary trend of BTC remains bullish. Long positions are still the priority.
❓ However, in the short term, some correction phases may occur. Reasons include:
Price is currently approaching the previous peak area
On the D1 timeframe, there are clear signals: Triple Top + Divergence in Volume ➡️ This shows the overall market sentiment is cautious, waiting for a breakout around this price zone.
📌 At the current price zone of ~$107,000, I see two possible scenarios:
Scenario 1: Price retraces in the short term to collect liquidity, moves sideways within a ~$10,000 range, then gathers momentum for the next upward move
Scenario 2: Price breaks out sharply, creating a new all-time high, pulling the entire market upward
➡️ Personally, I lean more towards Scenario 1!
What do you guys think? Drop your opinions below so we can discuss together 👇👇

BTC Long-Term Outlook Update – August 4, 2025🔴 BTC Long-Term Outlook Update – August 4, 2025
Last week, BTC closed with a bearish engulfing candle and ended at the 114.2k price zone. The current primary trend is still upward.
There wouldn't be much to say if we look back at the two previous ATH (All-Time High) formations on March 11, 2024 and December 16, 2024. After reaching a new peak, BTC experienced a correction of around 30% from the ATH each time. Of course, the price didn’t drop immediately — it often retested the previous high to sweep liquidity.
But if this time the price really dumps 30%, altcoins could very well hit new lows again —b —b —b 😓
Stay cautious, everyone!
Short-term trading strategy details will be updated later today!

BTC - revised TP is 130K - Logic explainedI agree two times support for completion of wave 4 got broken but due to news flow other wise logic given in previous charts are based on confirmation of support. Now this may not go wrong. First resistance is at 116K and mean revision level is 118, once we cross these two level every analyst agree we will make new ATH and that level is 130 as per my calculations for wave 5. This is minimum level and it can be more higher as well like 150 , 180K which many people talking with their logics which i agree too. I am saying 130 is minimum we will see this year 2025 by sooner for sure.

Bitcoin trade planCRYPTOCAP:BTC if we are going here we are going to defend this 4hrs FVG. Tick-Tock.....
Stay patient, Good time ahead!!

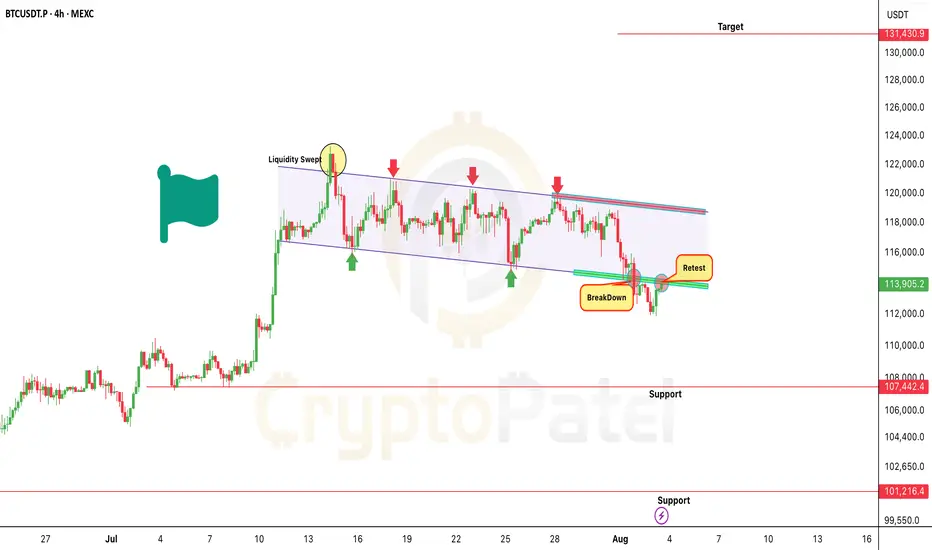
Bitcoin Breakdown or Bull Trap? $100K or $131KAs previously shared CRYPTOCAP:BTC had a potential to tap $114K when it was around $120K.
But now, $114K support has broken, and price is currently trading in the bearish retest zone post-breakdown.
Bearish Targets: $107,000/$101,000
Important Note:
Watch $115,700 zone closely- This could be a liquidity sweep trap.
If any HTF candle (4H/D) closes strongly above $115,700, it invalidates the bearish structure and may flip into a bull flag breakout.
Key Levels:
Bullish Flip Zone: $115,700 (Close Above HTF = Exit Shorts)
Trend Reversal Trigger: HTF close above $119,000 → Can open door to $131,000
Remember:
Trade with confirmation, not assumption.
Always respect key levels and adapt if market structure shifts.
NFA & DYOR
BTCUSDT update 08.2025Last week analysis shows two main interesting zone to look up :
1. inefficiency left from 10th July leg up
2. base point of cup shape from july bullrun
The first one, its just a recovery due to a strong momentum. This pair in particular tends to recovers these "empty" zones within the same cycle.
The second one is a pattern, kinda Cup Shape, not perfect, but a strong body candle as starter, a range and strong bearish candle to end the pattern (Daily).
The inefficiency recover arrived in few days, the reaction at the inefficiency zone signs the satisfaction of sellers. I expected a return to 120k before this recover but probably we will have this bounce now. I don't think we are going to bearish, not even recovery. I expect a consolidation in these areas, even if my old limit orders below 110k are still active.
I am waiting for the last 124k target, before a drawdown which will bring down the btc price, satisfy demand and sellers, and start a new cycle.


Bitcoin Next Move in Big Time Frame...Get Ready For a new move in BITCOIN📉📈...
Do own your own risk!
That's for only educational purposes!

Urgent Bitcoin Update: BTC Must Hold $110K🚨 Urgent Bitcoin Update: BTC Must Hold $110K – Or Risk Dropping Below $100K
BTC is trading near $113,900, sitting right on key support at $112K–$110K.
This zone is crucial- Holding it could lead to a rally toward $150K ATH.
But if BTC breaks below $110K, expect downside pressure with possible moves to: $100K / $93K / $83K
Price has also broken below the ascending trendline- a bearish sign unless bulls step in.
I mentioned exiting around $122K–$123K: Hope you booked profits ✅
Now, just observe how BTC reacts between $110K–$112K.
Note: NFA & DYOR

BTCUSDT – Bitcoin consolidates amid silent institutional buying Bitcoin is fluctuating between 114K and 116K USDT within a long-term ascending channel, supported by a wave of positive news. Weaker-than-expected U.S. labor data has fueled hopes that the Fed may pause its rate hikes — boosting sentiment for risk assets like BTC.
At the same time, major regulatory developments such as the SEC’s “Project Crypto” and the GENIUS Act by the CFTC are laying the groundwork for legalizing the crypto market. Notably, over 30,000 BTC were accumulated by MicroStrategy and institutional funds within just 48 hours — signaling strong capital inflows.
On the daily chart, BTC is forming an inverse cup-and-handle pattern, with 107,280 acting as key support. If the price holds and breaks above 120,872 USDT, a rally toward 130K may follow. However, if inflows weaken, a short-term pullback toward 112K could occur before the next upward move.

[SeoVereign] BITCOIN BULLISH Outlook – August 1, 2025We are the SeoVereign Trading Team.
With sharp insight and precise analysis, we regularly share trading ideas on Bitcoin and other major assets—always guided by structure, sentiment, and momentum.
🔔 Follow us to never miss a market update.
🚀 Boosts provide strong motivation and drive to the SeoVereign team.
--------------------------------------------------------------------------------------------------------
Hello.
This is SeoVereign.
My fundamental view on Bitcoin, as mentioned in the previous idea, is that I am anticipating an overall downward trend. In the mid- to long-term, I believe the downward pressure will gradually increase, and this is partially confirmed by various indicators and the overall market sentiment.
However, before we fully enter this downward phase, I have been judging that one more upward wave is likely to remain. I have focused my strategy on capturing this upward segment, and I have recently reached a point where I can specifically predict the development of that particular wave.
If this upward move unfolds successfully, I plan to set my take-profit range conservatively. The reason is simple: I still believe there is a high possibility that the market will shift back into a downtrend afterward. The core of this strategy is to minimize risk while realizing profits as efficiently as possible toward the tail end of the wave.
The relevant pattern and structure have been marked in detail on the chart, so please refer to it for a clearer understanding.
In summary, I view this rise as a limited rebound that could represent the last opportunity before a downturn, and I believe this idea marks the beginning of that move.
I will continue to monitor the movement and update this idea with additional evidence. Thank you.

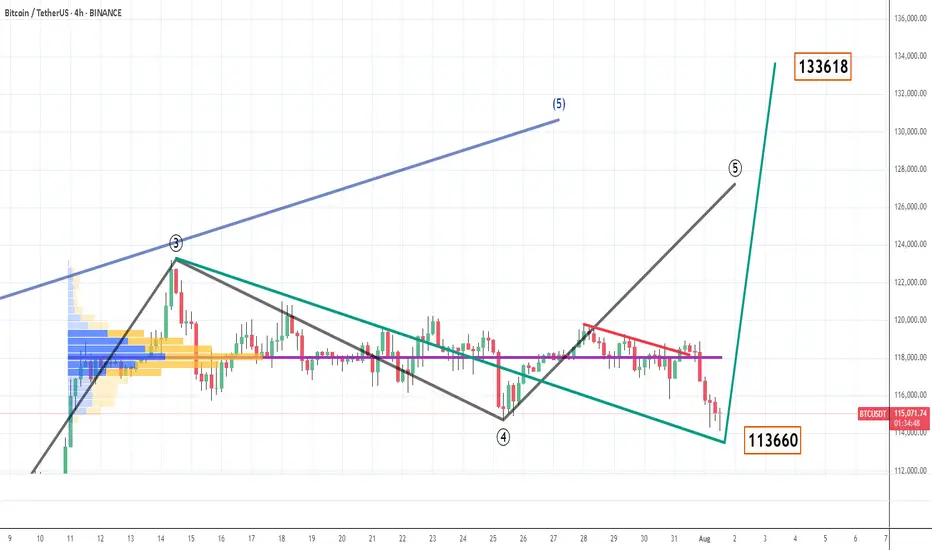
BTC - 1st Aug view - 4th wave revised and new TP - 133KBig players played a false move to shake weak hands when US data, trade deals, crypto policy etc etc favoring continuation of impulsive move. But its big players deliberate move to generate liquidations and get bigger qty of bitcoins.
Now
As per revised 4th wave shown in green line and black was earlier given wave counts.
There is no 100% accurate levels and its based on demand and supply when ever big players and algo wants to move the price either side.
In case price move above 116030 then i wish to consider 4th wave is done and we move towards 133K even if its not going to happen then also mean revision or rejection comes above 118K only and risk to reward Favours buying this dip or hold with money management.
Tariff news is not at all a impacting factor for economy as US customers going to choose the better deals and move on. every day importers and exporters compete with each other. countries compete with each other. why BTC which gets higher price due to fiat money printing get impacted now. its all big player games i think
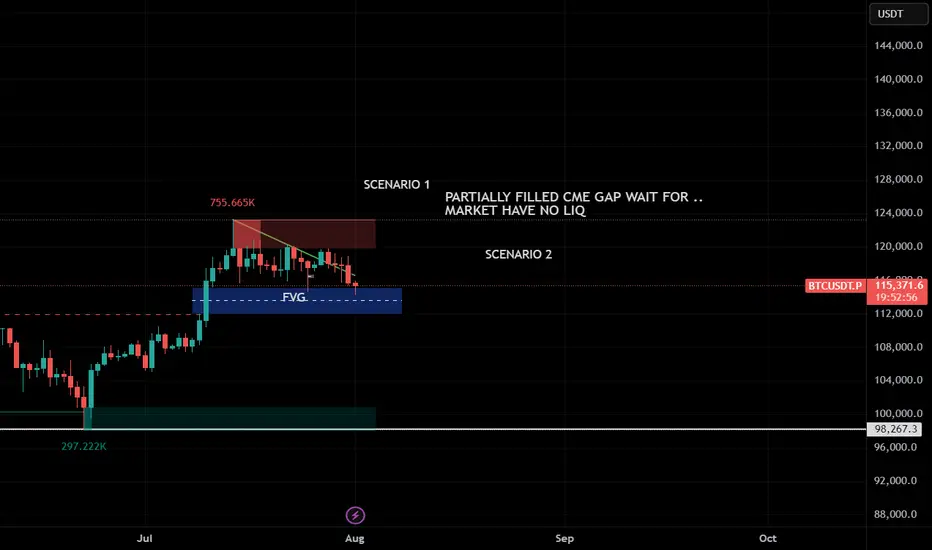
BTC BEARISH TREND...?bitcoin cme gap partially filled wait for complete ....no liquidity found so wait market create a new liquidity....so dont enter market now
$BTC Update – Crucial Support Test Ongoing!
BINANCE:BTCUSDT
📉 CRYPTOCAP:BTC Update – Crucial Support Test Ongoing!
#Bitcoin just tapped the MA200 (4H TF) near $114.6K, a make-or-break level in the current structure. This zone historically acts as bulls' last defense during corrections.
🔹MA200 support (green line) is currently holding the price around $115.3K
🔸A clean 4H close below MA200 may open doors for a deeper move toward $110K–$108K
🔺Bullish Scenario: Price reclaims MA99 (~$118K) with strong bounce = potential trend reversal
🔻Bearish Scenario: If CRYPTOCAP:BTC closes below MA200 and fails to reclaim it quickly, we may test $113K, followed by $109K–$108K zone
⚠️ This is a key battleground zone for bulls. Losing MA200 could shift sentiment fast. Eyes on the next few candles.

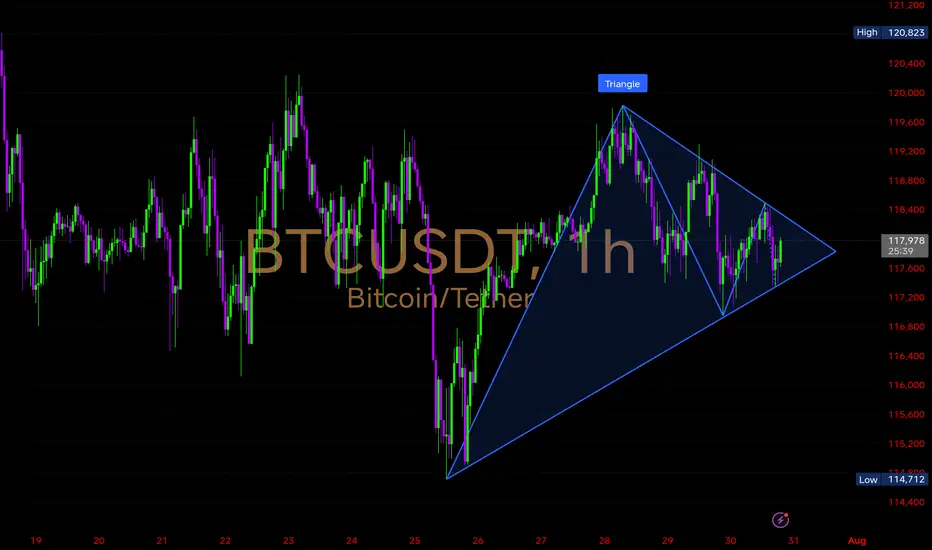
$BTC – 1Hr Triangle Squeeze in Progress
BINANCE:BTCUSDT
Bitcoin is compressing inside a well-defined symmetrical triangle on the 1-hour chart — a classic volatility squeeze setup🔺
• Triangle range: ~$120,800 (high) → $114,700 (low)
• Current price: ~$117,800
• Price nearing apex – breakout likely imminent within next few candles
• Lower highs + higher lows = indecision building
Probable Scenarios
🔹 Bullish Breakout
• Price must reclaim $118,500–$119,000 with strong volume
• Breakout above triangle top can lead to $120,800 retest
• Continuation supported by broader bullish structure
🔹 Bearish Breakdown
• Watch for clean rejection near $118,500 followed by a break below $117,000
• Losing the triangle bottom may open up $116,000 → $114,700 zone
Support: $117,000 / $116,000 / $114,700
Resistance: $118,500 / $120,000
🔁 Confirmation Needed:
• Watch for breakout + volume surge
• Sideways chop likely if price stays trapped
BTC - TP 127200 confirmed coming !!! 29th july viewEveryone are in same page with respect to wave 5 is in progress and we will be seeing new high.
Inner waves of 5th wave is clear now with support formed and ABC corrective move of 2nd wave seems to be completed price moving up. when price respect fib levels and align with wave theory then we can predict the targets. 3rd, 4th and 5th are plotted based on the first 2 move and this will happen for minimum possibilities. so with this data points I am predicting TP of 127200 for BTC very soon in short term.

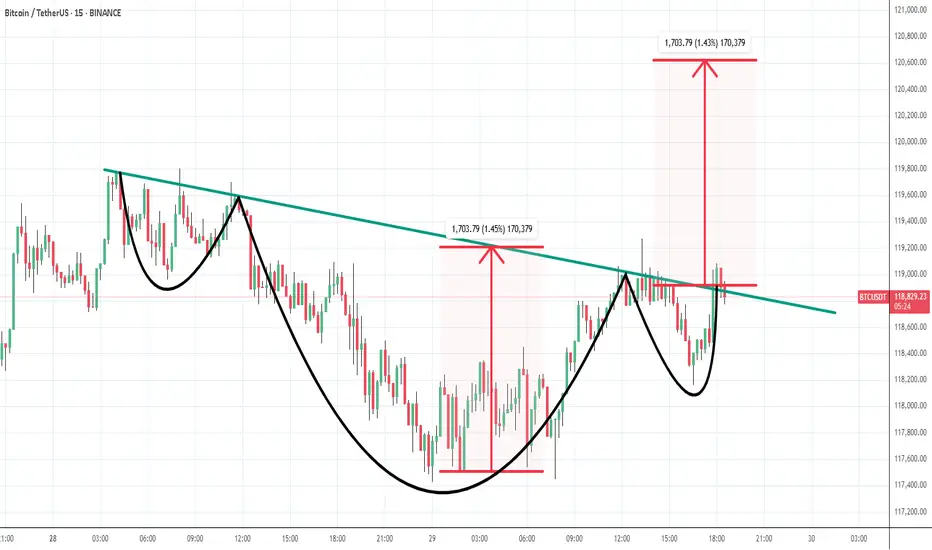
BTC - TP 120600 based on Cup & Handle - 29th July 2025price seems to have completed minor second wave of the major 5th wave up move now.
and chart clearly showing cup and shoulder pattern and once price sustain above neck line and start moving price will hit and may move above 120600 level as per this pattern which mostly work.
BTCUSDT – short-term pullback before heading higherBTCUSDT remains within a clear ascending channel. On the H8 timeframe, price is facing resistance and may pull back toward lower support before continuing its upward move. Several Fair Value Gaps below act as strong backing zones for buyers.
On the news side, market sentiment is improving as investors anticipate the upcoming PCE report and renewed interest in Bitcoin ETFs. Although the Fed holds its hawkish tone, rising recession risks are fueling expectations of a rate cut later this year.
Strategy: Consider BUY setups if price pulls back into support and shows strong reaction. Trend remains bullish unless the ascending structure is broken.
