part 2prev analysis target taken.
Recovery inefficency at 83k
first long term bullish : pullback to hhh
bearish : persistent downtrend
t1 78-77 (>50%)
t2 74-72
tomorrow daily candle will be important to understand if its a drawdown or a change in trend.
Trendline long term still bullish.
Trade ideas

Bitcoin Daily just landed on the 200 SMA - what now ?Many people are expecting Bitcoin to Bounce off the 200 day SMA ( yellow & Arrowed)
But I just want to point out what happened last time we tanged for a long time.
We did NOT bounce of it untill PA was ready to
In fact, er fell below numerous times.
So, SORRY, don;t get your hopes up BUT we can watch and react.......
It may bounce but I doubt for long.....
Time will tell

BTC#18: BTC plunges, destination and trading opportunities at th🔥 So BTC has corrected. However, how much it has decreased, we will analyze it right away: 🔥
1️⃣ **Fundamental analysis:**
📊 Widespread Pessimism, Cryptocurrency Market Plunges Sharply
————
⚫Bitcoin and altcoins plunge: Bitcoin drops nearly 5% to $90,000, Ethereum loses more than 10% in two days, Solana drops 15%, Dogecoin drops 13%.
⚫The market is still affected by the $1.4 billion hack last week. Bybit announces compensation but Ethereum is still under pressure.
⚫Weak market sentiment: Many meme coins collapse, limited capital flows cause altcoins to lose value sharply. Solana under selling pressure as it prepares to unlock $1.72 billion in tokens on March 1.
⚫Crypto-related stocks also plunge: Coinbase down for six consecutive sessions, MicroStrategy down 5.7%, BTC mining stocks fall sharply.
🚀 MicroStrategy continues to buy BTC: The company bought another 20,356 BTC worth $1.99 billion, bringing its total BTC holdings to 499,096 VND (~$33.1 billion).
🛫Forecast: The downtrend may continue if market sentiment does not improve and cash flow does not return to altcoins.
2️⃣ **Technical analysis:**
🔹 **Frame D**: the bullish structure has been broken and turned bearish. Pessimistic sentiment covers the entire market so it will be difficult to see an immediate recovery
🔹 **H4 frame**: the bearish price structure is more clearly shown. The nearest resistance zone is 93x
🔹 **H1 frame**: the price line is still quite far from the horizontal or diagonal resistance zone, the current price has recovered a bit but the market sentiment is still hesitant about the Fibo 23.6 area as you can see on the chart
3️⃣ **Trading plan:*
⛔The current time is not suitable to catch the bottom of BTC, not only the market sentiment is pessimistic but the basic information has not seen any positive news for BTC. We will need to patiently wait for confirmation from the price line
✅ Priority at the moment. Currently is looking for a SELL position following the main trend. The sharp price drop will have a recovery adjustment but pay attention to stick to the price structure and do not be greedy.
💪 **Good luck trading!**

Bitcoin buy 87500-87000 SL 85500 Target 94300-700How to take trades using Harmonic pattern projection Trade setup is explained below :-
Entry : 1st D point : 0% is recent top or bottom.
Trailing SL: 11.4% is work as trailing SL of buy or sell trade if hit then we have to book profit
.If price goes below 21.4% then early traders can make fresh reversals trade after breaking 11.4% safe traders can reversal trade after breaking 21.4%
Targets :
Target T1 : 28.3% ( early trade if entry at 11.4% )
Target T1 : 35.1% to 38.2%
Target T3 : 50.1% to 53.2%
T3: 61.8% to 65.1% is our 3rd Target since this is reversal zone so must book profit if break then take fresh trade again
Target T4 : 76.4% to 79.7%
Next Targets are 100% , 127.2% ,141.4% and final Target 161.8%.
How to take reversal trade :
If price going upside/ downside then then buy or sell levels appear on Chart ( Automatically show when price reach any reversal zone of harmonic projection pattern based .
After showing reversal levels wait for confirmation until 21.4% or 28.3 % level not break if break then exit from current buy / sell trade and take fresh reverse trade buy/ sell .
Trailing SL:
After reach 1st Target trail SL to just above or below cost ( for example we are holding sell trade from 100 1st Target 110 hit then move trailing sl to 104-105 and move SL as price move upside or Downside)
Re- Entry :
For Re-entry in any pull back Point D ( 11.4% ) is used for re-entry then SL recent high or low Point D ( 0% ) .
Target is same as early 21.4% , 28.3 , 35.1 and so on
Blue Line is 1st support/ Resistance
Green line is 2nd support/ resistance
Red line is 3rd Support/ resistance

Bitcoin long term sell given103000 , 86500 Target hit 69500 nextHow to take trades using Harmonic pattern projection Trade setup is explained below :-
Entry : 1st D point : 0% is recent top or bottom.
Trailing SL: 20.2% is work as trailing SL of buy or sell trade if hit then we have to book profit
.If price goes below 20.2% then early or risky traders can reversal trade ,
Targets :
Target T1 : 28.3%
Target T1 : 37.8 %
Target T3 : 48.1%
T3: 60.2% to 66.9 % is our 3rd Target since this is reversal zone so must book profit if break then take fresh trade again
Next Targets are 77.5 % , 88.1 % 100% , 113.5 % , 127.3% , 141.2% and 160.2 , 177.5. final Target 200%
160.2 to 177.5% if profit booking area so book full profit and wait for reversal.
How to take reversal trade :
If price going upside/ downside then then buy or sell levels appear on Chart ( Automatically show when price reach any reversal zone of harmonic projection pattern based .
After showing reversal levels wait for confirmation until 20.2 % or 28.3 % level not break if break then exit from current buy / sell trade and take fresh reverse trade buy/ sell .
Trailing SL:
After reach 1st Target trail SL to just above or below cost ( for example we are holding sell trade from 100 1st Target 110 hit then move trailing sl to 104-105 and move SL as price move upside or Downside)
Re- Entry :
For Re-entry in any pull back Point D ( 10.1% ) is used for re-entry then SL recent high or low Point D ( 0% ) .
Target is same as early 20.2% , 28.3 , 37.8 and so on
Blue Line is 1st support/ Resistance
Green line is 2nd support/ resistance
Red line is 3rd Support/ resistance

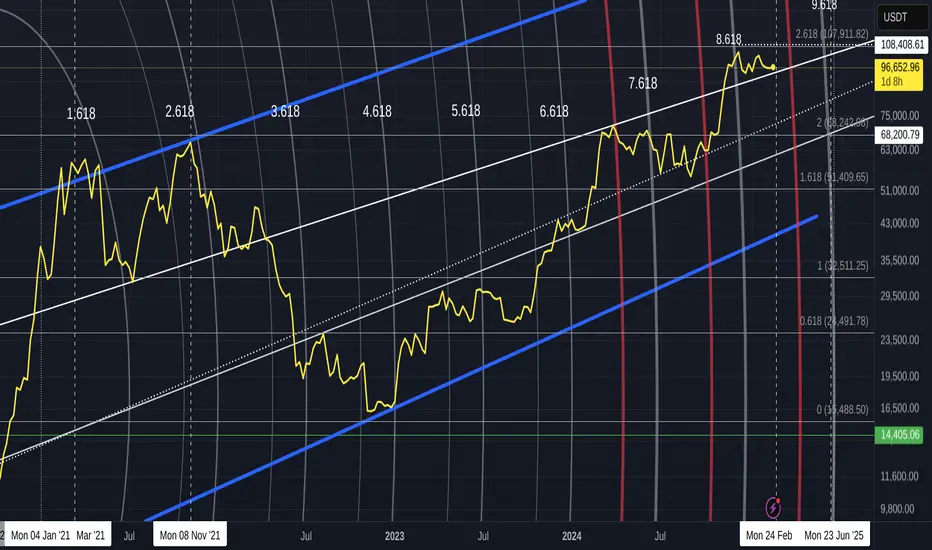
BITCOIN PA got rejected by the same Fib Circle as Nov 2021 ATH
This may not really Mean anything other than to show how amazing Fib Circles are and how they have a legacy in the past, even if the anchors are in the future.
Let me Explain.
To Draw a Fib circle, on the whole, we place one Anchor on a Low point of PA and then place a 2nd on a high
These Fib Circles have their Anchors in Early 2023
But Look how these Circles cross PA back in 2021.
The Current Circle that PA just went through and then turned down in the 2.618
On the Left side of the chart, see that Fib Circlwe that rejected March 2021 ATH..thats the 3.618 which we will cross again from July 2025
See what happened with the inner circle, the 1.618, on both occasions the PA ran into it.
Just somethin to think about while we wait for BTC PA to Dip down to 77K and bounce back up ;-)

Bitcoin exactly dumping as I predict earlier.Bitcoin is exactly following the dump path as i predict before. Bitcoin might fall to 70,000 support very soon.

Bitcoin book profit newr 86700 sell given at 95500How to take trades using Harmonic pattern projection Trade setup is explained below :-
Entry : 1st D point : 0% is recent top or bottom.
Trailing SL: 20.2% is work as trailing SL of buy or sell trade if hit then we have to book profit
.If price goes below 20.2% then early or risky traders can reversal trade ,
Targets :
Target T1 : 28.3%
Target T1 : 37.8 %
Target T3 : 48.1%
T3: 60.2% to 66.9 % is our 3rd Target since this is reversal zone so must book profit if break then take fresh trade again
Next Targets are 77.5 % , 88.1 % 100% , 113.5 % , 127.3% , 141.2% and 160.2 , 177.5. final Target 200%
160.2 to 177.5% if profit booking area so book full profit and wait for reversal.
How to take reversal trade :
If price going upside/ downside then then buy or sell levels appear on Chart ( Automatically show when price reach any reversal zone of harmonic projection pattern based .
After showing reversal levels wait for confirmation until 20.2 % or 28.3 % level not break if break then exit from current buy / sell trade and take fresh reverse trade buy/ sell .
Trailing SL:
After reach 1st Target trail SL to just above or below cost ( for example we are holding sell trade from 100 1st Target 110 hit then move trailing sl to 104-105 and move SL as price move upside or Downside)
Re- Entry :
For Re-entry in any pull back Point D ( 10.1% ) is used for re-entry then SL recent high or low Point D ( 0% ) .
Target is same as early 20.2% , 28.3 , 37.8 and so on
Blue Line is 1st support/ Resistance
Green line is 2nd support/ resistance
Red line is 3rd Support/ resistance

Ready for ault session A to B.BTC will consolidate longer period of the time to reach A to B which will help you gain in Ault as BTC dom is going down and Usdt is getting up which means all are ready to put money in ault now. AI and Development will be the first one to pump.

BTC - Good Buy at 91KBTC is different from all other coins and Its Buy level for BTC at 91K. Short Sellers will close before monthly expiry. BTC is sure Bullish only ... once resistance line is broken it will give banana spike this month or next month as per 4 year cycle...

BTC 90K support Zone is weakAfter multiple retests, 90k-92k support has become too weak and can break on another strong dump. I hope it is quite obvious from the chart prohjected

Bitcoin 1000 points profit running sell given below 95550How to take trades using Harmonic pattern projection Trade setup is explained below :-
Entry : 1st D point : 0% is recent top or bottom.
Trailing SL: 20.2% is work as trailing SL of buy or sell trade if hit then we have to book profit
.If price goes below 20.2% then early or risky traders can reversal trade ,
Targets :
Target T1 : 28.3%
Target T1 : 37.8 %
Target T3 : 48.1%
T3: 60.2% to 66.9 % is our 3rd Target since this is reversal zone so must book profit if break then take fresh trade again
Next Targets are 77.5 % , 88.1 % 100% , 113.5 % , 127.3% , 141.2% and 160.2 , 177.5. final Target 200%
160.2 to 177.5% if profit booking area so book full profit and wait for reversal.
How to take reversal trade :
If price going upside/ downside then then buy or sell levels appear on Chart ( Automatically show when price reach any reversal zone of harmonic projection pattern based .
After showing reversal levels wait for confirmation until 20.2 % or 28.3 % level not break if break then exit from current buy / sell trade and take fresh reverse trade buy/ sell .
Trailing SL:
After reach 1st Target trail SL to just above or below cost ( for example we are holding sell trade from 100 1st Target 110 hit then move trailing sl to 104-105 and move SL as price move upside or Downside)
Re- Entry :
For Re-entry in any pull back Point D ( 10.1% ) is used for re-entry then SL recent high or low Point D ( 0% ) .
Target is same as early 20.2% , 28.3 , 37.8 and so on
Blue Line is 1st support/ Resistance
Green line is 2nd support/ resistance
Red line is 3rd Support/ resistance

Here is why Bitcoin cycle ATH in Q4 maybe @ 250 K USDT
This is my oldest chart
I trust this chart - Keeping iot simple
See the Pennant PA is currently in, under resistance of the 2.618 Fib Ext.
Previous 618 Ext have been support this cycle and this leads me to think we will remain here a while.
The Rising line of support we are in pushes PA to an apex in June and PA will react shortly before that time. ( PA may drop below support and then return before June)
Weekly MACD currently falling Bearish, resetting and should be Neutral by June and so I am seeing PA rising from there.
See how PA reacts to a Fib Circle. In this Cycle,
Note that this apex of the triangle we are currently in is just after the 9.618 Fib Circle.
IF we range into the Fib circle in June, I fully expect PA to Rise after
Last time we ranged into a Fib circle with a Neutral MACD, was in Jan 2023 on the 4.618.
This lead to a rise of just under 100%
The Upper Blue Trend Line is the Ascending line of the previous Bitcoin ATH Tops, back to 2017 on this chart but to 2013 on Longer range charts.
Many charts have confluence for a cycle Top in Q4 2025 and so, using that blue line, the expected push higher from BTC PA when it breaks out of pennant in June ( or near June), we end up around the 250K USDT mark
This would, like in Jan 2023, lead to a increase in Price around 100% ( a little more actually )
While this is all based on Assumptions that PA remains Calm and in Range while the MACD resets itself from Oversold, it has happened before and there exists the chance it will again
Obviously, PA may fall through the floor and so we all need to have plans for Both Bullish and Bearish scenarios. ( there is a strong possibility of a Dip to Mid 70K and swift return )
But over all, I find THIS chart to point towards a more realistic cycle Top ATH of 250 K
Some LOG charts point to a near 1Million USDT Cycle top and that, given the market Cap required, is probably not going to happen THIS cycle....... But it will one day
As ever, we take Bitcoin PA as it comes.....and react accordingly.
This week is going to be Fun
End of Month on Friday - Monthly patterns showing some interesting things.
I'll explain those next week after month close.

Bitcoin sell below 95500buy above 96900 levels on chartHow to take trades using Harmonic pattern projection Trade setup is explained below :-
Entry : 1st D point : 0% is recent top or bottom.
Trailing SL: 20.2% is work as trailing SL of buy or sell trade if hit then we have to book profit
.If price goes below 20.2% then early or risky traders can reversal trade ,
Targets :
Target T1 : 28.3%
Target T1 : 37.8 %
Target T3 : 48.1%
T3: 60.2% to 66.9 % is our 3rd Target since this is reversal zone so must book profit if break then take fresh trade again
Next Targets are 77.5 % , 88.1 % 100% , 113.5 % , 127.3% , 141.2% and 160.2 , 177.5. final Target 200%
160.2 to 177.5% if profit booking area so book full profit and wait for reversal.
How to take reversal trade :
If price going upside/ downside then then buy or sell levels appear on Chart ( Automatically show when price reach any reversal zone of harmonic projection pattern based .
After showing reversal levels wait for confirmation until 20.2 % or 28.3 % level not break if break then exit from current buy / sell trade and take fresh reverse trade buy/ sell .
Trailing SL:
After reach 1st Target trail SL to just above or below cost ( for example we are holding sell trade from 100 1st Target 110 hit then move trailing sl to 104-105 and move SL as price move upside or Downside)
Re- Entry :
For Re-entry in any pull back Point D ( 10.1% ) is used for re-entry then SL recent high or low Point D ( 0% ) .
Target is same as early 20.2% , 28.3 , 37.8 and so on
Blue Line is 1st support/ Resistance
Green line is 2nd support/ resistance
Red line is 3rd Support/ resistance

BTC: Get Ready for the next big Rally to $150,00!1. The last trade in BTC was amazing, captured from FWB:65K levels.
2. This time as well I'm expecting a similar expansion of price after this long consolidation.
3. The trend is bullish, prices are holding the higher levels indicating the presence of buyers.
4. Till we break below 90K level on a weekly closing basis, buyers will be in charge.
✨NOTE: Don't forget to have a look to my earlier Bitcoin post, it was a good one. Even though SL was hit on the 1st entry due to whipsaw, 2nd re-entry was pretty awesome. ⚡
⚠️ Disclaimer: This is NOT a buy/sell recommendation. This post is meant for learning purposes only. Views are personal. Please, do your due diligence before investing.⚠️
💬 What are your thoughts on this share it in the comments below. ✌️
🔥 Happy Trading!✅🚀

Simple reasons for and against a Bitcoin push in near futureThere are so many people coming out with so many idaes about why Bitcoin should reach for New ATH's in March and, to some degree, it is possible though I am not to sure it would be a good idea now. Something will happen in March though, I am sure ogf that, just not to sure what.
For me, I like to keep things fairly simple. It has worked for me for many years.
So, Lets be simple about this and Look at some basic things
First of All, The Dreaded Hack yesterday that took the market into shock - Many ALTS Bled and are Still in shock.
Bitcoin took it in its stride and fell by -4.7% - It was Less than many a normal days pull back ! And today, we are Green. This shows MASSIVE under laying strength. The Support Structure of Bitcoin is Huge.
So, the the chart.
Reasons for a Push higher.
The Strength PA has, as just mentioned, is an obvious example of a simple reason to expect a push higher.The Daily MACD is Way down low, pretty well oversold and just ranging there, waiting....
But one thing I want to point out is the trend line that PA is running up. This is the trend line, with origins back 2017, that catapulted PA to the final 2021 ATH. It is strong support, that eventualy broke as the bear market cracked its whip, in 2022. But not before it support PA on two more occasions.
So, Can it do it again ?
PA does not need to react till we begin getting close to that Apex of the triangle we are now in, Which is in JUNE, But with the daily MACD Low and MACRO acceptance of Bitcoin and Trumps push to welcome Crypto, things may advance Quicker. PA certainly has the ability to move higher in the near future
The down side of that is simply, PA would run out of "steam"
Which brings me to why we may not see a push till JUNE and even then, that may just be the initial stage of the final push to cycle ATH. ( which I have said many times previously, is likely to be in Q4, maybe Early Q4 )
Look at this WEEKLY MACD chart
See where that projected line comes down to the Neutral zone...The date of intersection..JUNE
The last time weekly MACD was up here, as you can see, It fell in a very controlled manner and the angle of descent is the same as this projected line.
That happened while BTC PA Ranged across for 6 months
So, there it is, Nice and simple.
JUNE is the best time, or just before, for PA t make a move but it may try some Dances in the time till then
It can continue Ranging across in the Price range of 109K to 91K till then, Still making people money and keeping the world happy.
We can dive Deeper into all kinds of data, onchain etc, get all techie and confound people with new words...but end of the day, Bitcoin will still do the same thing as it always does.
MACD trading is a Latent method, as MACD shows you data after the event.....but it shows Trends.VERY WELL
My money is on the trend Range we are currently in, ending in around End of May to June.
This will lead to a series of New ATH's over 109K, all the way up to Cycle ATH in Q4
What happens than, That is going to be interesting to see.......but thats another story
Stay safe
BTC#17: How Does Bybit Affect BTC? Traders Need to Know This!💎 💎 💎After a long time, BINANCE:BTCUSDT has not escaped the SW zone. So what is the market reflecting? Let's analyze the price reaction of BINANCE:BTCUSD in this area: 💎 💎 💎
1️⃣ **Notable news:**
📊 Coinbase co-founder: A settlement has been reached with the US SEC, the related lawsuit is expected to be officially approved and withdrawn next week. The dismissal of the lawsuit is said to bring many positive signals to the cryptocurrency market in general. 🚀 The security incident on Bybit caused a recent decline, recording the outflow of money from Bybit including hackers' money of 2,235 billion USD. However, liquidity during this time was still maintained stable.
📌 This incident shows the solidarity of the crypto industry community, not the fragmentation of previous attacks. It can be seen that the future potential of the industry will develop even better.
2️⃣ **Technical analysis:**
🔹 **Frame D**: The price structure is still bullish, but yesterday's closing candle completely destroyed BTC's previous attempt to increase in price. A bearish engulfing candle shows that it will take more time to accumulate to break out of this SW area or the price will have to find a better support zone to break out.
🔹 **Frame H4**: The price line is still in the SW area, however, the recent increase gives us a signal about the possibility of BTC increasing in price. Let's look at H1 to see this signal more clearly
🔹 **Frame H1**: The temporary price structure is an upward price structure. Although it cannot be immediately, this is an ideal area to wait for a position whether it is BUY or SELL
3️⃣ **Trading plan:*
⛔ The current price area tests the patience of traders. Trading in the SW price zone always erodes trading psychology due to greed and expectation. FOMO every time the price signals a break through the SW zone will erode the account and trading psychology. Wait for a clearer signal from the price reaction.
✅ As you can see the plan in the H1 frame. Waiting for a clearer price structure to establish a position is the top priority. We do not predict where the price will go but look at reality to decide what to wait for. "Trade what you see, not you think"
💪 **Wish you successful trading!**

BTC Long Trade | LTC | ETH | TRUMPbuying here at 97k
for breakout above this 100k
use stoploss below 96.4k
holding here

what is the importance of trendlines & how to spot winning trade**Trendlines** are one of the most fundamental tools in technical analysis. They are simple lines drawn on a price chart to help identify the direction of the market, confirm trends, and predict future price movements. By connecting key price points (such as swing highs or swing lows), trendlines give traders a visual representation of support and resistance levels, making them crucial for decision-making in trading.
### **The Importance of Trendlines:**
1. **Identify the Direction of the Trend**:
- **Uptrend**: An uptrend is marked by higher highs and higher lows. A trendline drawn along the lows (connecting at least two significant points) helps identify the underlying upward direction of the market. A break below this trendline may signal a trend reversal.
- **Downtrend**: A downtrend is marked by lower highs and lower lows. Trendlines drawn along the highs indicate resistance levels. A break above this trendline could suggest the end of the downtrend and the potential start of an uptrend.
- **Sideways (Range-bound) Market**: In a range-bound market, trendlines help identify key support and resistance levels. The price moves between these levels until it breaks out in one direction.
2. **Support and Resistance**:
- **Support**: In an uptrend, the trendline acts as **support**, where the price tends to bounce off the line and continue higher.
- **Resistance**: In a downtrend, the trendline acts as **resistance**, where the price is likely to reverse or face selling pressure when it hits the trendline.
- Trendlines help traders identify key levels where price may reverse, consolidating their trading strategy.
3. **Spotting Breakouts**:
- **Breakouts** occur when the price moves beyond a key trendline (either support or resistance), suggesting a potential continuation or reversal of the trend. A breakout above a resistance trendline could signal a shift to an uptrend, while a breakdown below support might indicate a downtrend.
- Trendline breaks are often used as entry points for new trades, with the expectation that the breakout will lead to a strong price move in the direction of the trend.
4. **Trend Confirmation**:
- Trendlines confirm whether a trend is strong or weakening. A consistent price pattern touching the trendline multiple times can confirm that the trend is intact. Conversely, when the price moves sharply away from the trendline or fails to touch it at multiple points, it may suggest that the trend is losing momentum.
5. **Predict Future Price Movements**:
- Traders use trendlines not only to see where the price has been but also to predict where the price might go in the future. By extending the trendline beyond the current price action, traders can estimate potential support, resistance, or breakout levels for future trades.
---
### **How to Spot Winning Trades Using Trendlines:**
1. **Look for Trendline Touches**:
- **Ideal Touches**: The more times a trendline is touched without being broken, the stronger and more reliable it becomes. If the price comes close to the trendline again and bounces back (respecting the trendline), it can present a **buy opportunity** in an uptrend or a **sell opportunity** in a downtrend.
- **Validating the Trend**: If the price is consistently bouncing off the trendline in an uptrend or downtrend, it gives traders confidence that the trend is intact and could continue.
2. **Confirm with Other Technical Indicators**:
- **RSI (Relative Strength Index)**: When the price is approaching a trendline and the RSI is not yet overbought (for an uptrend) or oversold (for a downtrend), it indicates that the trend might have enough momentum to continue.
- **Moving Averages**: Use moving averages to confirm the trend direction. A price above a rising moving average supports an uptrend, while a price below a falling moving average supports a downtrend.
- **MACD (Moving Average Convergence Divergence)**: MACD can help confirm the trend’s strength and potential reversals. For example, a MACD crossover in the direction of the trend can signal an ideal entry when the price is near the trendline.
3. **Look for Trendline Breaks**:
- A break above a resistance trendline in an uptrend or below a support trendline in a downtrend can be a **high-probability trade signal**. After a trendline break, the price often follows through in the direction of the breakout, presenting an opportunity for entry.
- Use **volume analysis**: A trendline break accompanied by high volume can strengthen the likelihood that the breakout will be valid and that a strong price move will follow.
4. **Entry Points at Trendline Retests**:
- After a trendline break, the price might pull back to the trendline level and retest it. If the price holds the retest and bounces off, it’s a high-probability entry signal, especially when supported by other indicators (like a bullish candlestick pattern or volume confirmation).
- For example, after an upward breakout, the price might return to retest the broken resistance (now acting as support) and then continue higher, providing a "second chance" entry for traders.
5. **Use Trendlines with Chart Patterns**:
- Trendlines can be used to identify chart patterns that have high-probability outcomes, like **triangles**, **channels**, and **flags**.
- **Triangle Patterns**: Ascending triangles in an uptrend and descending triangles in a downtrend can provide breakout opportunities once the trendlines of the pattern are broken.
- **Channels**: In a trending market, price moves between two parallel trendlines. A breakout from the channel can signal the start of a new trend.
- **Flags**: Flags are short-term consolidation patterns that form after a sharp price move. A breakout from the flag trendline often results in a continuation of the prior trend.
6. **Use Stop Loss and Take Profit with Trendlines**:
- **Stop-Loss**: Place stop-loss orders just beyond the trendline in the opposite direction. For example, if you enter a buy trade after a breakout above the trendline, place your stop-loss below the broken resistance (now acting as support) to protect against a false breakout.
- **Take-Profit**: You can use trendlines to project price targets. For instance, after a trendline breakout, you can project a price target by measuring the height of the pattern (like a triangle or flag) and adding or subtracting it from the breakout point.
---
### **Examples of Spotting Winning Trades with Trendlines:**
#### **Example 1: Uptrend with Support Trendline**
- **Scenario**: The price of a stock is trending upward, and a clear upward trendline has been formed by connecting two significant swing lows. The price approaches the trendline again, but it bounces upward, showing that buyers are stepping in.
- **Action**: This is a strong indication that the uptrend is likely to continue. You can enter a **long position** with a stop loss just below the trendline to minimize risk.
#### **Example 2: Breakout Above Resistance Trendline**
- **Scenario**: A stock has been trading in a range and is approaching a key resistance trendline. Volume begins to increase, and the price breaks above the trendline with significant momentum.
- **Action**: This is a breakout signal. Enter a **long position** after the price breaks above resistance and holds above it. A stop loss can be placed just below the breakout point.
#### **Example 3: Trendline Retest**
- **Scenario**: After a breakout above resistance, the price pulls back to retest the broken resistance level (now support) and holds there. A bullish candlestick pattern (such as a hammer or engulfing candle) forms at the trendline.
- **Action**: This is a strong confirmation to enter a **long position**. The trendline support has held, and the retest suggests that the uptrend is likely to continue.
---
### **Risks of Trendline Trading**:
- **False Breakouts**: Sometimes, the price may break a trendline only to reverse quickly, leading to losses. It’s essential to use additional indicators (like volume or candlestick patterns) to confirm trendline breaks.
- **Over-reliance on Trendlines**: Trendlines are valuable, but relying only on them without other forms of analysis can be risky. It's important to combine trendlines with other tools (indicators, chart patterns, etc.) to increase your odds of success.
- **Subjectivity**: Drawing trendlines can be somewhat subjective. Different traders might draw trendlines differently, leading to varying interpretations of market trends.
---
In conclusion, **trendlines** are invaluable tools for spotting winning trades by identifying trends, support and resistance levels, and breakout points. When combined with other technical indicators and proper risk management, trendlines can significantly improve a trader's ability to make profitable decisions.

POST ALL-TIME-HIGH. WHATS NOW ?Recent Price Action & Structure
All-Time High & Drawdown
December's ATH was followed by a drawdown, leaving an inefficiency gap between 77K and 84K.
These zones remain "left behind" but do not indicate a strong selling phase.
Bullish Channel & Breakdown
The bullish channel lasted until December 17th, then broke down with a textbook Head & Shoulders pattern.
The second shoulder was lower than the first, signaling weakening momentum.
Range Formation & Fakeouts
Price ranged between 92K and 99K, with a fakeout on January 7th and an actual breakout on January 15th.
Liquidity was recovered at 86K on January 13th, a clear high-reaction zone.
January ATH & Liquidity Voids
New ATH at 109K (January 20th)
Demand was not strong enough to sustain a breakout beyond 109K.
The 10-day bullish move left behind a "missing liquidity point" (8-day SD cycle).
The breakout was preceded by a fakeout, grabbing liquidity before reversing under the previous low.
Post-ATH Ranging Phase
Upper band: 106K (including spikes)
Lower band: 101K, with multiple supports within the range
The uptrend line from the previous breakout was broken on January 26th, triggering liquidity recovery at 96K.
Bearish Phases & Liquidity Traps
First Major Drop
Support at 102K failed → Confirmed breakout below the range → Strong selling signal
A 4H bearish channel took price to 92K, where a wick and reaction indicated liquidity recovery, not a trend shift
Strong Recovery at Liquidation Point
Bounce at 0.5 retracement, pushing price back to the broken 102K level
Not enough demand to continue the bullish run → led to a new 4-day bearish phase
Mid-Term Market Cycle (16 Days)
First 10 Days: Light Downtrend
February 9th breakout of the downtrend line → Start of a slight bullish phase
Three uptrending moves show buyers' interest, but not enough strength to break the range
February 14th Spike to 98K
The price attempted a breakout but lacked volume → Sign of buyer willingness but insufficient liquidity
Second Half of the Cycle (6 Days)
Cup-shaped structure with a double bottom at 96K
Resistance: High from February 14th’s spike
Old trendline reached again—not a trend reversal but another liquidity grab
Key Levels to Watch
February 3rd Drop Below 92K
Left behind a major inefficiency, likely to be recovered before the next bullish phase
Below this level, another inefficiency at 86K-77K could attract large sellers
Liquidity Insights & Heatmap
Locked liquidity is high, with more long positions than shorts for next month
Bullish target: 89-87K, but only if price dips below 94K first
Potential Scenarios
Bullish Case
A final dip below 94K to fill liquidity gaps
Reversal pattern (Head & Shoulders or W formation) could confirm an imminent uptrend
Once liquidity is collected, market can start reclaiming levels lost since ATH
Bearish Case
If price fails to recover liquidity, a deeper correction toward 86K-77K inefficiency zones is likely
Strong selling signals would emerge if we break below 92K without a quick recovery
Time & Market Cycles
The T-cycle has ended—we now wait to see how the new cycle unfolds
Expect either:
Another 4-day range, or
Breakout of either 94K or 98K
For bullish confirmation, we need a clear, high-volume breakout—not just a liquidity grab (fakeout)
Final Takeaway
Key focus: Watching liquidity recovery, key breakout levels, and cycle shifts
Bullish confirmation: Strong demand push beyond resistance, not just a liquidity trap
Bearish caution: If inefficiencies are not recovered, expect deeper retracement
Next move: Monitor price reactions at 94K and 98K—whichever breaks first will determine the next phase.

BTCUSDT retracing back from the first fall legToday we witnessed a substantial fall in BTCUSDT as it broke down and sustained below the 15 Min 200 EMA, currently the price is retracing back and it is highly likely to retrace back to the 50% fib levels before we see any further fall in its price.

This is the most possible scenario of BTC in Long TermFirst,
It will go in the First Spot zone
Second,
It will fill the CME gap
Third,
Retest and Breakout
Fourth,
Bull Run
Let's see

RETESTING THE FLASH CRASH LEVEL BINANCE:BTCUSDT 4H
1. On the price chart, we can see the range formed after the February 2 drop.
2. On the OBV chart, we can see the seller's efforts to break out of the range downwards. However, these efforts are not equivalent to the price chart and a bullish divergence is forming
3. Altcoins react with a stronger drop than Bitcoin
Expectations: Given the non-equivalent movement of the volume and price of bitcoin, I expect a retest of the 92600 level with an upward reversal (a liquidation squeeze below this level is possible to remove stops on long positions)
