Introduction to Volatility Index TradingUnderstanding Volatility
Volatility is a statistical measure of the dispersion of returns for a given security or market index. It is often calculated using standard deviation or variance, indicating how much the price of an asset deviates from its average value over a period. There are two main types of volatility:
Historical Volatility (HV): Measures past price fluctuations of a security over a defined time period. It is backward-looking and often used to assess the past risk profile.
Implied Volatility (IV): Reflects the market’s expectation of future price movements, derived from the pricing of options contracts. It is forward-looking and integral to VIX calculations.
The VIX specifically captures implied volatility, giving traders a sense of expected market turbulence. High VIX readings indicate a volatile market environment with increased fear, while low readings suggest calm or complacency among investors.
The VIX – The Fear Gauge
Introduced by the Chicago Board Options Exchange (CBOE) in 1993, the VIX measures expected volatility over the next 30 days using a wide range of S&P 500 options. Its calculation is unique:
The VIX is based on the weighted prices of out-of-the-money calls and puts.
It estimates expected volatility in percentage terms on an annualized basis.
For instance, a VIX value of 20 implies an expected annualized volatility of 20%, roughly translating to a 5.8% monthly expected move in the S&P 500 (20% ÷ √12).
The VIX does not move linearly with market indices. Instead, it has an inverse correlation with the S&P 500. When markets fall sharply, fear rises, pushing the VIX higher. Conversely, when markets rally steadily, the VIX tends to decline.
Instruments for Volatility Trading
Volatility trading is not confined to the VIX itself. Traders can access volatility exposure through several instruments:
VIX Futures: Contracts that allow speculation on the future value of the VIX. They are cash-settled and are widely used for hedging or trading volatility directly.
VIX Options: Options on VIX futures provide leveraged exposure to volatility movements. They are complex instruments that require an understanding of the VIX’s unique behavior.
Exchange-Traded Products (ETPs): ETFs and ETNs track volatility indices or VIX futures. Examples include VXX and UVXY, which are designed to mimic VIX futures performance but are subject to daily rebalancing effects.
Volatility Swaps: Over-the-counter derivatives that allow traders to exchange fixed volatility for realized volatility. These instruments are mostly used by institutional traders.
Options on Stocks and Indices: Trading strategies using options can indirectly target volatility by exploiting changes in implied volatility levels.
Strategies in Volatility Trading
Volatility trading strategies are diverse and can be categorized into speculative, hedging, and arbitrage strategies:
1. Speculative Trading
Traders often speculate on market fear or complacency using the VIX:
Long VIX Futures or Calls: Investors buy VIX futures or call options expecting a spike in market volatility. This strategy pays off during market sell-offs or crises.
Short VIX Futures or Puts: Selling VIX futures or put options benefits when markets remain calm and volatility decreases.
Speculative trades require careful timing because volatility exhibits mean-reversion behavior—spikes are typically followed by declines, and prolonged periods of low volatility tend to precede sudden increases.
2. Hedging Strategies
Volatility instruments are crucial for hedging portfolios:
Portfolio Insurance: Investors holding large equity positions can buy VIX call options to protect against sudden market drops.
Tail Risk Hedging: This involves purchasing deep out-of-the-money VIX options to hedge against extreme events like financial crises.
Hedging reduces potential losses but comes at the cost of premiums, which can erode returns if volatility remains low.
3. Volatility Arbitrage
Volatility arbitrage exploits discrepancies between implied and realized volatility:
Long/Short Options: Traders buy underpriced options and sell overpriced ones, profiting when implied volatility converges with realized volatility.
Calendar Spreads: These involve taking positions in options with different expirations to profit from changes in implied volatility over time.
Arbitrage strategies require sophisticated modeling and constant monitoring of market conditions.
Key Concepts for VIX Traders
Volatility trading relies on several unique concepts that differ from traditional market trading:
Mean Reversion: Volatility tends to revert to a long-term average over time. Extreme spikes are typically temporary, which affects timing and strategy decisions.
Contango and Backwardation: VIX futures markets are often in contango (futures prices higher than spot VIX) or backwardation (futures lower than spot VIX). These conditions impact returns for products tracking VIX futures.
Implied vs. Realized Volatility: Traders monitor discrepancies between expected (implied) and actual (realized) volatility to identify trading opportunities.
Leverage and Decay: Many VIX-linked ETPs use leverage and daily rebalancing, which can lead to performance decay over long holding periods due to compounding effects.
Risks in Volatility Trading
While volatility trading offers opportunities, it also comes with significant risks:
High Leverage Risk: Many volatility instruments amplify gains and losses, requiring disciplined risk management.
Complexity Risk: VIX derivatives and ETFs can behave differently than spot volatility, and misinterpretation can lead to unexpected losses.
Market Timing Risk: Correctly predicting volatility spikes or declines is extremely challenging.
Liquidity Risk: Some instruments, particularly over-the-counter derivatives, may have limited liquidity.
Decay Risk: Leveraged volatility products are subject to time decay and volatility drag, eroding value in prolonged trends.
Because of these risks, volatility trading is generally suited for experienced traders and institutional investors, not beginners.
Practical Applications of Volatility Trading
Despite its complexity, VIX trading has practical applications:
Hedging Equity Portfolios: Using VIX calls or futures, investors can mitigate losses during market corrections.
Speculative Opportunities: Traders can profit from market fear spikes or periods of extreme complacency.
Diversification Tool: Volatility often moves independently of traditional asset classes, providing diversification benefits.
Market Sentiment Analysis: Monitoring the VIX helps gauge investor fear and sentiment, informing broader investment decisions.
Volatility in Market Crises
Historical market events highlight the importance of volatility trading:
2008 Global Financial Crisis: VIX spiked to over 80, reflecting extreme investor fear and market uncertainty.
COVID-19 Pandemic (2020): VIX surged above 80 during initial market panic, showcasing the critical role of volatility instruments for hedging and speculation.
These crises demonstrate that VIX trading is particularly relevant during periods of extreme market stress, providing both risk management tools and trading opportunities.
Conclusion
Volatility Index trading is a sophisticated domain of financial markets that goes beyond traditional buy-and-hold strategies. By providing insight into market fear and expected fluctuations, the VIX enables traders and investors to hedge risk, speculate on market sentiment, and diversify portfolios. Successful volatility trading requires a deep understanding of implied vs. realized volatility, market timing, derivatives mechanics, and risk management principles.
While opportunities in volatility trading are significant, they are accompanied by equally significant risks, particularly due to leverage, market unpredictability, and instrument complexity. Therefore, mastering VIX trading demands experience, discipline, and continuous monitoring of global market conditions.
In an era of increasing market uncertainty, understanding and trading volatility is not just an advanced financial skill—it is an essential tool for navigating the ever-changing landscape of global markets.
Trade ideas
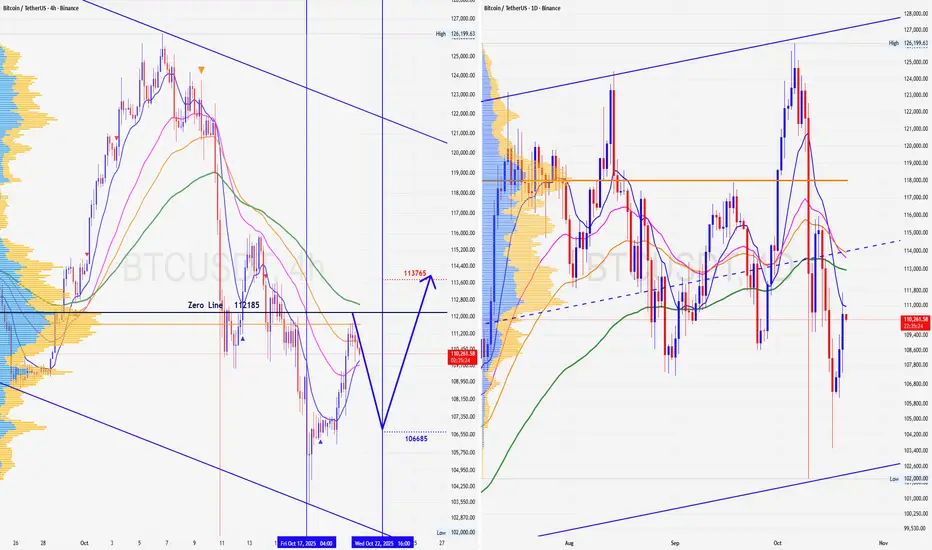
[SeoVereign] BITCOIN BEARISH Outlook – October 24, 2025Today, as of October 24th, I would like to share my bearish (short) outlook on Bitcoin.
Currently, after taking partial profits from the short position entered on October 21st, I am still holding the remaining portion.
A meaningful short entry zone has been identified on the chart today, and I am considering an additional entry.
If a downward move unfolds, I plan to scale into the position further based on this idea.
However, since part of the position has already been established and the new entry zone overlaps with the previous one,
I will proceed with caution, gradually adding to the position rather than entering aggressively.
The reasons for considering an additional short entry are as follows:
First Basis — FIBONACCI 0.886~1.13
Bitcoin is currently positioned within the 0.886–1.13 range relative to the upper structure.
This zone is generally interpreted as an overbought region, often marking the final extension of a prior upward wave.
Therefore, once the price enters this zone, selling pressure tends to increase,
which can signal a short-term correction or a potential trend reversal.
Second Basis — WAVE.M = WAVE.N × 0.786
In terms of wave structure, the ongoing arbitrary M wave
shows a ratio of approximately 0.786 relative to a previous arbitrary N wave.
This ratio frequently appears near turning points,
indicating that the momentum of the upward wave is gradually weakening.
Accordingly, the average target price is set around 109,136 USDT.
Depending on future price developments,
I will provide further updates regarding any changes to this idea
and my position management strategy.
Thank you for reading.

Introduction and Types of CryptocurrencyIntroduction to Cryptocurrency
Cryptocurrency is a type of digital or virtual currency that relies on cryptography for security and operates independently of a central authority, such as a government or bank. Unlike traditional fiat currencies, cryptocurrencies are decentralized, primarily running on blockchain technology, which ensures transparency, immutability, and security of transactions.
The concept of cryptocurrency emerged as a response to the limitations of traditional financial systems, such as centralization, lack of transparency, and inefficiencies in cross-border payments. Cryptocurrencies allow for peer-to-peer transactions without intermediaries, potentially lowering transaction costs and increasing accessibility for global users.
The first and most famous cryptocurrency is Bitcoin, created in 2009 by an anonymous person or group known as Satoshi Nakamoto. Bitcoin introduced the concept of a decentralized digital ledger, known as the blockchain, which records all transactions in a secure, transparent, and tamper-proof manner. Since then, thousands of cryptocurrencies have been developed, each with unique features and purposes.
Key Features of Cryptocurrencies
Decentralization: Cryptocurrencies are generally not controlled by any central authority. Instead, they rely on distributed ledger technology (blockchain), where multiple participants verify and record transactions.
Security: Cryptography ensures that transactions are secure and that coins cannot be easily duplicated or manipulated.
Anonymity and Privacy: Many cryptocurrencies allow users to transact with pseudonymous addresses, providing some level of privacy.
Transparency: Public blockchains allow anyone to view transactions, enhancing trust among participants.
Limited Supply: Many cryptocurrencies, like Bitcoin, have a fixed maximum supply, making them resistant to inflation.
Global Access: Cryptocurrencies can be sent and received across borders quickly and often with lower fees than traditional banking methods.
Types of Cryptocurrencies
Cryptocurrencies can be categorized based on their purpose, technology, and use cases. Here are the main types:
1. Bitcoin and Its Forks
Bitcoin (BTC) is the original cryptocurrency and is primarily used as a store of value and a medium of exchange. Its limited supply (21 million coins) makes it comparable to digital gold. Bitcoin’s blockchain is highly secure but relatively slower in processing transactions.
Over time, several Bitcoin forks emerged. Forks occur when a blockchain splits into two due to differences in protocol or updates. Key forks include:
Bitcoin Cash (BCH): Created to address Bitcoin’s scalability issues by increasing block size, allowing more transactions per block.
Bitcoin SV (BSV): Focuses on restoring the original Bitcoin protocol with emphasis on large-scale enterprise usage.
2. Altcoins (Alternative Coins)
Altcoins are cryptocurrencies other than Bitcoin, often created to improve upon Bitcoin’s limitations or serve specific functions. They include:
a. Ethereum (ETH)
Ethereum introduced smart contracts, programmable contracts that execute automatically when certain conditions are met. Its blockchain supports decentralized applications (DApps) and decentralized finance (DeFi) platforms. ETH is used to pay for transactions and computational services on its network.
b. Ripple (XRP)
Ripple focuses on facilitating fast and low-cost cross-border payments for banks and financial institutions. Unlike Bitcoin, XRP transactions are extremely fast and centralized, as Ripple Labs controls its ledger to some extent.
c. Litecoin (LTC)
Litecoin is often referred to as “silver to Bitcoin’s gold.” It has faster transaction confirmation times and a different hashing algorithm (Scrypt).
d. Cardano (ADA)
Cardano is a proof-of-stake blockchain that focuses on security, sustainability, and scalability. It emphasizes a research-driven approach for developing smart contracts and decentralized applications.
e. Polkadot (DOT)
Polkadot enables interoperability between different blockchains, allowing them to communicate and share information securely.
3. Stablecoins
Stablecoins are cryptocurrencies designed to maintain a stable value by pegging them to traditional assets, such as the US Dollar, Euro, or gold. They are widely used for trading, remittances, and as a hedge against market volatility. Examples include:
Tether (USDT)
USD Coin (USDC)
Dai (DAI) – A decentralized stablecoin pegged to the US Dollar using smart contracts.
Stablecoins are popular in crypto trading because they allow users to move in and out of volatile markets without converting back to fiat currencies.
4. Utility Tokens
Utility tokens provide access to a product or service within a blockchain ecosystem. They are not primarily designed as a currency but as a tool within a specific platform. Examples include:
Binance Coin (BNB): Used to pay for transaction fees and participate in Binance’s ecosystem.
Chainlink (LINK): Enables smart contracts to securely interact with external data sources.
5. Security Tokens
Security tokens represent ownership of real-world assets, such as stocks, bonds, or real estate, on the blockchain. They are regulated and often subject to securities laws. Security tokens bridge the gap between traditional finance and the blockchain world.
6. Governance Tokens
Governance tokens give holders voting rights in decentralized platforms. They enable communities to participate in decision-making, protocol upgrades, and funding proposals. Examples include:
Uniswap (UNI)
Aave (AAVE)
7. Meme Coins and Community Tokens
These cryptocurrencies are often created as jokes or to build communities around specific themes. While some have gained massive popularity, they are generally highly speculative. Examples include:
Dogecoin (DOGE)
Shiba Inu (SHIB)
Conclusion
Cryptocurrencies are revolutionizing the financial world by introducing decentralized, secure, and transparent systems. They provide alternatives to traditional banking, enable borderless transactions, and create opportunities for innovation in finance, governance, and technology.
The cryptocurrency ecosystem is diverse, ranging from the pioneering Bitcoin to smart contract platforms like Ethereum, stablecoins, and niche tokens such as meme coins and governance tokens. Understanding these different types is crucial for anyone interested in investing, trading, or building applications within the crypto space.
As the technology continues to evolve, cryptocurrencies will likely play an increasingly significant role in reshaping global finance, offering both opportunities and challenges for users, regulators, and institutions alike.
Trading Forex and Currency in the Indian Market1. Introduction to Forex Trading
Forex trading involves speculating on the value of one currency relative to another. A currency pair, such as USD/INR, represents the exchange rate between two currencies. Traders make profits by predicting the rise or fall in the exchange rate between the base currency (first in the pair) and the quote currency (second in the pair).
Globally, forex trading occurs 24 hours a day across various financial centers. Unlike stock markets, forex is a decentralized over-the-counter (OTC) market, meaning there is no single exchange where trades are executed. Instead, trading happens electronically through brokers, banks, and other financial institutions.
2. Forex Trading Landscape in India
Unlike countries like the United States, the United Kingdom, or Japan, India has strict regulations governing forex trading. The Reserve Bank of India (RBI) and the Securities and Exchange Board of India (SEBI) oversee all currency trading activities to protect domestic financial stability and prevent speculative excesses.
2.1 Permitted Forex Trading Instruments in India
In India, retail forex trading is limited to currency pairs that include the Indian Rupee (INR). As per RBI guidelines, Indian residents are allowed to trade in the following currency pairs on recognized exchanges:
USD/INR – US Dollar vs Indian Rupee
EUR/INR – Euro vs Indian Rupee
GBP/INR – British Pound vs Indian Rupee
JPY/INR – Japanese Yen vs Indian Rupee
Trading in other exotic currency pairs, such as EUR/USD, GBP/JPY, or cryptocurrencies, is prohibited for Indian residents through domestic brokers. However, Indian corporates and authorized dealers may engage in certain cross-currency transactions for hedging purposes under strict compliance.
2.2 Recognized Exchanges for Forex Trading in India
Forex trading for retail traders is allowed only through recognized Indian exchanges, such as:
NSE (National Stock Exchange of India) – Offers trading in currency futures and options.
BSE (Bombay Stock Exchange) – Provides currency derivatives instruments.
MCX-SX (Metropolitan Stock Exchange of India) – Also facilitates currency derivatives trading.
Trading outside these exchanges, especially through foreign online brokers, is illegal for Indian residents and may lead to severe penalties.
3. Currency Derivatives in India
Direct forex trading as practiced in global markets (spot trading in USD/EUR, USD/JPY) is largely restricted for Indian retail traders. Instead, traders access currency markets through derivatives, which include futures and options contracts.
3.1 Currency Futures
Currency futures are standardized contracts traded on exchanges, allowing traders to buy or sell a currency at a predetermined price on a future date. Futures help traders hedge against currency fluctuations or speculate for profit. Key characteristics include:
Standardized Contract Size – Each contract specifies the amount of currency, e.g., USD 1000 per contract.
Settlement – Usually cash-settled in INR based on the exchange rate at expiry.
Leverage – Futures contracts allow traders to control a larger position with smaller capital, amplifying profits and risks.
3.2 Currency Options
Currency options give the buyer the right, but not the obligation, to buy or sell a currency at a pre-specified price on or before a certain date. Indian exchanges offer:
Call Options – Right to buy a currency.
Put Options – Right to sell a currency.
Options are particularly useful for hedging purposes, allowing businesses to protect themselves against adverse currency movements without the obligation to execute the trade.
4. Regulatory Framework
Forex trading in India is heavily regulated to prevent excessive speculation and ensure economic stability. Key regulatory aspects include:
RBI Guidelines: Regulates the types of currencies Indian residents can trade and restricts offshore forex trading.
SEBI Regulations: Oversees all derivatives contracts, including currency futures and options on recognized exchanges.
FEMA (Foreign Exchange Management Act, 1999): Prohibits unauthorized transactions in foreign currency and imposes compliance requirements for legal forex dealings.
Violation of these rules, such as trading with unregulated international brokers, can lead to penalties, freezing of accounts, and even imprisonment in severe cases.
5. Strategies for Forex Trading in India
While Indian forex trading is more regulated than global markets, traders can still employ a variety of strategies to generate profits. These include:
5.1 Technical Analysis
Technical analysis involves studying historical price data, chart patterns, and indicators to predict future price movements. Common tools include:
Moving Averages – Identify trends and reversals.
RSI (Relative Strength Index) – Measures overbought or oversold conditions.
Fibonacci Levels – Identify potential retracement levels.
5.2 Fundamental Analysis
Fundamental analysis involves evaluating economic indicators, government policies, and geopolitical events to forecast currency movements. Key factors impacting INR pairs include:
RBI interest rate decisions
Inflation and GDP data
Trade deficits and foreign investment flows
Global events like US Fed policy, oil prices, and geopolitical tensions
5.3 Hedging Strategies
Hedging is widely used by Indian corporates to mitigate foreign exchange risk. Businesses engaging in imports or exports often use currency futures and options to lock in rates, protecting profit margins from adverse currency movements.
5.4 Day Trading vs Positional Trading
Day Trading: Traders open and close positions within a day to exploit short-term price fluctuations.
Positional Trading: Traders hold positions for days or weeks, based on trend analysis and macroeconomic fundamentals.
Both approaches are feasible in the Indian currency derivatives market, though day trading requires stricter risk management due to high volatility.
6. Risk Management in Forex Trading
Forex trading, even within Indian regulations, carries significant risk due to leverage and currency volatility. Effective risk management is crucial:
Leverage Control: Avoid over-leveraging, as losses can exceed initial capital.
Stop Loss Orders: Automatically close losing positions to limit losses.
Position Sizing: Adjust trade size based on risk appetite and market conditions.
Diversification: Spread risk across multiple currency pairs instead of concentrating on one.
Understanding and managing risk is especially important in the Indian context, as sudden policy changes, RBI interventions, or global currency shocks can impact INR pairs significantly.
7. Advantages of Trading Forex in India
Despite regulatory restrictions, trading forex in India offers several advantages:
Access to Regulated Markets: Indian traders can trade currency derivatives legally, reducing the risk of fraud.
Hedging Opportunities: Indian businesses and traders can manage exposure to foreign exchange risk.
Transparency and Security: Trades conducted on recognized exchanges ensure settlement transparency.
Integration with Global Economy: With India’s growing foreign trade, understanding forex markets helps businesses and investors make informed decisions.
8. Challenges of Forex Trading in India
There are also notable challenges for Indian traders:
Limited Currency Pairs: Only INR-based pairs are allowed for retail traders.
Regulatory Restrictions: Offshore forex trading is prohibited, limiting exposure to global currency markets.
Liquidity Constraints: INR pairs may have lower liquidity compared to global pairs like EUR/USD or USD/JPY.
Volatility Risk: Sudden geopolitical events, policy changes, or RBI interventions can cause sharp price swings.
9. Future of Forex Trading in India
The Indian forex market is evolving. With increasing globalization, technological advancement, and digital trading platforms, the scope for currency trading is likely to expand. Possible trends include:
Introduction of More Currency Pairs: To increase market depth and trading options.
Enhanced Online Trading Platforms: Improved user experience and analytical tools for retail traders.
Greater Institutional Participation: Indian banks and corporates adopting sophisticated trading strategies.
Integration with Global Markets: Gradual liberalization may allow more interaction with global forex markets, although under strict compliance.
10. Conclusion
Trading forex and currencies in the Indian market is a regulated but potentially profitable avenue for traders and businesses. While direct retail trading in global currency pairs is restricted, Indian traders can access INR-based currency futures and options on recognized exchanges. Success in forex trading requires a strong understanding of market fundamentals, technical analysis, regulatory frameworks, and disciplined risk management.
India’s forex market strikes a balance between providing hedging opportunities, ensuring financial stability, and fostering investor participation. As the Indian economy grows and integrates further with global trade, forex trading will likely become more sophisticated, offering broader opportunities to both retail and institutional traders. However, adherence to legal frameworks and careful risk management remains critical to navigating this market effectively.

BTC/USDT (Bitcoin vs Tether).....BTC/USDT (Bitcoin vs Tether) on the 1-hour timeframe (Binance).
Here’s what the technicals show:
A clear ascending trendline has been broken downward.
Price is retesting the broken support (now resistance) around 108,800–109,000.
There’s a bearish continuation setup after the sharp drop from the 113,000 zone.
The chart marks a “Target Point” at the bottom, aligned with the measured move of the pattern.
📉 Analysis Summary:
Breakdown level: ~109,000
Current price: ~107,800
Measured move / target: ~103,000
✅ Bearish Target Zone:
> 🎯 Target = 103,000 – 103,200 USDT

How to Grow Your Business in the Trading Market1. Understanding the Trading Market Landscape
Before attempting to grow a trading business, it is crucial to understand the market dynamics. The trading market operates in a global ecosystem influenced by economic trends, geopolitical events, corporate performance, and investor sentiment. Key segments include:
Equities (Stocks): Companies raise capital through stock markets, offering investors a chance to participate in profits.
Commodities: Trading in raw materials such as gold, oil, and agricultural products, which are highly sensitive to global supply and demand.
Forex: The largest and most liquid market, involving currency pairs, influenced by interest rates, inflation, and macroeconomic data.
Derivatives: Financial contracts such as options and futures that derive value from underlying assets, useful for hedging and speculation.
Cryptocurrencies: Emerging digital assets driven by decentralized technologies, regulatory uncertainty, and market volatility.
Understanding these market segments allows a business to identify opportunities, anticipate trends, and tailor its offerings.
2. Establishing a Clear Business Model
Growth begins with a well-defined business model. There are several models in the trading sector:
Brokerage Services: Acting as intermediaries between buyers and sellers, earning through commissions or spreads.
Trading Platforms/Software: Providing technology infrastructure for traders, including analytics, charts, and automated trading systems.
Investment Advisory: Offering research, insights, and portfolio management services for retail or institutional clients.
Proprietary Trading: Using internal capital to trade, aiming to generate profits directly rather than earning commissions.
Choosing the right model depends on resources, expertise, and target clientele. Many successful businesses combine models, for instance, offering a trading platform along with educational and advisory services.
3. Building a Strong Technological Infrastructure
In modern trading, technology is a critical enabler of growth. Key technological elements include:
Trading Platforms: A reliable, fast, and secure platform attracts and retains clients. It should support multiple asset classes, real-time data, and customizable interfaces.
Algorithmic Trading: Automated strategies using algorithms can optimize execution, reduce human error, and handle large volumes efficiently.
Data Analytics: Access to market data and predictive analytics helps in decision-making, risk management, and personalized client services.
Mobile Access: With the rise of retail trading, mobile-friendly platforms ensure clients can trade anytime, anywhere, boosting engagement and revenue.
Investment in technology not only enhances operational efficiency but also differentiates a business in a highly competitive market.
4. Risk Management and Compliance
Trading inherently involves risk, and sustainable growth requires robust risk management practices:
Financial Risk: Hedging strategies, stop-loss orders, and portfolio diversification minimize losses.
Operational Risk: Internal processes, cybersecurity measures, and reliable infrastructure prevent disruptions.
Regulatory Compliance: Adhering to local and international regulations is critical. Non-compliance can result in fines, reputational damage, or license revocation.
Client Protection: Ensuring transparent policies, segregated accounts, and secure transactions builds trust and long-term client loyalty.
A business that prioritizes risk management gains credibility and positions itself as a trusted market participant.
5. Marketing and Client Acquisition
Growth in trading relies heavily on attracting and retaining clients. Effective strategies include:
Digital Marketing: SEO, social media, and content marketing can generate leads and enhance brand visibility.
Educational Programs: Hosting webinars, workshops, and tutorials not only educates potential clients but also establishes authority in the field.
Referral Programs: Incentivizing existing clients to refer new users accelerates growth organically.
Partnerships: Collaborations with financial influencers, fintech firms, or institutional investors expand reach and credibility.
Customer Experience: Seamless onboarding, responsive support, and intuitive interfaces improve client retention and lifetime value.
In a saturated market, marketing combined with trust-building is a key differentiator.
6. Diversification of Products and Services
Relying on a single revenue source can limit growth. Diversifying offerings allows businesses to tap into multiple market segments:
New Asset Classes: Expanding from stocks to derivatives, commodities, or crypto attracts a wider audience.
Portfolio Management: Offering managed accounts or robo-advisory services caters to clients seeking convenience.
Research and Insights: Subscription-based research reports, trading signals, or educational content create additional revenue streams.
Margin and Leverage Services: For experienced traders, providing margin trading enhances engagement and profitability.
Diversification mitigates risk while opening new channels for revenue generation.
7. Leveraging Strategic Partnerships and Networking
Networking and partnerships play a crucial role in scaling a trading business:
Institutional Partnerships: Collaborating with banks, funds, or brokerage houses provides access to large client bases and advanced trading infrastructure.
Technology Vendors: Partnerships with tech providers ensure the platform remains competitive and secure.
Educational Institutions: Partnering with universities and financial schools can attract aspiring traders and interns.
Global Expansion: Strategic alliances in other countries enable entry into new markets while navigating regulatory challenges.
Building a strong network creates opportunities for business growth and market penetration.
8. Continuous Learning and Market Adaptation
The trading market is dynamic, with constant technological, regulatory, and behavioral changes. Successful businesses embrace continuous learning:
Market Trends: Monitoring global economic indicators, industry reports, and emerging sectors helps anticipate opportunities.
Technological Innovation: Adopting blockchain, AI-driven analytics, and machine learning can improve trading performance and operational efficiency.
Customer Feedback: Understanding client needs, pain points, and preferences allows iterative improvements.
Competitor Analysis: Observing competitors’ strategies ensures the business remains competitive and innovative.
Adaptability is essential; firms that fail to evolve risk obsolescence.
9. Branding and Reputation Management
In trading, trust is currency. A strong brand communicates reliability and expertise:
Transparency: Open communication about fees, risks, and performance builds credibility.
Corporate Social Responsibility: Ethical trading, community engagement, and sustainable practices enhance reputation.
Thought Leadership: Publishing market analysis, insights, and white papers positions the firm as an industry authority.
Client Testimonials and Case Studies: Showcasing success stories reinforces trust and attracts new clients.
A reputable brand fosters loyalty, encourages referrals, and differentiates a business from competitors.
10. Scaling Operations Efficiently
Finally, as the business grows, operational efficiency ensures sustainability:
Automated Processes: Automating back-office operations, trade reconciliation, and reporting reduces costs.
Talent Acquisition: Hiring skilled traders, analysts, and technology experts strengthens core capabilities.
Scalable Infrastructure: Cloud-based systems and modular platforms accommodate growth without major overhauls.
Performance Metrics: Monitoring KPIs such as client acquisition cost, trading volume, and retention rate helps identify improvement areas.
Efficient scaling transforms incremental growth into long-term success.
Conclusion
Growing a business in the trading market requires a multifaceted approach combining strategy, technology, risk management, marketing, and operational excellence. Understanding market dynamics, building a robust platform, diversifying offerings, and prioritizing client trust are fundamental steps. Strategic partnerships, continuous learning, and reputation management further accelerate growth. By implementing these strategies thoughtfully and consistently, a trading business can not only survive but thrive in the competitive and ever-evolving financial markets.
In essence, growth in the trading market is not just about making profits—it is about creating a sustainable, innovative, and trusted ecosystem that adapts to change, attracts clients, and leverages technology effectively. Those who succeed are the ones who balance strategic foresight with operational discipline, constantly evolving to meet the demands of a dynamic global market.
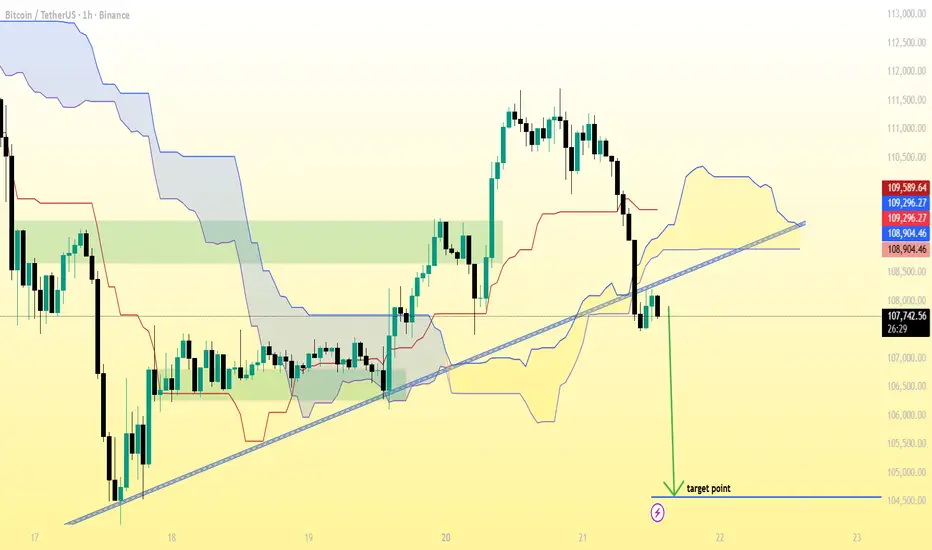
BTC/USDT (1-hour timeframe...BTC/USDT (1-hour timeframe) on Binance.
The price has broken below a trendline and is trading under the Ichimoku Cloud, which indicates bearish sentiment.
A green arrow is drawn downward pointing to a target zone labeled “target point.”
🔍 Based on the chart:
Current price: around $107,854
The projected target point (according to my drawn line) appears to be near the $105,400–$105,600 range.
📉 Summary:
If the bearish breakdown continues:
Target: around $105,500
Potential drop: roughly 2.2%–2.4% from current levels
Invalidation (stop loss): if BTC closes back above the trendline or $109,300–$109,500 region (top of the cloud)
[SeoVereign] BITCOIN BEARISH Outlook – October 21, 2025Hello everyone,
This idea is connected to the one shared on the 19th.
I am still holding the short position that was entered based on the October 19 idea, and since some of the underlying reasons have been slightly revised, I’m sharing this as an additional update.
Today, as of October 21, I would like to present my bearish (short) outlook on Bitcoin.
First Basis — IR BAT (Invalid Reaction BAT)
The core of this analysis lies in the IR BAT Pattern, a concept I developed independently.
It is a modified interpretation of the traditional BAT pattern.
If, after entering the PRZ (Potential Reversal Zone), a meaningful rebound does not occur within a certain period,
the pattern is considered invalid (Invalid Reaction),
and in such cases, the price tends to move strongly beyond the PRZ in the same direction.
Currently, Bitcoin has entered the PRZ zone of the BAT pattern
but has shown no clear buying reaction, instead maintaining a sideways and slightly bearish movement.
This satisfies the typical downward scenario conditions of the IR BAT pattern.
Second Basis — 0.618~0.886 Retracement Zone
The current chart is positioned within the 0.618~0.886 Fibonacci retracement zone relative to the upper structure.
This zone is typically where, in the IR BAT pattern, short-term rebounds are limited and renewed declines tend to occur,
thus it can be interpreted as a sell-dominant region.
Accordingly, I set the average target price around 105,277 USDT.
Depending on future price developments,
I will continue to provide updates regarding any changes to this idea and position management strategies.
Thank you for reading.

Intraday Trading vs Swing Trading1. Definition and Concept
Intraday Trading:
Intraday trading, often referred to as day trading, involves buying and selling financial instruments within the same trading day. The positions are opened and closed during market hours, ensuring that no trades are carried overnight. The primary objective is to capitalize on short-term price fluctuations, often measured in minutes or hours. Intraday traders rely heavily on technical analysis, real-time charts, and market news to make rapid decisions.
Swing Trading:
Swing trading, on the other hand, is a medium-term strategy where traders aim to profit from price “swings” or trends over several days to weeks. Unlike intraday trading, positions in swing trading are not confined to a single day and may be held for multiple sessions. Swing traders attempt to capture significant market moves rather than minute-to-minute fluctuations, employing both technical and fundamental analysis.
Key Difference:
The central distinction is time horizon. Intraday trading is about short bursts of activity within a day, whereas swing trading spans multiple days to weeks, targeting broader trends.
2. Time Commitment
Intraday Trading:
Intraday trading demands significant attention and engagement throughout the trading session. Traders need to monitor charts, order flows, and news events continuously. This makes intraday trading time-intensive and akin to a full-time job for active traders. Missing even a short market movement can result in lost opportunities or losses.
Swing Trading:
Swing trading requires less constant monitoring. Since positions are held for several days, traders can check the market periodically, adjusting their positions as trends develop. This makes swing trading more suitable for part-time traders or those with other professional commitments.
3. Capital Requirements and Leverage
Intraday Trading:
Day trading often involves high leverage to magnify small price movements into meaningful profits. Many brokers offer intraday margin, allowing traders to take positions several times larger than their actual capital. While leverage increases profit potential, it also amplifies risk, making risk management crucial.
Swing Trading:
Swing trading generally requires more capital upfront because positions are held overnight and are exposed to market gaps and volatility. Leverage may still be used, but it is usually lower than in intraday trading, as the focus is on capturing larger moves rather than rapid micro-fluctuations.
Key Takeaway:
Intraday trading is more capital-efficient due to leverage but riskier in a short timeframe. Swing trading needs more upfront capital, but risk is spread across time, allowing more measured position sizing.
4. Risk and Volatility
Intraday Trading:
Intraday trading exposes traders to high volatility, but the exposure is limited to a single trading session. Traders can use stop-loss orders to manage risk aggressively. However, markets can move unpredictably within minutes, leading to rapid gains or losses.
Swing Trading:
Swing traders face overnight and weekend risk, where significant news events or economic developments can cause price gaps. While daily volatility may be less critical, holding positions overnight increases the potential for unexpected swings, which requires careful risk management.
Comparison:
Intraday trading: High short-term risk, low overnight exposure.
Swing trading: Moderate daily risk, higher overnight/holding risk.
5. Analytical Approach
Intraday Trading:
The strategy relies almost entirely on technical analysis, including:
Candlestick patterns
Intraday charts (1-minute, 5-minute, 15-minute)
Volume analysis
Moving averages, RSI, MACD
News and economic data for intraday sentiment
Fundamental factors are usually secondary, as their impact manifests over a longer timeframe.
Swing Trading:
Swing traders use a blend of technical and fundamental analysis:
Technical analysis identifies entry and exit points using daily or weekly charts.
Fundamental analysis helps assess whether a stock or commodity has the potential for multi-day trends, based on earnings reports, economic indicators, or sectoral developments.
Key Insight:
Intraday trading focuses on price action and market psychology in the very short term, while swing trading integrates market trends with underlying financial health.
6. Profit Potential and Target
Intraday Trading:
Targets small profits per trade, often measured in a few percentage points or fractions thereof.
High frequency of trades is necessary to accumulate meaningful gains.
Profit depends heavily on timing and execution.
Swing Trading:
Targets larger profits per trade, sometimes 5–20% or more depending on the instrument and trend duration.
Fewer trades are executed, but each trade aims to capture a substantial portion of the trend.
Patience is key; missing a trend reversal can significantly affect profitability.
7. Psychological and Emotional Factors
Intraday Trading:
Highly stressful due to rapid decision-making and constant monitoring.
Emotional discipline is critical to avoid impulsive trades based on fear or greed.
Traders often experience burnout, especially during volatile markets.
Swing Trading:
Less stressful in daily execution but requires patience and emotional control over longer periods.
Traders need to resist the urge to exit early or chase market reversals.
Swing trading fosters a calmer, more strategic mindset, focusing on trend-following rather than rapid reaction.
8. Costs and Expenses
Intraday Trading:
Higher transaction costs due to frequent trading.
Broker commissions, spreads, and taxes can eat into profits if not managed efficiently.
Swing Trading:
Lower transaction costs, as trades are less frequent.
Overnight exposure may involve financing costs if positions are leveraged in margin accounts.
Key Observation:
Intraday trading requires high-volume, low-margin efficiency, while swing trading benefits from fewer trades with larger profit potential per trade.
9. Suitability for Different Traders
Intraday Trading:
Suitable for traders with high risk tolerance, strong analytical skills, and the ability to monitor markets constantly.
Ideal for individuals seeking quick returns and able to handle high stress.
Swing Trading:
Better suited for part-time traders, investors who prefer moderate risk, or those who value trend-based strategies.
Aligns with individuals focusing on longer-term wealth accumulation without the need for constant market monitoring.
10. Tools and Technology
Intraday Trading:
Requires real-time data feeds, fast execution platforms, charting software, and news alerts.
Algorithmic trading and automated systems are commonly used to capitalize on micro-movements.
Swing Trading:
Can operate with daily charts, trend indicators, and fundamental reports.
Automation is less critical; research and strategic analysis often suffice.
11. Advantages and Disadvantages
Aspect Intraday Trading Swing Trading
Time Horizon Same-day Several days to weeks
Time Commitment High Moderate
Risk High short-term, low overnight Moderate daily, higher overnight
Profit Potential Small per trade, frequent Larger per trade, less frequent
Capital Efficiency High (via leverage) Requires more capital upfront
Stress Level High Moderate
Analytical Focus Technical only Technical + Fundamental
Transaction Costs High due to frequent trades Low to moderate
Suitability Full-time, active, risk-tolerant traders Part-time, trend-followers, moderate risk
12. Conclusion
Both intraday and swing trading are viable strategies but cater to different personality types, financial goals, and lifestyles. Intraday trading offers the thrill of rapid decision-making and potential for quick profits but requires high dedication, real-time analysis, and exceptional risk management. Swing trading, by contrast, offers a more patient, strategic approach, balancing market analysis with trend-based decisions, suitable for those who cannot dedicate full trading hours but still seek substantial returns.
Choosing between intraday and swing trading depends on multiple factors:
Risk tolerance
Time availability
Capital allocation
Emotional resilience
Market knowledge and analytical skill
Ultimately, successful trading in either domain demands discipline, strategy, and continuous learning. Understanding the nuances of intraday versus swing trading can help traders craft a personalized approach, optimizing both profitability and sustainability in financial markets.

Bitcoin: Retrace before continue higher?Well now that res at $111 was broken , what's next?
Looking at price action and TIME left on bears side on the 4hrs TF we can say that a retrace to $106k will be ok as long as it doesn't stay in that range for too long while the Daily is setting up for its move that will start Tuesday Oct 21 and taking hold by Thursday Oct 23 that's the plan for a move to the $113k - $115k , once it gets there and most important how it gets there will give us a clue if the move have legs for a test to the $130k.
Buckle up ladies and gentlemen and feel free to lock in profits cause the Daily setup as of now looks week.
Play it right, play it safe , know the rules of the game.
Have a good trading day everyone.
Boost....Follow and Comment.
Bitcoin Is Flashing a Major Warning Signal Right NowBitcoin Is Flashing a Major Warning Signal Right Now ⚠️
KEY LEVELS:
Resistance: $123K (triple top) & $115.9K barrier
Support: $106K - CRITICAL level
BEARISH PATH (if $106K breaks):
→ Target 1: $91K (-18%)
→ Target 2: $79K (-28%)
BULLISH SCENARIO:
Reclaim $115.9K & break $123K to invalidate bearish structure
STRUCTURE ANALYSIS:
▶️ Lower highs forming = Reversal signal
▶️ Weakening momentum post- New ATH
▶️ Distribution pattern visible at resistance
STRATEGY:
✅ SHORT: Below $106K | Targets: $91K-$79K
✅ LONG: Above $115.9K | Stop: $106K
The chart doesn't lie. $106K is the line in the sand.
Risk management > predictions.
Trade smart. Adapt fast. Survive longer.
CRYPTOCAP:BTC #Bitcoin
NFa & DYOR

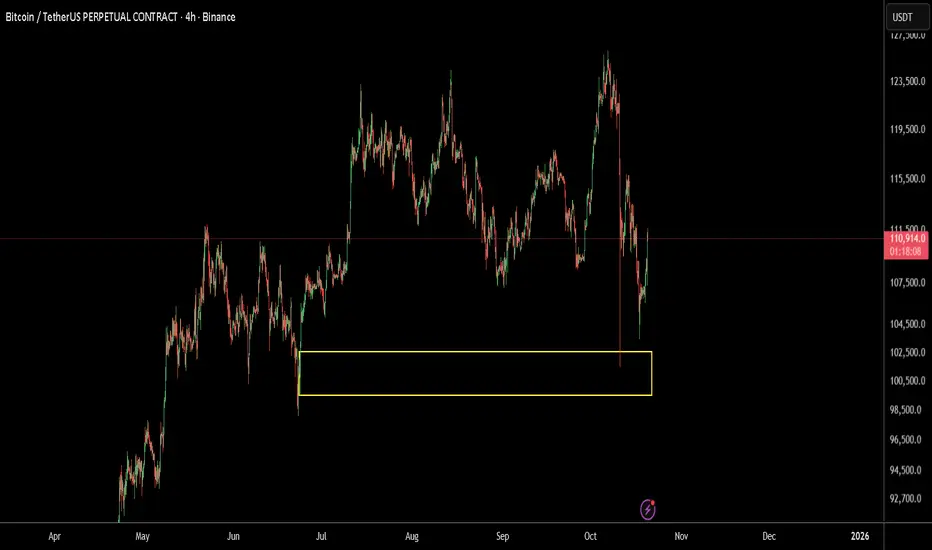
BTC not ready to go down yet!Many may be scared buy recent BTC fall and wondering what is next ? Well it needs to break the Origin of upmove (yellow box) to go down further. But right now it bounced from there so we need to wait for break of yellow box for more downside.
Bitcoin in Buy Zone – Expecting a Short-Term RallyBTC/USDT is currently holding above the support zone around 106,300, forming higher lows on the 15-minute chart.
I’ve entered a long position near 106,600–106,800, targeting the 108,590 level for a potential 1.9% upside move.

Introduction to IPOs in IndiaIntroduction
An Initial Public Offering (IPO) represents the first sale of a company's shares to the public, allowing the firm to raise capital from a wide pool of investors. In India, IPOs are a crucial avenue for both corporate growth and investor participation. They allow private companies to transition into publicly listed entities, enhancing their credibility, visibility, and financial flexibility.
The Indian IPO market has seen substantial growth over the past few decades, driven by economic expansion, policy reforms, technological innovation, and increasing investor awareness. For investors, IPOs offer an opportunity to participate in the growth story of emerging companies. For the economy, they facilitate capital formation and resource allocation toward productive sectors.
Regulatory Framework Governing IPOs in India
The IPO process in India is strictly regulated to protect investor interests and ensure transparency. The key regulatory authorities are:
Securities and Exchange Board of India (SEBI): SEBI regulates the issuance of securities under the SEBI (Issue of Capital and Disclosure Requirements) Regulations, 2018. It ensures that companies disclose complete, accurate, and timely information about their financial health, business risks, and objectives of fund utilization.
Stock Exchanges: IPOs must be listed on recognized stock exchanges such as the National Stock Exchange (NSE) or Bombay Stock Exchange (BSE). Exchanges ensure compliance with listing requirements, including corporate governance norms.
RBI (Reserve Bank of India): While RBI is not directly involved in IPO approvals, it oversees foreign investments and ensures compliance with capital account regulations for Non-Resident Indians (NRIs) investing in IPOs.
Merchant Bankers/Lead Managers: Investment banks or merchant bankers facilitate the IPO process, from drafting the prospectus to managing investor subscriptions.
Registrar and Depositories: Registrars handle the allotment of shares, while depositories such as NSDL and CDSL maintain electronic records of shareholding.
The IPO Process in India
The IPO process in India is structured and multi-staged to ensure regulatory compliance and transparency:
1. Pre-IPO Preparation
Before going public, a company must strengthen its internal systems and governance structures. Steps include:
Corporate Restructuring: Streamlining operations, consolidating subsidiaries, and cleaning up financial statements.
Due Diligence: Legal, financial, and operational checks to ensure transparency.
Engaging Advisors: Hiring investment bankers, auditors, and legal advisors.
Board Approval: The company’s board must approve the IPO plan and submission to SEBI.
2. Filing Draft Prospectus with SEBI
The company submits a Draft Red Herring Prospectus (DRHP) to SEBI. The DRHP contains critical information including:
Business model and strategy
Financial statements and projections
Risks and uncertainties
Promoter details and shareholding pattern
Purpose of the IPO (capital utilization plans)
SEBI reviews the DRHP, suggesting modifications or clarifications to ensure investor protection. Once approved, the company can file its Red Herring Prospectus (RHP) with stock exchanges.
3. Pricing and Marketing
The company must decide the IPO pricing mechanism:
Fixed Price IPO: A predetermined price per share is set. Investors know the exact cost.
Book Building IPO: Investors bid within a price band, and the final price is determined based on demand.
During this stage, companies conduct roadshows to market their shares to institutional investors and create awareness. Institutional investors, including mutual funds and insurance companies, play a vital role in subscription and price discovery.
4. IPO Opening and Subscription
The IPO is opened for subscription to:
Retail Investors: Individuals with an investment limit under SEBI norms (usually ₹2 lakh per application).
Qualified Institutional Buyers (QIBs): Banks, mutual funds, insurance companies, and corporates.
Non-Institutional Investors (NIIs): High-net-worth individuals or entities investing above a specified limit.
Investors apply through banks, stockbrokers, or online trading platforms. In modern India, electronic IPO application (ASBA – Application Supported by Blocked Amount) is mandatory for retail and non-institutional investors to ensure a smooth and secure application process.
5. Allotment and Listing
Post-subscription, shares are allotted to investors based on demand. In case of oversubscription, shares are allotted proportionally through a lottery system. Once allotted, shares are credited to investors’ demat accounts.
Finally, shares are listed on NSE and BSE. The listing day is crucial as it sets the market benchmark for IPO performance. A successful listing often leads to a surge in share prices, commonly known as “listing gains.”
Types of IPOs in India
India has witnessed various types of IPO structures:
Initial Public Offering (IPO): Traditional method where shares are offered to the public for the first time.
Follow-on Public Offering (FPO): Additional shares issued by an already listed company.
Rights Issue: Shares offered to existing shareholders before offering to the general public.
Offer for Sale (OFS): Promoters or early investors sell their stake to the public, often seen in large-cap firms.
Book-Built IPOs vs Fixed-Price IPOs: As mentioned earlier, the pricing mechanism differs, with book-building being the more popular modern method.
Trends in the Indian IPO Market
The Indian IPO market has evolved dynamically over the last two decades. Some notable trends include:
Rising Retail Participation: With digital banking and dematerialized accounts, retail investors increasingly participate in IPOs, contributing significantly to subscriptions.
Tech and Start-up IPOs: Companies in the IT, fintech, and e-commerce sectors, such as Zomato, Paytm, and Nykaa, have created high investor excitement.
Large-Cap IPOs: Established companies continue to go public, providing investors with a blend of growth and relative safety.
Regulatory Reforms: SEBI introduced reforms like fast-track IPOs for smaller companies and enhanced disclosure requirements to boost investor confidence.
Global Investor Inflows: Foreign institutional investors (FIIs) actively participate in Indian IPOs, reflecting confidence in India’s growth story.
Advantages of IPOs in India
For companies:
Capital Raising: IPOs provide a large amount of capital without increasing debt.
Brand Visibility: Public listing enhances credibility and visibility.
Liquidity for Promoters: Founders and early investors can monetize part of their holdings.
Expansion Opportunities: Funds raised can be used for acquisitions, research, technology, and market expansion.
For investors:
High Growth Potential: Early investment in high-growth companies can yield significant returns.
Portfolio Diversification: IPOs provide access to new sectors and businesses.
Market Participation: Encourages a culture of investment and wealth creation among the general public.
Risks and Challenges
Despite the potential benefits, IPOs carry significant risks:
Market Volatility: Listing day prices can be highly volatile, influenced by demand-supply dynamics and macroeconomic factors.
Overvaluation: Hype-driven IPOs may trade below issue price post-listing if valuations are unrealistic.
Limited Information: Despite SEBI regulations, investors may not fully understand business risks.
Lock-in Period: Promoter shares often have a lock-in period, which may restrict liquidity in the short term.
Recent Developments in India’s IPO Market
The Indian IPO ecosystem is becoming more sophisticated:
Digital IPO Platforms: Integration with UPI, net banking, and trading apps has simplified subscription and payment processes.
Retail-Centric Approaches: SEBI mandates minimum 35% allocation to retail investors in most IPOs.
Emergence of Unicorn IPOs: Technology startups and fintech companies have gone public, attracting substantial attention from domestic and global investors.
ESOP Buybacks and Employee Incentives: Companies often offer shares to employees before listing, fostering employee wealth creation.
Conclusion
The IPO market in India is a vibrant component of the financial ecosystem, offering a symbiotic platform for companies to raise capital and investors to access early-stage growth opportunities. With robust regulatory oversight, digital infrastructure, and growing investor awareness, India’s IPO market continues to expand and evolve.
However, while IPOs provide opportunities for wealth creation, investors must exercise due diligence, evaluate fundamentals, and assess risks before participating. Understanding the IPO mechanism, market trends, and regulatory landscape is essential for both corporate leaders and investors to make informed decisions.
India’s IPO market not only strengthens individual companies but also contributes to overall economic growth by channeling resources efficiently, promoting transparency, and expanding capital markets. With innovation, technology-driven platforms, and increasing investor participation, India is poised to see more dynamic IPO activity in the years ahead.
$BTC - Modified Harmonic in the making?
Watching a modified harmonic pattern — looks close to a Gartley-type structure, though AB retraces ~0.577 of XA (a bit shallow, but still within harmonic tolerance).
PRZ (potential reversal zone): 120–121k, around the 0.786 XA retracement.
If 108k gets reclaimed, I’ll start considering a long setup targeting that PRZ zone.
On the weekly, RSI is hovering near 50, which often acts as a bullish reset zone in an uptrend — worth watching for continuation strength.
Let’s see if BTC can reclaim structure and complete the pattern 👀

[SeoVereign] BITCOIN BEARISH Outlook – October 18, 2025Today, as of October 19, I would like to share my bearish (short) outlook on Bitcoin.
First Basis — IR BAT (Invalid Reaction BAT)
The core of this analysis lies in the IR BAT pattern, a concept I independently devised.
It is an adaptation of the traditional BAT pattern,
based on the principle that if no valid rebound occurs within a certain period after entering the PRZ (Potential Reversal Zone),
the pattern is considered invalid,
and the price tends to move strongly beyond the PRZ in that direction.
Currently, Bitcoin has entered the PRZ zone of the BAT pattern
but is showing sideways and weak movements without any significant buying reaction,
which satisfies the typical bearish scenario conditions of an IR BAT.
Second Basis — 0.2~0.5 Retracement Zone
At present, the chart is positioned within the 0.2–0.5 Fibonacci retracement zone relative to the upper structure.
This area is generally interpreted as a sell-dominant zone in the IR BAT (Invalid Reaction BAT) pattern,
where short-term rebounds are limited and re-declines tend to emerge.
Accordingly, the average target price is set around 102,570 USDT.
Depending on future price developments,
I will provide further updates regarding any changes to this idea and position management strategies.
Thank you for reading.

BITCOIN IDEA MMSM -> MMBM
Looking for a reversal here,
Market maker sell model -> Market maker buy model

Btc is getting ready for upside as it was rejected by order blocAs it has good order block. Btc can move up upto the target shown in the chart

Bonds and Fixed Income Trading in the Indian MarketIntroduction
Bonds and fixed-income instruments form the backbone of the debt market, serving as crucial avenues for capital formation and risk management. Unlike equities, which represent ownership in a company, bonds are debt instruments issued by governments, corporations, or financial institutions, providing fixed returns over a predetermined period. In India, the fixed-income market has evolved substantially over the past decades, driven by regulatory reforms, growing investor awareness, and the need for diversified investment options. Understanding bonds and fixed-income trading is essential for investors, fund managers, and institutions aiming to manage interest rate risk, generate income, and balance investment portfolios.
Understanding Bonds
A bond is essentially a loan made by an investor to an issuer, who promises to pay interest (coupon) at fixed intervals and return the principal amount on maturity. Bonds vary based on several parameters:
Issuer Type:
Government Bonds: Issued by the Central or State Governments. Examples include Treasury Bills (T-Bills), Government Securities (G-Secs), and State Development Loans (SDLs).
Corporate Bonds: Issued by companies to raise capital. These can be investment-grade or high-yield bonds depending on the issuer’s creditworthiness.
Municipal Bonds: Issued by urban local bodies for infrastructure projects.
Tenure: Bonds can be short-term (less than 1 year), medium-term (1–5 years), or long-term (5 years and above).
Coupon Type:
Fixed Coupon Bonds: Pay a predetermined interest rate.
Floating Rate Bonds: Coupon varies with benchmark rates like MIBOR or RBI repo rates.
Zero-Coupon Bonds: Sold at a discount and redeemed at face value; no periodic interest is paid.
Credit Rating: Rating agencies like CRISIL, ICRA, CARE, and Fitch assess creditworthiness. Higher-rated bonds carry lower default risk but offer lower yields.
Indian Bond Market Structure
The Indian bond market can be broadly divided into government securities market and corporate debt market.
Government Securities Market
The government securities market is the largest segment of the Indian debt market. The Reserve Bank of India (RBI) is the primary regulator and issuer of government securities. Instruments include:
Treasury Bills (T-Bills): Short-term securities issued at a discount with maturities of 91, 182, or 364 days. They are zero-coupon instruments and highly liquid.
Government Bonds (G-Secs): Medium- and long-term debt instruments with fixed or floating coupons. They fund fiscal deficits and infrastructure projects.
State Development Loans (SDLs): Issued by state governments, these bonds are similar to G-Secs but carry slightly higher yields due to state-specific credit risk.
Corporate Debt Market
The corporate bond market in India has witnessed significant growth, though it remains smaller than the government securities market. Key features include:
Issued by public and private sector companies.
Can be listed on exchanges like NSE and BSE or traded over-the-counter (OTC).
Includes instruments like non-convertible debentures (NCDs), commercial papers (CPs), and perpetual bonds.
The corporate bond market allows companies to raise long-term funds efficiently while offering investors higher yields compared to government securities, albeit with higher risk.
Participants in the Indian Bond Market
The Indian bond market comprises a variety of participants:
Retail Investors: Individuals seeking stable returns, typically investing through government bonds, NCDs, or mutual funds.
Institutional Investors: Insurance companies, pension funds, mutual funds, and banks. They dominate the market due to large capital requirements.
Foreign Institutional Investors (FIIs): Invest in Indian government and corporate bonds, subject to regulatory approvals. Their participation adds liquidity and depth to the market.
Brokers and Dealers: Facilitate buying and selling of bonds on exchanges and OTC platforms.
Regulatory Authorities: RBI and SEBI regulate issuance, trading, and settlement of bonds to maintain market integrity.
Bond Pricing and Yield
Understanding bond pricing and yields is fundamental for trading. The price of a bond depends on the present value of its future cash flows discounted at prevailing market interest rates. Key concepts include:
Yield to Maturity (YTM): Total return expected if the bond is held until maturity.
Current Yield: Annual coupon divided by current market price.
Price-Yield Relationship: Bond prices move inversely to interest rates; when rates rise, bond prices fall, and vice versa.
In India, yield curves are published regularly by the RBI, showing the relationship between bond yields and maturities. These curves help investors make informed trading decisions.
Trading Mechanisms in India
Bond trading in India occurs through primary and secondary markets.
Primary Market
In the primary market, bonds are issued for the first time.
Government securities are auctioned by the RBI using competitive and non-competitive bidding.
Corporate bonds are issued through private placements or public offerings, often under SEBI regulations.
Secondary Market
Secondary trading involves buying and selling existing bonds.
For government securities, trading occurs on platforms like the NSE NDS-OM (Negotiated Dealing System – Order Matching) and OTC markets.
Corporate bonds are traded over-the-counter or on exchanges such as NSE and BSE.
The secondary market ensures liquidity, enabling investors to adjust portfolios according to interest rate movements or credit risk perceptions.
Risk Factors in Bond Investing
Even though bonds are considered safer than equities, they carry certain risks:
Interest Rate Risk: Price of bonds fluctuates with changes in market interest rates. Long-term bonds are more sensitive.
Credit Risk: Risk of issuer default. High-yield corporate bonds carry higher credit risk.
Liquidity Risk: Some bonds, especially corporate and municipal bonds, may be hard to sell quickly without impacting the price.
Reinvestment Risk: Risk of reinvesting coupons at lower rates when interest rates fall.
Inflation Risk: Inflation erodes real returns, particularly on fixed-coupon instruments.
Role of Technology and Exchanges
Technology has transformed bond trading in India, improving transparency, efficiency, and accessibility. Key developments include:
Electronic Trading Platforms: NSE NDS-OM for government securities and BSE’s bond platform for corporate bonds.
Real-Time Price Discovery: Investors can view live bid-ask spreads, yields, and volumes.
Settlement Systems: Clearing corporations like CCIL ensure efficient settlement and reduce counterparty risk.
These innovations have made trading safer and more efficient, encouraging greater participation from retail and institutional investors.
Regulatory Framework
The bond market in India is highly regulated to ensure investor protection and market stability.
Reserve Bank of India (RBI):
Manages issuance and trading of government securities.
Implements monetary policy, influencing interest rates and liquidity.
Securities and Exchange Board of India (SEBI):
Regulates issuance and trading of corporate bonds.
Ensures transparency, disclosure, and fair practices in the market.
Credit Rating Agencies: Assess the creditworthiness of issuers to help investors make informed decisions.
Regulations have promoted the growth of a more transparent and efficient market over the last two decades.
Investment Strategies in Bonds
Investors adopt different strategies based on their risk appetite, time horizon, and market outlook:
Buy and Hold: Investors purchase bonds and hold them until maturity to earn stable coupon payments.
Trading on Yield Movements: Active traders buy bonds when interest rates are high and sell when rates fall.
Laddering Strategy: Investing in bonds with staggered maturities to reduce reinvestment and interest rate risks.
Credit Diversification: Combining government, corporate, and high-yield bonds to balance risk and return.
Bond mutual funds and ETFs are also popular instruments for retail investors seeking diversification and professional management.
Challenges and Future Outlook
Despite steady growth, the Indian bond market faces certain challenges:
Limited Retail Participation: High minimum investment amounts and complexity deter retail investors.
Corporate Bond Liquidity: Secondary market liquidity for corporate bonds remains lower than for government securities.
Interest Rate Volatility: Rapid policy changes can impact yields and bond prices.
However, the outlook is positive due to:
Increased FII participation in government and corporate bonds.
Growing awareness of fixed-income products among retail investors.
Technological innovations improving market access and efficiency.
Government initiatives like the Bharat Bond ETF, which allow retail investors to access high-quality corporate bonds.
Conclusion
Bonds and fixed-income instruments play a vital role in India’s financial ecosystem, providing stable income, risk diversification, and capital market depth. The Indian market has matured over the years, offering a variety of instruments for investors with different risk appetites. While challenges like liquidity constraints and interest rate sensitivity remain, regulatory reforms, technological advancements, and increasing investor awareness are strengthening the market. For both individual and institutional investors, understanding the dynamics of bond pricing, yield, risk factors, and trading mechanisms is essential to effectively navigate the Indian fixed-income market. As India’s economy continues to grow, the fixed-income market is expected to expand further, offering new opportunities for investors seeking stability and returns in a diversified portfolio.

BTC - S & R levels. Buy some long qty now at support nowBTC is at support and profit booking and weak hands giving up qty. I have not see any big players stopped accumulation..... price is at good or reasonable buy levels for atleast one to 3 months i expect price to see new ATH again. few groups booking profits at every new ATH for buying back at support and safer levels.... Buy now for good investments with atleast 2 weeks to 2 months time period for great profits or else book profits as u wish

BTC SWING PLAY LONGChart Overview and Data
• Asset: BITCOIN/TETHERUS PERPETUAL CONTRACT.
• Time Frame: The chart shows data up to "16 Oct" (likely the date the screenshot was taken). The primary candles visible span from approximately June to October of the current year, with the x-axis extending into 2026, suggesting a daily (1D) or weekly (WEEK) candlestick view, though the top-left corner indicates "1D - WEEK", which might mean the current view is Daily (1D) within a larger Weekly (WEEK) analysis context.
• Price: The current price is approximately $107,705.3, and the asset is down $3,007.6 (-2.72%) for the period shown.
• Trading Action: There are prominent SELL and BUY buttons at the top left, with current bid/ask prices of $107,691.3 (SELL) and $107,691.4 (BUY).
Technical Analysis Elements
Candlestick Pattern
• The chart uses candlesticks to represent price action over time.
• The recent price action (around August to October) shows a period of consolidation or a slight uptrend that has recently seen a significant drop, as indicated by the large red candlestick currently forming (the one far to the right).
Indicators and Lines
• Moving Averages: Several moving average lines (blue and purple, and possibly a thinner red line) are overlaid on the candlesticks, typically used to identify trend direction.
• Support and Resistance:
• Support Zones (Red Boxes/Lines): Several horizontal red lines and a large red-shaded area beneath the current price action indicate potential support levels where traders expect buying interest to emerge. Key price points marked by red lines are around $106,973, $103,204, $101,297, and the "Low" at $98,125.2. Further support is indicated by the lowest red line at $89,076.1.
• Resistance/Target Zone (Yellow/Green Box): A prominent yellow horizontal line at $126,220.2 (labeled "High") acts as a significant resistance level or a potential upside target. The large green-shaded area above the current price, extending up to $161,047.0, appears to represent a profit target or a long-term trading objective for a potential long position.
Trade Setup Indication
• The chart appears to be illustrating a potential short trade setup, or a breakdown scenario, given:
• The large red-shaded area below the current price, which could be a projected target zone for a short position.
• The significant price drop in the last candle, breaking below recent support.
• Small arrows and boxes near the consolidation area (around July/August) also suggest previous or ongoing trade indications.
Axis and Additional Information
• Y-Axis: Represents the price of BTCUSDT, ranging from approximately $84,800 up to $161,047.
• X-Axis: Represents time, spanning from approximately July to April 2026.
• Volume: A smaller chart pane at the bottom shows volume data, represented by red and green vertical bars, which helps gauge the strength behind price movements.

Part 12 Trading Master Class With Experts Importance of Knowledge and Timing:
Successful option trading depends heavily on market knowledge, timing, and strategy selection. Understanding concepts like intrinsic value, time decay (theta), volatility (vega), and interest rate effects (rho) is essential. Mistimed trades or poorly chosen strategies can lead to total loss of the premium. Additionally, options are time-sensitive assets, meaning the value erodes as expiration approaches. Traders must monitor market conditions and adjust positions accordingly. While options can offer high returns, they also carry significant risk, and disciplined analysis, research, and risk management are crucial to navigate the complexity of option markets effectively.

