How to Build a Crypto Portfolio for Long-Term Wealth?Hello Traders!
The crypto market can look exciting, fast profits, new coins every week, and hype everywhere.
But those who build long-term wealth in crypto don’t chase trends; they build structured portfolios with strategy.
Let’s understand how to create a crypto portfolio that can grow steadily over time, not just in bull runs.
1. Decide Your Investment Horizon
Before buying anything, decide your goal, 3 years, 5 years, or 10 years.
Longer horizons allow you to ride out volatility and benefit from compounding.
If you’re thinking short term, you’re speculating, not investing.
2. Allocate Wisely – The 60/30/10 Rule
60%: Blue-chip cryptos like Bitcoin (BTC) and Ethereum (ETH) , the foundation of your portfolio.
30%: Promising large/mid-cap projects (Layer-1s, AI, DeFi leaders).
10%: High-risk, high-reward small-cap or emerging tokens.
This keeps your portfolio stable while still giving growth exposure.
3. Diversify Across Categories
Don’t just hold coins, diversify across crypto sectors:
~Layer-1 platforms (ETH, SOL, AVAX)
~DeFi (AAVE, UNI)
~Infrastructure (LINK, ARB)
~AI/Metaverse (INJ, RNDR, MATIC)
This ensures that if one sector underperforms, others balance your returns.
4. Use SIP or DCA Method
Instead of buying everything at once, invest gradually through Systematic Investment Plans (SIP) or Dollar Cost Averaging (DCA) .
This helps you accumulate more during dips and reduces emotional stress during corrections.
5. Secure and Rebalance Regularly
Use hardware wallets for long-term storage. Don’t keep large amounts on exchanges.
Review your portfolio every 3–6 months and rebalance to maintain original allocation.
Trim profits from overperforming assets and add to undervalued ones.
Rahul’s Tip:
Crypto investing is not about catching every rally, it’s about staying long enough to see technology grow and adoption rise. Patience is your biggest alpha.
Conclusion:
A strong crypto portfolio is like a business, diversified, secure, and managed with discipline.
If you build it smartly, it can become a powerful wealth creator over time.
If this post helped you plan your crypto journey, like it, drop your thoughts in comments, and follow for more practical investment insights!
Trade ideas
Bitcoin Correction = Smart Money Opportunity, ready for 3% move!Bitcoin (BTCUSDT) has been consolidating inside a well-defined descending channel , reflecting a healthy correction phase after the recent rally. While many traders panic in these phases, experienced players know that corrections are temporary, structures define direction.
Notice how price is approaching a key zone between 117K–116K, which aligns perfectly with both the lower channel boundary and the prior breakout retest zone. This area acts as a high-probability reversal zone , where strong hands are likely waiting for confirmation candles to re-enter the trend.
Psychologically, the 120K round level remains crucial. Expect volatility near this zone, as retail traders get trapped while smart money positions itself quietly before the breakout.
Once the breakout sustains above 121K, short-term traders could target levels around 122.5K–123K , while positional traders may aim for much higher structural targets.
Rahul’s Tip:
Never fear a pullback when structure stays intact, institutions use these dips to accumulate while the public exits too early. Stay patient, let the structure play out.
Analysis By @TraderRahulPal (TradingView Moderator)
If this breakdown and re-entry logic helped you, don’t forget to like and follow for regular updates.
Disclaimer: This analysis is for educational purposes only and should not be taken as financial advice. Please do your own research or consult your financial advisor before investing.

Part 11 Trading Master ClassWhat Is Option Trading?
Option trading is a form of derivatives trading, where investors buy or sell contracts that give them the right but not the obligation to buy or sell an underlying asset (such as stocks, indices, or commodities) at a predetermined price before or on a specific date.
Unlike stocks, which represent ownership in a company, options represent a financial contract derived from the price movement of another asset — hence, they are part of the derivatives market.
There are two main types of options:
Call Options: Give the holder the right to buy an asset at a set price.
Put Options: Give the holder the right to sell an asset at a set price.
Each option contract involves:
Strike Price: The agreed-upon price for buying/selling the asset.
Expiry Date: The last date the option can be exercised.
Premium: The price paid to buy the option.

Introduction to Stock Market Investing1. Understanding the Stock Market
The stock market is a complex network of exchanges where buyers and sellers trade shares of publicly held companies. It functions similarly to an auction system, with prices determined by supply and demand. Major stock exchanges globally include the New York Stock Exchange (NYSE), NASDAQ, London Stock Exchange (LSE), and in India, the National Stock Exchange (NSE) and Bombay Stock Exchange (BSE).
1.1 Role of the Stock Market
Capital Formation: Companies raise funds for expansion and operations by issuing shares.
Liquidity: Investors can easily buy or sell shares, providing flexibility and access to cash.
Price Discovery: The stock market reflects the perceived value of companies based on performance, future prospects, and investor sentiment.
Economic Indicator: Stock market trends often indicate the economic health of a country.
2. Types of Stock Market Investments
Investing in stocks is not a one-size-fits-all approach. Different investment types cater to varied risk appetites, time horizons, and financial goals.
2.1 Common Stocks
Common stocks represent ownership in a company and provide voting rights in shareholder meetings. Investors earn returns primarily through:
Capital Gains: Selling shares at a higher price than purchased.
Dividends: Periodic earnings distributed by the company.
2.2 Preferred Stocks
Preferred stocks are a hybrid between bonds and common stocks. They provide fixed dividends and have priority over common stocks in case of liquidation but usually lack voting rights.
2.3 Bonds
Though technically not stocks, bonds are debt instruments issued by companies or governments. Investors receive interest and principal repayment. Bonds are considered safer than stocks but typically offer lower returns.
2.4 Mutual Funds and ETFs
For beginners, mutual funds and exchange-traded funds (ETFs) provide a diversified investment portfolio managed by professionals. Mutual funds pool money from multiple investors to buy a mix of stocks, bonds, or other assets. ETFs, traded like stocks, track specific indices, sectors, or commodities.
2.5 Derivatives
Derivatives such as options and futures derive value from underlying assets like stocks. They are advanced tools used for hedging or speculative purposes and carry higher risk.
3. Basics of Stock Market Analysis
Successful investing requires analysis to make informed decisions. There are two main approaches:
3.1 Fundamental Analysis
Fundamental analysis evaluates a company’s intrinsic value by examining:
Financial Statements: Balance sheets, income statements, and cash flow statements.
Profitability Ratios: Return on equity, profit margins.
Growth Prospects: Revenue growth, market share, and industry trends.
Economic Conditions: Interest rates, inflation, and overall economic climate.
The goal is to identify undervalued stocks for long-term investment.
3.2 Technical Analysis
Technical analysis studies price movements and trading volumes using charts and statistical indicators. Key tools include:
Moving Averages: Identify trends over time.
Relative Strength Index (RSI): Measures overbought or oversold conditions.
Support and Resistance Levels: Price points where stocks typically reverse trends.
This approach is often preferred by traders focusing on short-term price movements.
4. Stock Market Strategies
Different investors adopt varying strategies based on their risk tolerance, investment horizon, and financial goals.
4.1 Long-Term Investing
Long-term investors, or “buy-and-hold” investors, focus on companies with strong fundamentals and growth potential. They tolerate short-term market volatility for wealth accumulation over years.
4.2 Dividend Investing
Investors seeking regular income invest in companies with consistent dividend payouts. Dividend reinvestment can significantly boost wealth over time.
4.3 Growth Investing
Growth investors target companies expected to grow faster than the market. These companies may not pay dividends, focusing instead on reinvesting profits to expand operations.
4.4 Value Investing
Value investors look for stocks trading below their intrinsic value. By analyzing fundamentals, they aim to buy undervalued stocks and benefit from price corrections over time.
4.5 Momentum and Day Trading
Active traders use momentum strategies to capitalize on short-term trends, while day traders buy and sell within the same day. These strategies require technical analysis, speed, and discipline.
5. Risk Management in Stock Investing
Investing in the stock market comes with risks. Effective risk management helps protect capital and improve long-term returns.
5.1 Types of Risk
Market Risk: Fluctuations due to economic or political events.
Company Risk: Poor performance or scandals affecting a particular company.
Liquidity Risk: Difficulty in selling shares quickly at desired prices.
Inflation Risk: Rising inflation reducing real returns.
Interest Rate Risk: Changes in interest rates affecting market valuations.
5.2 Risk Mitigation Strategies
Diversification: Spread investments across sectors and asset classes.
Asset Allocation: Balance between stocks, bonds, and cash based on risk appetite.
Stop-Loss Orders: Automatically sell stocks when they fall below a certain price.
Regular Review: Monitor portfolio performance and rebalance periodically.
6. Behavioral Aspects of Investing
Stock market investing is not purely analytical; psychology plays a critical role. Behavioral finance studies how emotions influence decision-making.
6.1 Common Investor Biases
Overconfidence: Believing one can predict the market accurately.
Herd Mentality: Following trends without independent analysis.
Loss Aversion: Fear of losses leading to poor decision-making.
Recency Bias: Giving more weight to recent market events than historical data.
6.2 Developing the Right Mindset
Successful investors cultivate patience, discipline, and long-term thinking. Emotional control during market volatility is key to avoiding impulsive decisions.
7. Tools and Resources for Investors
Investors have access to numerous tools and resources to make informed decisions:
Stock Screeners: Identify potential investment opportunities.
Financial News Portals: Bloomberg, Reuters, and Moneycontrol provide up-to-date market information.
Research Reports: Detailed analysis from brokerage firms.
Investment Apps: Platforms for trading and portfolio management.
8. Regulatory Framework and Investor Protection
Stock markets operate under strict regulations to ensure transparency, fairness, and investor protection. Key regulatory bodies include:
SEBI (India): Securities and Exchange Board of India.
SEC (USA): Securities and Exchange Commission.
FCA (UK): Financial Conduct Authority.
Investor protection measures include disclosure requirements, insider trading regulations, and grievance redressal mechanisms.
9. Advantages and Challenges of Stock Market Investing
9.1 Advantages
Potential for high returns compared to traditional savings instruments.
Liquidity and ease of buying/selling shares.
Opportunity to participate in the growth of leading companies.
Diversification through mutual funds, ETFs, and global markets.
9.2 Challenges
Market volatility can lead to short-term losses.
Requires knowledge and research to avoid poor investments.
Emotional stress due to fluctuating market conditions.
Exposure to macroeconomic and geopolitical risks.
10. Steps to Begin Investing
Starting with stock market investing requires a structured approach:
Set Financial Goals: Determine short-term and long-term objectives.
Learn Basics: Understand financial statements, market indices, and investment types.
Choose Investment Platform: Open a brokerage or demat account.
Start Small: Begin with small investments and gradually increase exposure.
Diversify Portfolio: Invest across sectors and asset classes.
Monitor and Adjust: Review performance and adapt strategies as needed.
Stay Informed: Keep updated with market trends, news, and economic indicators.
Conclusion
Stock market investing offers a powerful avenue for wealth creation but requires knowledge, discipline, and patience. From understanding market mechanics to analyzing stocks, adopting strategies, managing risks, and overcoming behavioral biases, a well-rounded approach increases the likelihood of long-term success. By starting early, investing wisely, and staying informed, investors can harness the full potential of the stock market to achieve their financial goals.
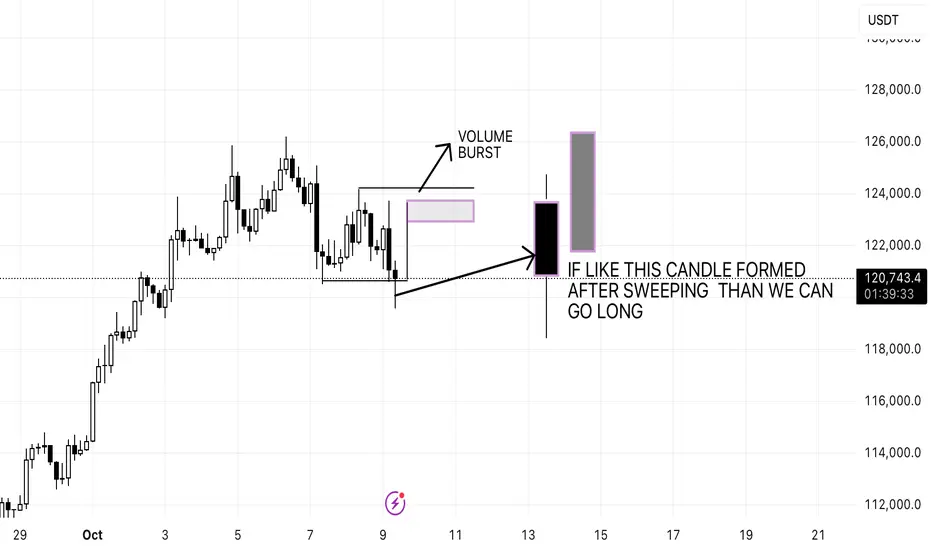
LONG BTC AFTER SWEEPING OR AFTER EFFECTOnce the candle closed above the black line and make a hanging man with a marubuzu candle than we can achieve the marked target or our previous analysis will continue
BTCUSD SHORT VIEW AT 4HAS per my analysis the supply is getting power full and demand is getting week as we can see on chart thats the reason to go short

Midcap Multi-Bagger Moves in Trading1. Understanding Midcap Stocks
Midcap stocks generally refer to companies with a market capitalization ranging between ₹5,000 crore to ₹20,000 crore (or $500 million to $5 billion) depending on the market. They strike a balance between stability and growth potential:
Large-cap stocks are stable but slow-growing.
Small-cap stocks offer high growth but come with extreme volatility.
Midcap stocks combine growth potential with manageable risk, making them ideal candidates for multi-bagger moves.
Midcaps are often in the growth phase of their lifecycle. They have proven business models but are not yet fully recognized by institutional investors. This under-representation creates opportunities for early investors to gain extraordinary returns.
2. Characteristics of Midcap Multi-Bagger Stocks
Not all midcap stocks become multi-baggers. Successful midcap multi-baggers usually share some common characteristics:
Strong Revenue and Earnings Growth: Companies showing consistent growth in revenue and net profits, often higher than industry averages.
Scalable Business Model: Ability to expand operations, enter new markets, or increase product offerings without proportionally increasing costs.
Innovative Products/Services: Midcaps introducing unique products or services that create market disruption.
High Return Ratios: Consistently high ROE (Return on Equity) and ROCE (Return on Capital Employed) indicate efficient use of capital.
Low Debt Levels: Companies with manageable debt can reinvest profits into growth rather than servicing loans.
Institutional Recognition: Gradual interest from mutual funds and large investors often acts as a catalyst for price appreciation.
3. Factors Driving Multi-Bagger Moves
The movement of midcap stocks into multi-bagger territory is driven by a combination of fundamental, technical, and macroeconomic factors:
a) Fundamental Drivers
Profitability Expansion: Companies increasing margins due to operational efficiency, technology adoption, or scale benefits.
Sectoral Tailwinds: Industries experiencing high demand, regulatory support, or government incentives (like IT, renewable energy, pharmaceuticals).
Market Share Gains: Companies successfully capturing competitors’ market share through innovation or cost leadership.
b) Technical Drivers
Breakout Patterns: Price movements above historical resistance levels often attract momentum traders.
Volume Expansion: Rising volumes signal genuine investor interest and reduce liquidity concerns.
Institutional Accumulation: When large investors buy in gradually, it supports price stability and long-term uptrend.
c) Macroeconomic Factors
Economic Growth: Midcaps benefit more in a growing economy due to scalability and higher discretionary spending.
Policy Support: Favorable government policies like Make in India, tax incentives, or industry-specific reforms accelerate growth.
Liquidity Conditions: Low-interest rates and higher retail participation often drive up stock prices, including midcaps.
4. Strategies to Identify Midcap Multi-Baggers
Investors employ multiple strategies to identify potential midcap multi-baggers:
Fundamental Analysis:
Analyze balance sheets for revenue and profit growth.
Assess profitability ratios like ROE, ROCE, and profit margins.
Check debt-to-equity ratios and cash flows.
Sectoral Analysis:
Identify industries with high growth potential.
Look for midcaps within these sectors that are leaders or emerging leaders.
Technical Screening:
Use moving averages, trend lines, and volume indicators to spot breakout stocks.
Identify consolidation patterns that precede a rally.
Growth vs. Valuation Analysis:
A true multi-bagger is often undervalued relative to its growth potential.
Metrics like PEG ratio (Price/Earnings to Growth) can be useful.
Tracking Promoter Holding and Insider Buying:
Increasing promoter confidence is often a precursor to stock price appreciation.
Macro Awareness:
Be aware of government initiatives, economic cycles, and sector-specific reforms.
5. Risks Associated with Midcap Multi-Baggers
While midcap multi-baggers are enticing, they come with risks that every trader should be aware of:
Volatility: Prices can fluctuate dramatically due to low liquidity.
Market Sentiment: Negative news or global macro events can disproportionately impact midcaps.
Execution Risk: Companies may fail to scale operations efficiently, leading to missed expectations.
Overvaluation Risk: During bull markets, midcaps often get overvalued, leading to corrections.
Regulatory Risk: Policy changes can affect midcap companies more than established large-cap firms.
Risk management strategies like stop-loss orders, portfolio diversification, and position sizing are crucial to protect capital.
6. Trading Approaches for Midcap Multi-Baggers
There are multiple ways to approach midcap multi-bagger stocks in trading:
a) Long-Term Investment (Buy & Hold)
Buy fundamentally strong midcaps with multi-bagger potential.
Hold through market volatility to realize exponential gains over 3-5 years.
b) Momentum Trading
Focus on midcaps showing breakout patterns, high relative strength, and institutional buying.
Enter during upward trends and exit once momentum weakens.
c) Swing Trading
Identify short-term price oscillations in fundamentally strong midcaps.
Capitalize on price swings while limiting exposure to prolonged downturns.
d) Options Strategies
Use call options to leverage returns with limited capital in highly promising midcap stocks.
Protective puts can hedge against unexpected downtrends.
7. Case Studies of Midcap Multi-Baggers
Several midcap companies in India and globally have delivered exceptional returns:
Bajaj Finance (India) – Evolved from midcap to large-cap, delivering 10x+ returns over a decade.
Page Industries (India) – Niche player in textiles, achieved multi-bagger status due to consistent growth.
Eicher Motors (India) – Benefited from strong product positioning and market share gains.
Case studies highlight the importance of timely investment, research, and patience in reaping multi-bagger benefits.
8. Tips for Retail Traders
Diversify: Avoid putting all capital into one midcap stock.
Focus on Fundamentals: Short-term volatility may be high, but strong fundamentals increase multi-bagger chances.
Monitor Trends: Follow market news, sector growth, and macroeconomic indicators.
Patience is Key: Multi-bagger moves often take 3–7 years to materialize.
Avoid Herd Mentality: Don’t chase stocks just because they are trending; focus on research-based picks.
Conclusion
Midcap multi-baggers represent a unique opportunity for traders and investors willing to balance risk and reward. These stocks lie at the intersection of growth, innovation, and market inefficiencies. While identifying them requires a combination of fundamental research, technical analysis, and macroeconomic awareness, the potential rewards can be extraordinary. By understanding the drivers, risks, and strategies involved, traders can position themselves to benefit from the transformational wealth creation that midcap multi-baggers offer.
The world of midcap trading is not for the faint-hearted, but for disciplined investors with a growth mindset, it can be the playground of extraordinary returns.
Consistent Trading Plan: The Long-Term Market Success1. Understanding a Consistent Trading Plan
A consistent trading plan is a documented framework that defines how a trader enters and exits trades, manages risk, and evaluates performance. It eliminates guesswork, emotional decision-making, and impulsive actions, providing a structured approach to achieve long-term profitability. Unlike short-term strategies that rely on luck or intuition, a trading plan focuses on repeatable processes backed by data, experience, and market logic.
Key features of a consistent trading plan include:
Clarity: Every rule and guideline is explicitly defined.
Discipline: Following the plan consistently without deviation.
Adaptability: Periodic evaluation to incorporate market changes.
Risk Management: Predefined risk per trade to preserve capital.
Performance Tracking: Continuous assessment to improve strategy.
2. Core Components of a Trading Plan
A robust trading plan is multidimensional. It involves technical, fundamental, psychological, and logistical elements. The following are the core components:
a. Market and Instrument Selection
Choosing the right market and instruments is the first step. Traders need to determine which asset classes they will trade—stocks, commodities, forex, or derivatives. Considerations include:
Liquidity: Higher liquidity ensures smoother trade execution.
Volatility: Volatility defines potential profit and risk per trade.
Trading Hours: Understanding market timing helps optimize entries and exits.
Personal Knowledge: Focus on markets and instruments you understand well.
b. Trading Strategy and Setup
A trading plan must clearly define the strategies used. This includes:
Trend-following vs. Counter-trend: Will you trade in the direction of the trend or against it?
Technical Indicators: Such as moving averages, RSI, MACD, or Fibonacci retracements.
Entry Criteria: Specific conditions that must be met to enter a trade.
Exit Criteria: Rules for taking profit or cutting losses.
c. Risk Management
One of the most crucial elements of a consistent plan is risk management. Without it, even profitable strategies can fail. Risk management involves:
Position Sizing: Determining the size of each trade based on account balance and risk tolerance.
Stop-loss Placement: Predefined points to limit losses.
Risk-Reward Ratio: A minimum acceptable ratio ensures profitable trades outweigh losing trades.
Diversification: Avoid overexposure to a single asset or sector.
d. Psychological Framework
Emotions are a trader’s biggest enemy. Fear, greed, and overconfidence can lead to impulsive decisions. A trading plan should address:
Emotional Awareness: Recognize your emotional triggers.
Discipline Protocols: Steps to stay disciplined during losses or winning streaks.
Routine: Establish pre-market and post-market rituals to maintain focus.
e. Performance Evaluation
Even the best plan requires ongoing evaluation. This includes:
Trade Journal: Record every trade with reasons for entry/exit, emotions, and outcomes.
Metrics Analysis: Track win/loss ratio, average profit/loss, drawdowns, and risk-adjusted returns.
Review Schedule: Weekly, monthly, or quarterly evaluations help refine strategies.
3. Building Your Trading Plan Step by Step
Creating a consistent trading plan is a step-by-step process. Here’s a structured approach:
Step 1: Define Your Trading Goals
Determine realistic profit targets and acceptable drawdowns.
Set short-term, medium-term, and long-term objectives.
Clarify your purpose: income generation, capital preservation, or wealth accumulation.
Step 2: Choose Your Trading Style
Select a style aligned with your personality and time availability:
Scalping: Quick trades, high frequency, requires constant attention.
Day Trading: Positions closed within a day, moderate time commitment.
Swing Trading: Trades held for days to weeks, suitable for part-time traders.
Position Trading: Long-term trades, less frequent monitoring, patience required.
Step 3: Define Entry and Exit Rules
Use technical indicators or chart patterns for entry triggers.
Determine precise exit points for profits and stop-losses.
Establish rules for adjusting positions as markets move.
Step 4: Implement Risk Management
Decide the maximum percentage of your account to risk per trade.
Define leverage usage if trading derivatives.
Prepare contingency plans for unexpected market events.
Step 5: Develop a Trading Routine
Allocate specific times for market analysis, order placement, and review.
Include pre-market preparation: reviewing charts, news, and economic data.
Conduct post-market reflection: assess trades and performance metrics.
Step 6: Track and Evaluate Performance
Maintain a detailed trading journal.
Analyze mistakes and successes.
Adjust strategies based on performance data, not emotion.
4. Psychological Discipline in a Trading Plan
A well-structured plan is ineffective without psychological discipline. Key principles include:
Consistency Over Perfection: Focus on following your plan rather than winning every trade.
Patience: Avoid impulsive trades; wait for setups that meet criteria.
Resilience: Accept losses as part of the process; never chase trades to recover.
Confidence in Strategy: Trust your plan, especially during drawdowns.
5. Common Mistakes Traders Make
Even with a trading plan, mistakes happen. Awareness is crucial:
Ignoring the Plan: Deviating from rules during emotional swings.
Overtrading: Entering trades without valid setups.
Poor Risk Management: Using high leverage or risking too much per trade.
Neglecting Journaling: Without tracking, you cannot improve.
Failure to Adapt: Markets evolve; static strategies may underperform.
6. Benefits of a Consistent Trading Plan
The advantages of following a disciplined, consistent plan are profound:
Reduced Emotional Stress: Confidence grows when rules guide decisions.
Better Risk Control: Systematic management reduces catastrophic losses.
Increased Profitability: Consistency compounds returns over time.
Improved Self-Awareness: Journaling reveals psychological strengths and weaknesses.
Adaptability: Regular evaluation allows strategy refinement without panic.
7. Tools to Support Your Trading Plan
Modern trading technology can enhance the effectiveness of your plan:
Trading Platforms: Real-time charts, indicators, and order execution.
Screeners and Alerts: Monitor opportunities aligned with your plan.
Journaling Software: Track trades and generate performance analytics.
Backtesting Tools: Validate strategies against historical data.
News and Economic Feeds: Stay informed of market-moving events.
8. Adapting Your Plan to Market Conditions
A consistent plan does not mean rigidity. Traders must:
Analyze Market Trends: Adjust strategies for bullish, bearish, or sideways markets.
Evaluate Volatility: Modify position sizing during high or low volatility periods.
Stay Updated: Economic policies, interest rates, and geopolitical events influence outcomes.
Refine Strategies: Remove setups that underperform; add new, tested methods.
9. Real-Life Example of a Consistent Trading Plan
Consider a swing trader in the stock market:
Market: Nifty 50 stocks.
Style: Swing trading, 2-5 day holding period.
Entry Rule: Buy when the 20-day moving average crosses above the 50-day moving average, confirmed by RSI below 70.
Exit Rule: Take profit at 5-10% gain or stop-loss at 2%.
Risk: 1% of total account per trade.
Routine: Review charts every morning, place orders, and update journal post-market.
Review: Weekly analysis to optimize entry/exit rules based on performance.
This example demonstrates the clarity and repeatability a trading plan provides.
10. Conclusion: Discipline is the Ultimate Profit Engine
A consistent trading plan is not a magic formula for instant wealth; it is a structured approach to long-term market success. It removes emotion, enforces discipline, and allows traders to focus on process over outcome. Traders who embrace a comprehensive plan—covering strategy, risk management, psychology, and evaluation—are far more likely to achieve sustainable profitability.
Remember, consistency in trading is not about winning every trade; it is about winning over time, learning from mistakes, and compounding gains in a disciplined manner. By committing to a consistent trading plan, you transform trading from a gamble into a professional, repeatable skill.
BTCUSD SHORT ON 4HAter swapping the previous inverted hammer high and forming again a inverted hammer with marubozu candle use strategy (AFTER EFFECT)

Buy BTCUSD🧠 BTC/USDT 4H – Smart Money Perspective
Bitcoin has shown a sharp rejection from the recent demand zone around 122,300–122,500, forming a clean bullish displacement candle on the 4H timeframe.
Current price is retesting the fair value gap (FVG) and the previous structure block, hinting at a possible continuation move upward.
⸻
🔍 Market Structure
• Trend: Short-term bullish within a larger accumulation phase
• Structure: Higher low formed around 122,300
• Liquidity: Resting above 125,800 (previous swing high – potential liquidity grab target)
• Imbalance: Small FVG left unfilled between 123,000–123,400
⸻
💡 Trade Idea
• Entry: 122,950 – 123,000
• Stop Loss: Below 122,300 (structure invalidation)
• Target: 125,900+ (liquidity sweep zone)
• Risk–Reward: ≈ 1:4
⸻
⚙️ Confluence
• Bullish order block respected on 4H
• Strong rejection wick signaling demand
• Clear displacement + fair value gap alignment
• Volume confirmation increasing during bullish move
⸻
⚠️ Note
If BTC fails to hold above 122,300, the setup invalidates — next demand lies near 120,800–121,000.
Wait for confirmation candle closure above 123,500 for safer continuation plays.
⸻
Bias: Bullish (Short-term)
Timeframe: 4H
Strategy Used: SMC + FVG + Liquidity sweep

btc bullisness is still activei have mentioned 4hr demand in my previous ideas of btc long zone. but after noticing about how btc supply & demand is behaving i can tell you that now btc is only following 1 week or sometimes day demand and not respecting 4hr zones for the continous rally, off course it will show some movement from 4hr but the whole rally will keep continue its rally from 1 week TF. let the candle close above this red line and then take the entry from mentioned zone but before that keep calm and don't FOMO.

The Truth About Overnight Riches What Influencers Won’t Tell YouHello Traders!
You’ve seen it everywhere, screenshots of massive profits, luxury cars, and captions like “I made this in one trade.”
The illusion of overnight riches sells fast, but what you don’t see is the reality behind it.
Let’s uncover what most influencers never talk about, the truth behind quick money in trading.
1. The Reality Behind the Screenshot
That big profit post doesn’t show how many losses came before it.
Many traders show one winning trade out of dozens of failed ones.
You never see the emotional stress, sleepless nights, and blown accounts behind that single success.
2. Overnight Riches Come with Overnight Risk
The faster you try to make money, the faster you can lose it.
Trading with oversized lots or without stop losses may look exciting, until one bad move wipes you out.
Wealth that lasts is built on consistency, not chaos.
3. The Boring Stuff Makes You Rich
Proper risk management, discipline, and patience are not flashy, but they’re what actually make traders successful.
While others chase quick money, real traders master control over emotions and capital.
Slow growth feels boring, but it’s the only path that’s sustainable.
4. The Hidden Cost of “Fast” Success
Chasing overnight profits creates mental pressure and greed.
Even if you win once, you’ll keep gambling to repeat it, until luck runs out.
True freedom in trading comes when you stop forcing success and start following process
Rahul’s Tip:
Don’t compare your beginning to someone else’s highlight reel. The real traders you admire have spent years learning, failing, and improving before they started winning.
Conclusion:
The idea of overnight riches is a dream sold to those who don’t know better.
But once you understand trading is a skill, not a lottery, you’ll stop rushing and start growing steadily.
The best traders don’t chase money; they chase mastery, and money follows naturally.
If this post gave you clarity about the real journey of trading, like it, share your thoughts in comments, and follow for more honest trading insights!

BTC market snapshotBTC is confidently holding above 119K, aiming to continue its rise toward a new all-time high. The hourly timeframes are signaling a pause/pullback for the coming day. Globally, the picture strengthens the short signal.
I am bearish.

BTC/UsDT Short sideHere is a description of the downside scenario as depicted:
1. The Short Entry Point: The short trade is set up to begin at the approximate current price level, which is around $122,000 to $123,000. This suggests a trader is anticipating that the current strong bullish move has reached its peak and a reversal is imminent.
2. The Stop-Loss (Risk):
• The top boundary of the red box, which extends into the red area above the entry, represents the stop-loss level.
• This red area is relatively small compared to the profit target, suggesting a favorable Risk/Reward ratio.
• The stop-loss price appears to be around $126,864.5 (the highest point in the image is $126,864.5). If the price moves above this level, the trade would be closed for a manageable loss.
3. The Take-Profit (Reward/Target):
• The lower boundary of the red box, which extends significantly downwards, represents the take-profit or target area for the short trade.
• The profit target line appears to be around the $108,500 to $108,800 level, which is a key low from late September.
• This is where the trader would expect to close the trade for a profit if the anticipated downside move materializes.
4. The Context: The "downside chart" fundamentally represents a trade where the trader is betting on a significant price decline back toward the prior support levels after the large recent rally.
In summary, the downside chart (the red box) illustrates a hypothetical short position where a trader is risking a small amount of profit from the recent rally to potentially capture a much larger drop in price, targeting the strong support zone established just before the recent V-shaped recovery.
The term "downside chart" in this context refers to the short trade setup that has been drawn on the chart, which is visualized using the large red shaded box.
This setup represents a trader's prediction that the price of BTCUSDT will reverse and fall significantly from its current high.
Here is the breakdown of the downside trade setup:
• Entry Point (Current Price): The trade is initiated for a short position (selling) near the current market price, which is around $122,379.1. This is the belief that the recent powerful rally is exhausted and a reversal is starting.
• Stop-Loss (Risk): The area above the entry point, colored in the brighter red on the chart, represents the Stop-Loss level.
• The stop-loss price appears to be around $126,864.5 (the high shown in the top right).
• This is the level where the trade would be automatically closed to limit the loss if the price continues to rise against the short position.
• Take-Profit (Reward/Target): The large green shaded area below the entry represents the Take-Profit or profit target for the short trade.
• The target price is set significantly lower, near the prior support/lows from late September, likely around the $108,500 to $108,800 range.
• This is where the trader expects to close the short position to realize a profit.
• Risk/Reward Ratio (R:R): By comparing the distance from the entry to the stop-loss (the risk, in red) versus the distance from the entry to the take-profit (the reward, in green), the trade demonstrates a favorable Risk/Reward ratio. The reward (green box) is visually much larger than the risk (top red portion), suggesting the trader is attempting to risk a small amount to potentially gain a large profit.
In summary, the downside chart is the visual representation of a bearish trading strategy, expecting a move down from over $122k to the support area near $108k.

All The Target DoneHere's a breakdown of what the chart shows and why "target done" is applicable:
• The Movement: The chart displays a significant V-shaped recovery and surge starting around September 27th or 28th and continuing up to the current date (October 4th).
• The Target Area: The large green shaded box highlights the upward trajectory and covers the area where the price has been moving. The upper limit of this green box and the price levels around the $122,000 to $123,000 mark appear to be the region of the achieved target.
• Current Price Action: The current price is displayed as $122,506.9, which is at the upper end of the recent upward movement and well into the highlighted green zone.
• Inferred Trading Context: In a trading context, it suggests that a long (buy) position was likely entered near the bottom of the V-shape, perhaps around the $110,000 to $112,000 area, with a profit target set near the current price level. Since the price has reached or exceeded that upper range, the objective has been met, hence "target done."
In short, the chart clearly illustrates a successful, powerful move to the upside, indicating that the profit goal (target) for that particular trade setup has been achieved (done).

Unlocking India’s Derivative Power1. Introduction: The Rise of Derivatives in India
Derivatives have existed in some form for centuries, initially in agriculture and commodities, enabling farmers and merchants to hedge price risk. In India, derivatives gained prominence after the economic liberalization in the 1990s. The National Stock Exchange (NSE) launched equity derivatives in 2000, followed by commodity derivatives on the Multi Commodity Exchange (MCX) and the National Commodity & Derivatives Exchange (NCDEX).
The core appeal of derivatives lies in risk management. Investors and institutions can hedge against price volatility, speculate for gains, or arbitrage price inefficiencies across markets. India’s derivatives market, although smaller than developed economies, has shown exponential growth, both in volume and diversity.
2. Understanding Derivatives: Types and Functions
Derivatives in India primarily fall into four categories:
2.1 Futures Contracts
Futures are standardized agreements to buy or sell an underlying asset at a predetermined price on a specific future date. They exist across equity, index, commodity, currency, and interest rate segments. Futures are widely used for hedging and speculative purposes. For example, a farmer can hedge against falling crop prices using commodity futures.
2.2 Options Contracts
Options give the buyer the right, but not the obligation, to buy (call option) or sell (put option) an asset at a specified price before or on the expiration date. Options are highly versatile for hedging, income generation, and portfolio protection. In India, options trading is active in equities, indices, currencies, and commodities.
2.3 Currency Derivatives
Currency derivatives help manage foreign exchange risk. With globalization and rising trade, Indian businesses increasingly rely on currency futures and options to hedge against volatility in USD/INR, EUR/INR, and other currency pairs.
2.4 Interest Rate Derivatives
Interest rate derivatives, including forwards, swaps, and futures, are used by banks, corporates, and investors to manage interest rate exposure. They have become crucial with rising corporate borrowing and government debt issuance.
3. The Current Landscape of India’s Derivative Markets
India’s derivative markets have evolved significantly, both in depth and sophistication.
3.1 Equity Derivatives
Equity derivatives, including stock and index futures and options, dominate India’s derivative ecosystem. NSE’s Nifty 50 futures and options are among the most traded globally. Retail participation has increased, driven by online platforms, algorithmic trading, and financial literacy.
3.2 Commodity Derivatives
MCX and NCDEX facilitate trading in gold, silver, crude oil, agricultural commodities, and base metals. Commodity derivatives allow businesses and investors to manage price risk efficiently while attracting speculative interest that enhances liquidity.
3.3 Currency and Forex Derivatives
With India’s integration into the global economy, currency derivatives have become indispensable. Corporates hedging imports and exports, banks managing reserves, and traders speculating on exchange rates collectively make this segment robust.
3.4 Institutional Participation
Foreign institutional investors (FIIs), mutual funds, insurance companies, and banks actively participate in India’s derivative markets. Their involvement improves liquidity, market efficiency, and price discovery.
4. Regulatory Framework: Building Confidence
A strong regulatory framework underpins India’s derivative markets. Key authorities include:
Securities and Exchange Board of India (SEBI): Regulates equity and currency derivatives to ensure investor protection, transparency, and risk mitigation.
Forward Markets Commission (FMC): Historically regulated commodity derivatives, now merged with SEBI for unified oversight.
Reserve Bank of India (RBI): Regulates currency derivatives and interest rate products.
SEBI has implemented measures such as position limits, margin requirements, and reporting obligations to curb systemic risk and promote market integrity. Such frameworks instill confidence among investors and institutions.
5. Unlocking Derivative Power: Strategies and Opportunities
To fully unlock the power of derivatives in India, market participants need to embrace innovation, strategic usage, and risk awareness.
5.1 Hedging and Risk Management
Derivatives allow businesses, investors, and traders to hedge against market volatility. For example:
A corporates hedging foreign currency exposure.
Farmers locking in commodity prices.
Investors protecting equity portfolios through index options.
Hedging creates stability in returns, making businesses and markets more resilient.
5.2 Speculation for Returns
Speculators provide liquidity and contribute to efficient price discovery. Traders using futures, options, and spreads can generate profits based on market expectations. While speculation involves risk, disciplined strategies can significantly enhance wealth.
5.3 Arbitrage Opportunities
Derivatives provide avenues for arbitrage—exploiting price differences across markets or between underlying assets and derivatives. For example, mispricing between Nifty spot and futures creates riskless profit opportunities. Efficient arbitrage strengthens market integrity and narrows spreads.
5.4 Portfolio Diversification
Derivatives facilitate exposure to diverse asset classes without directly holding them. Investors can gain exposure to commodities, currencies, and indices efficiently, enhancing portfolio diversification and risk-adjusted returns.
5.5 Leveraging Technology
Algorithmic trading, AI-driven analytics, and data modeling enhance derivative trading efficiency. Institutional and retail investors can use sophisticated models to optimize hedging, detect opportunities, and manage risks in real-time.
6. Challenges in India’s Derivative Market
While potential is vast, India’s derivative ecosystem faces several challenges:
6.1 Low Awareness and Education
Despite growth, a large segment of retail investors lacks knowledge about derivative usage and risk management. This gap often leads to misuse and losses.
6.2 Market Volatility
Derivatives amplify market volatility. Without proper risk management, leveraged positions can lead to systemic shocks or investor losses.
6.3 Regulatory Complexity
Compliance with SEBI, RBI, and tax regulations can be cumbersome. Frequent changes require active adaptation, which can be challenging for smaller participants.
6.4 Limited Access in Certain Segments
Currency, interest rate, and commodity derivatives remain underutilized by retail investors and SMEs due to lack of exposure, awareness, and platform accessibility.
7. Unlocking Derivative Power for SMEs and Retail Investors
Small and medium enterprises (SMEs) and retail investors form a large portion of India’s economy. Leveraging derivatives can empower them:
SMEs: Can hedge raw material costs, forex exposure, and interest rate risks, ensuring stable cash flows.
Retail Investors: Can use options for risk management, generate additional income via covered calls, or hedge equity portfolios.
Education programs, simplified platforms, and advisory services can accelerate adoption.
8. Technological Innovations Driving Growth
India’s derivative markets are increasingly powered by technology:
Algorithmic Trading: Automated strategies enhance efficiency, speed, and accuracy.
AI & Data Analytics: Predictive models improve risk assessment and market forecasts.
Blockchain & Smart Contracts: Can enhance transparency, settlement efficiency, and reduce counterparty risk in derivative contracts.
9. Global Comparison and India’s Potential
Compared to developed markets like the US, derivatives penetration in India remains lower. For example:
Equity derivatives turnover in India is high, but options and exotic instruments are less prevalent.
Commodity derivatives offer tremendous growth potential, especially in agri-commodities where hedging is limited.
Unlocking India’s derivative power can align the country with global financial practices, attract foreign investment, and enhance market sophistication.
10. Risk Management and Responsible Trading
While derivatives offer leverage and profit potential, they carry inherent risks:
Leverage Risk: Small price movements can lead to large gains or losses.
Liquidity Risk: Some contracts may lack adequate liquidity, leading to slippage.
Counterparty Risk: Though exchanges mitigate this via clearinghouses, OTC contracts carry higher risk.
Systemic Risk: Excessive speculative positions can destabilize markets.
Prudent risk management strategies, margin discipline, diversification, and regulatory compliance are essential to sustainably unlock derivative power.
Conclusion: A New Era of Financial Empowerment
India’s derivative market represents a formidable yet underutilized resource. By combining technology, education, regulatory oversight, and strategic usage, India can unlock the true power of derivatives. Properly harnessed, derivatives will not only stabilize risks and enhance returns but also position India as a global financial hub with sophisticated market infrastructure.
For investors, traders, and businesses alike, understanding and using derivatives responsibly is key to unlocking wealth, managing risk, and driving long-term economic growth. India stands at the threshold of a financial revolution, where derivatives can transform market efficiency, liquidity, and resilience—ushering in a new era of economic empowerment.

btc bullish Zone in 4hrthis zone is crucial and if it hold above this zone then new higher high is about to made

[SeoVereign] BITCOIN BEARISH Outlook – October, 03 2025The core basis for presenting a bearish perspective in this idea consists of two main points.
First, within the Double Zigzag pattern, each zigzag forms a 1:1 length ratio.
WAVE.Y1=WAVE.Z1
For easier identification, I have illustrated this section in the chart below.
The second is ZIF.
ZIF (Zone of Interpretive Freedom) is a concept I devised myself, and it refers to the price range between the 1.0 ratio and the 1.414 ratio when Fibonacci retracement is drawn.
This range serves as a critical zone for determining the validity of the idea, and as long as the range is not breached, the strategy is considered to remain valid. Also, the closing basis of ZIF is the daily candle’s closing price.
Simply moving outside of ZIF does not immediately invalidate the perspective.
Although the high of September 18 has been broken upward as of the current point in time, I regard this upward breakout as a false breakout (whipsaw).
The reason is that leading altcoins are moving sideways, failing to follow Bitcoin’s movement, and are showing declining momentum.
Accordingly, the average target price is set around 112.970 USDT.
Additional briefings will be continuously updated to this idea as the chart develops.

[SeoVereign] BITCOIN BEARISH Outlook – September 30, 2025Hello everyone,
Today, as of September 30, I would like to share my perspective on a Bitcoin short position. Once again, I am leaning toward the possibility of a decline, and the basis for this view consists of two main points.
First, from the perspective of Elliott Wave Theory, the ongoing 5th wave shows a 0.786 length ratio relative to the 1st wave. Traditionally, the 5th wave often has a specific proportional relationship with the 1st or 3rd wave, with the most ideal ratios being known as 0.618, 1.0, or 1.618. However, in actual markets, more unconventional ratios frequently appear, and one of these is precisely the 0.786 ratio structure of the 5th wave. While this ratio is not the textbook standard, it reflects market participants’ psychology and is repeatedly observed, which makes it a sufficiently valid analytical basis. In particular, at the current stage, the strength of the 5th wave’s advance is gradually weakening, and the typical characteristics of the end of a wave, such as the fading of buying momentum, are also being observed.
Second, a 1.13 ALT BAT pattern, one of the harmonic patterns, has formed. While the standard BAT pattern is based on the 0.886 level, the modified ALT BAT pattern sets the 1.13 point as the critical turning area, forming a Potential Reversal Zone (PRZ). In the current chart, a price reversal is indeed observed at the 1.13 point, which can be regarded as a strong signal where pattern theory and real market movement align. This situation is not a mere coincidence but indicates that selling pressure has intensified in an area where supply zones and psychological resistance are concentrated.
Based on these two factors, I set the average target for this decline around 111,633. Of course, since the market is fluid, I will continue to verify the validity of this idea as the chart develops and update it as necessary.
Thank you for reading.

BTC Long Setup – Black Line Reclaim & Demand Zone BounceBTC reached the green demand zone after the decline from 116,700.
Price stabilized near the black trend line (~112,000) – key bullish reclaim trigger.
Trade Details (Educational)
Entry (Long): Near black trend line (~112,000) after confirmation of demand.
Stop Loss: Below green demand zone (~111,100).
Targets: Recovery toward 113,900 → 114,300 supply zone.
Takeaways
1️⃣ Clear reclaim or confirmation needed before switching bias.
2️⃣ Combining major demand zone with trend line reclaim can signal a high-probability long setup.
3️⃣ Structure-based reversals possible even after a downtrend.
⚠️ Educational content only – not financial advice.

[SeoVereign] BITCOIN BEARISH Outlook – September 30, 2025Today, as of September 30, I am writing to share my bearish perspective on Bitcoin with a short position.
In this idea as well, I am leaning toward a decline. There are two main reasons for this.
First, the 1.13 ALT BAT pattern. This harmonic pattern has already been confirmed, but since the detailed Fibonacci ranges do not fully match, we cannot rule out the possibility of one more upward wave. Therefore, I am first entering a short position with only a small portion, and then plan to flexibly increase the position depending on the price action. In other words, if the decline unfolds immediately, my analysis will be accurate; on the other hand, I also judge that there is a sufficient possibility of one more short-term wave forming before a reversal to the downside.
Second, the downward breakout of the trendline. Rather than analyzing the harmonic pattern independently, I prefer to combine it with trendline analysis. This is due to the flexible nature of harmonic theory, and through trendlines I can measure both the reference points for position sizing and the strength of momentum.
For these reasons, I entered the first short position, with an average target price set at 110,500 USDT.
Recently, not only the stock market but also the cryptocurrency market as a whole has been in poor condition. I hope that those who are experiencing losses will soon encounter better conditions, and I also hope that sharing my perspective can provide even a small help.
I will continue to update my ideas in line with the chart developments and transparently share my thoughts.
Thank you for reading.

Bitcoin (BTCUSDT) – Bearish Setup Under ResistanceAfter the recent breakdown from 116,700 levels, BTC has been forming lower highs and consolidating in a range. The recovery towards 113,900 – 114,300 acted as a supply zone, leading to fresh selling pressure.
Currently, BTC is facing resistance near 111,100–112,000, marked in red on the chart. Price action shows repeated rejection and inability to sustain above this zone. The structure is developing into a descending channel (blue projection), indicating continued bearish momentum.
Trade Idea:
As long as BTC remains below 111,200, sellers are in control.
Expected price movement: gradual decline following the descending channel.
Short-term support is at 109,000 – 108,200.
Major downside target: 106,800.
Plan:
Entry Zone (Short): 110,800 – 111,200
Stop Loss: Above 112,100
Targets: 109,000 → 108,200 → 106,800
The bias remains bearish unless BTC reclaims 112,000+ with strong volume.

Part 7 Trading Master Class1. Option Pricing Models
One of the most complex yet fascinating aspects of option trading is how option premiums are determined. Unlike stocks, whose value is based on company fundamentals, or commodities, whose prices are driven by supply-demand, an option’s price depends on several variables.
The two key components of an option’s price are:
Intrinsic Value (real economic worth if exercised today).
Time Value (the added premium based on time left and expected volatility).
Factors Affecting Option Prices
Underlying Price: The closer the stock/index moves in favor of the option, the higher the premium.
Strike Price: Options closer to current market price (ATM) carry more time value.
Time to Expiry: Longer-dated options are more expensive since they allow more time for the move to happen.
Volatility: Higher volatility means higher premiums, as chances of significant movement increase.
Interest Rates & Dividends: These play smaller roles but matter for advanced valuation.
Option Pricing Models
The most famous is the Black-Scholes Model (BSM), developed in 1973, which provides a theoretical value of options using inputs like underlying price, strike, time, interest rate, and volatility. While not perfect, it revolutionized modern finance.
Another important concept is the Greeks—risk measures that tell traders how sensitive option prices are to different factors:
Delta: Measures how much the option price changes with a ₹1 change in the underlying.
Gamma: Measures the rate of change of Delta, indicating risk of large moves.
Theta: Time decay, showing how much premium erodes daily as expiry nears.
Vega: Sensitivity to volatility changes.
Rho: Impact of interest rate changes.
Professional traders use these Greeks to balance portfolios and create hedged positions. For example, a trader selling options must watch Theta (benefits from time decay) but also Vega (losses if volatility spikes).
In short, option pricing is a multi-dimensional game, not just about guessing direction. Understanding these models helps traders evaluate whether an option is overpriced or underpriced, and to design strategies accordingly.
2. Strategies for Beginners
New traders often get attracted to cheap OTM options for quick profits, but this approach usually leads to consistent losses due to time decay. Beginners are better off starting with simple, defined-risk strategies.
Basic Option Strategies:
Covered Call: Holding a stock and selling a call option on it. Generates steady income while holding the stock. Ideal for investors.
Protective Put: Buying a put option while holding a stock. Works like insurance against price falls.
Bull Call Spread: Buying one call and selling another at a higher strike. Limits both profit and loss but reduces cost.
Bear Put Spread: Buying a put and selling a lower strike put. A safer way to bet on downside.
Long Straddle: Buying both a call and put at the same strike. Profits from big moves in either direction.
Long Strangle: Similar to straddle but using different strikes (cheaper).
For beginners, spreads are particularly useful because they balance risk and reward, and also reduce the impact of time decay. For example, instead of just buying a call, a bull call spread ensures you don’t lose the entire premium if the move is slower than expected.
The goal for a beginner is not to chase high returns immediately, but to learn how different market factors impact option prices. Small, risk-controlled strategies give that experience without blowing up accounts.
3. Advanced Strategies & Hedging
Once traders understand basics, they can move on to multi-leg strategies that cater to more complex views on volatility and market direction.
Popular Advanced Strategies
Iron Condor: Combining bull put spread and bear call spread. Profits when market stays within a range. Excellent for low-volatility conditions.
Butterfly Spread: Using three strikes (buy 1, sell 2, buy 1). Profits when the market closes near the middle strike.
Calendar Spread: Selling near-term option and buying long-term option at same strike. Benefits from time decay differences.
Ratio Spreads: Selling more options than you buy, often to take advantage of skewed volatility.
Straddles and Strangles (Short): Selling both call and put to profit from low volatility, though risky without hedges.
Hedging with Options
Institutions and even individual investors use options as risk management tools. For instance, a fund manager holding ₹100 crore worth of stocks can buy index puts to protect against market crashes. Similarly, exporters use currency options to hedge against forex fluctuations.
Advanced option trading is less about speculation and more about risk-neutral positioning—making money regardless of direction, as long as volatility and timing behave as expected. This is where understanding Greeks and volatility becomes critical.
4. Risks in Option Trading
Options provide opportunities, but they are not risk-free. In fact, most beginners lose money because they underestimate risks.
Key Risks Include:
Leverage Risk: Options allow big exposure with small capital, but this magnifies losses if the view is wrong.
Time Decay (Theta): Options lose value daily. Even if you’re directionally correct, being late can mean losses.
Volatility Risk (Vega): Sudden spikes/drops in volatility can make or break option trades.
Liquidity Risk: Illiquid options have wide bid-ask spreads, making it hard to enter or exit efficiently.
Unlimited Loss for Sellers: Option writers can lose unlimited amounts, especially in naked positions.
Overtrading: The fast-moving nature of weekly options tempts traders to overtrade, often leading to poor discipline.
Professional traders always assess risk-reward ratios before taking trades. They know that preserving capital is more important than chasing quick profits. Beginners must internalize this lesson early to survive long-term.
