On the Fear of FailureContemporary man suffers from a malaise that he often fails to express in words, stemming from the barrage of stimuli that overwhelm him daily and, in particular, from the crisis of traditional values that once provided clarity about the meaning of his existence.
This malaise is often fear, a preservation instinct whose evolutionary function is to prepare us for potential threats or to regulate behaviours that could harm the community, the cornerstone of our survival as a species.
Fear accompanies us at every moment: fear of failure, of disappointing our loved ones, of losing status, or even fear of fear itself.
In the world of investments, the inherent risk of facing uncertainty and the slim chances of success amplify the emotional burden of every decision. Thus, fear, originally protective, can become a paralysing or self-destructive force.
Manifestations of Fear in Investors
In the wild ecosystem of investments, fear can be classified into three main manifestations. The first is the fear that an idea or method will fail, leading investors to cling to flawed systems for too long or to delay the necessary testing before executing them. By nature, we avoid discomfort, and after investing time and energy in a project, facing a dead end feels profoundly unsettling.
The second is the fear of missing out on “the big opportunity,” particularly common among novice investors exposed to communities that showcase extraordinary results, often exaggerated or fabricated. This fear drives them to act recklessly, increasing the likelihood of costly mistakes.
The third, and most devastating, is the fear of being a failure, a malaise that can lead to anxiety, depression, and social isolation, while severely undermining performance.
A Way of Understanding is a Way of Feeling
The challenge in confronting paralysing impulses like fear lies in the fact that many proposed solutions, such as motivational speeches or rationalist approaches, end up reinforcing the same belief system that generates the discomfort. For instance, a motivational speech often has a fleeting effect, focusing on achieving success and developing positive ideas rather than embracing mistakes as a fundamental part of growth.
Paralysing fear can even limit the ability to assimilate constructive ideas or take positive actions. It is our belief system, the way we interpret reality, that either liberates or enslaves us and defines our capacity to succeed in any endeavour.
Most people today hold a flawed belief system, obsessed with outcomes and external validation, which makes them vulnerable to discomfort and distances them from authentic progress.
Conquest Through Failure
Just as a muscle strengthens by tearing its fibres to the point of exhaustion, love blossoms from sacrifice, and a skill is forged through time and dedication, both investments and life itself thrive on our exposure to mistakes for growth.
In trading, every loss or failed strategy is an opportunity to learn, adjust, and move forward, provided we transform our beliefs to see failure as the engine of progress and obstacles as stepping stones to virtue. Once we embrace this truth as the essence of our reality, we accept that disappointing others, being vulnerable to criticism, or being misunderstood is the inevitable price of growth—not only in investments but in every facet of our existence.
Every great discovery or talent has emerged from the struggle against failure, often confronting barriers imposed by institutions, social norms, or internal fears. Limitations such as age, lack of formal education, or excuses to justify failure often chain the common man to inaction.
Yet history shows us how Charles Darwin, Gregor Mendel, Michael Faraday, or Abraham Lincoln, without formal academic training, transformed the course of science, politics, and humanity. Others, like Charles Bukowski, Peter Mark Roget, or Maria Sibylla Merian, achieved their dreams at an advanced age, proving that time is not a barrier to reaching fulfilment.
The reality is that anyone, by overcoming obstacles in any field, can achieve excellence in a few years if they free themselves from limiting emotions and beliefs. Existence itself, whether by divine design or the vastness of the universe, endows us with opportunities: in one year, someone can overcome an addiction; in just two years, someone can maximise their physical potential; in less than five years, with effort and without fear of mistakes, almost any skill can be mastered. As long as we breathe, we hold in our hands the ability to positively transform our reality.
Conclusions
Although my usual focus is on the technical aspects of markets, on this occasion, I have sought to connect with the human side of the investors who read me, as I wish for them to understand that failing means fearing and retreating in the face of setbacks, while succeeding is failing fearlessly for a prolonged period until achieving virtue.
I am convinced that understanding mistakes and failure as inevitable and necessary parts of growth will not only strengthen their finances in the future but also make them freer and more confident individuals in all aspects of their lives.
Face every loss with gratitude, transforming mistakes into learning, and act with prudence and determination.
Trade ideas

Part 2 Trading Master Class With ExpertsHow Option Trading Works
Let’s walk through a simple example.
Suppose NIFTY is trading at 20,000. You expect it to rise.
You buy a NIFTY 20,100 Call Option by paying a premium of ₹100.
If NIFTY goes up to 20,500, your call is worth 400 (20,500 – 20,100). Profit = 400 – 100 = 300 points.
If NIFTY stays below 20,100, your option expires worthless. Loss = Premium (₹100).
Here’s the beauty: as a buyer, your loss is limited to the premium paid, but profit potential is theoretically unlimited. For sellers (writers), it’s the reverse—limited profit (premium received) but unlimited risk.
Why People Trade Options
Options are not just for speculation. They serve multiple purposes:
Hedging: Investors use options to protect their portfolio against losses. For example, buying puts on NIFTY acts as insurance during market crashes.
Speculation: Traders take directional bets on stocks or indices with limited capital.
Income Generation: Sellers of options earn premium income regularly.
Arbitrage: Exploiting price differences in related instruments.
This versatility is what makes options attractive to both professionals and retail traders.
Risks in Option Trading
While options are powerful, they are also risky:
Time Decay (Theta): Options lose value as expiry approaches, especially if they are OTM.
Leverage Risk: Small market moves can lead to large percentage losses.
Complexity: Beginners may struggle with pricing models, strategies, and margin requirements.
Unlimited Loss for Sellers: Writing naked options can lead to huge losses if the market moves strongly against the position.
Thus, understanding risk management is critical before trading options seriously.
Option Pricing & The Greeks
Option prices are influenced by several factors. To understand them, traders use Option Greeks:
Delta: Measures how much the option price moves with a ₹1 move in the underlying asset.
Gamma: Measures how Delta changes with the underlying’s price.
Theta: Measures time decay. Shows how much value an option loses daily as expiry nears.
Vega: Measures sensitivity of option price to volatility changes.
Rho: Measures sensitivity to interest rate changes (less important in short-term trading).
The Greeks help traders design strategies, manage risks, and predict option price movements.

BTCUSDT Buy SetupPrice is currently consolidating above key support near 117,097 – 117,235. As long as this zone holds, I expect bullish continuation toward the next resistance levels.
📈 Entry: Current market price (CMP)
🎯 Target: 118,865 – 119,083
🛑 Stop Loss: 116,658 (below key support zone)

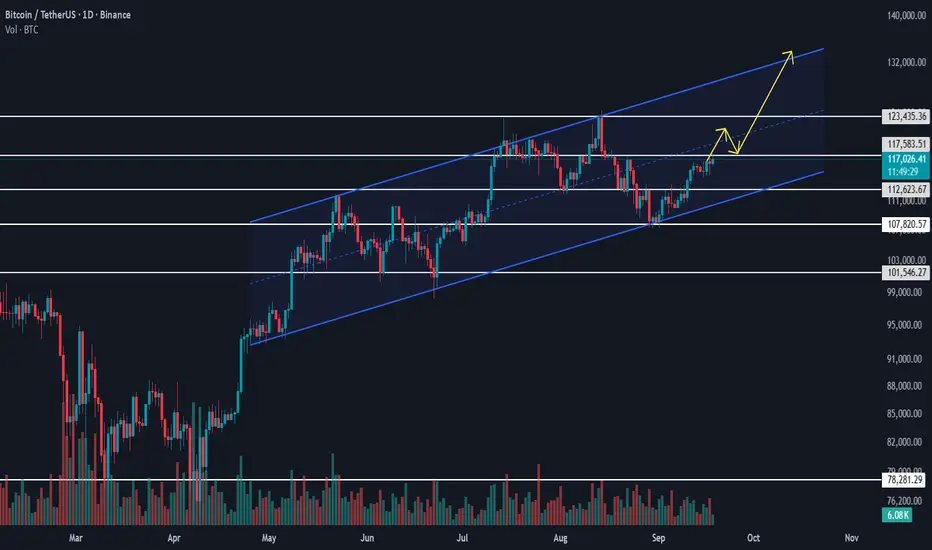
BTCUSDT Analysis – Channel Breakout in FocusBitcoin is currently moving inside an upward channel, where the $107,820.57 level acted as strong support. This level also aligned with the lower trendline of the channel, and price reacted well to it, triggering the latest bullish move.
At present, BTC is facing a critical resistance at $117,583.51, which serves as a potential long trigger. A breakout above this level could accelerate the upside momentum.
Given the expectation of a potential interest rate cut by the Federal Reserve, the crypto market could gain further bullish momentum.
Our main bullish confirmation remains a breakout of $123,435.36, which would validate the continuation of the macro bullish wave count. However, it is preferable to secure entry before price reaches that level in order to optimize risk-to-reward.
📌 Trading Plan: Watch $117,583.51 for a breakout entry. Manage risk properly as volatility is expected to rise with macroeconomic events
#Bitcoin #BTC #BTCUSDT #Crypto #CryptoTrading #TechnicalAnalysis #CryptoMarket #TradingView #Altcoins
Part 4 Institutional Trading Key Terms in Options Trading
Understanding options requires familiarity with several technical terms:
Strike Price: The predetermined price at which the underlying asset can be bought (call) or sold (put).
Expiration Date: The last date on which the option can be exercised. Options lose value after this date.
Premium: The price paid to purchase the option, influenced by intrinsic value and time value.
Intrinsic Value: The difference between the underlying asset’s price and the strike price if favorable to the option holder.
Time Value: The portion of the premium reflecting the probability of the option becoming profitable before expiration.
In-the-Money (ITM): A call is ITM if the underlying price > strike price; a put is ITM if the underlying price < strike price.
Out-of-the-Money (OTM): A call is OTM if the underlying price < strike price; a put is OTM if the underlying price > strike price.
At-the-Money (ATM): When the underlying price ≈ strike price.
How Options Trading Works
Options trading involves buying and selling contracts on exchanges like the National Stock Exchange (NSE) in India, or over-the-counter (OTC) markets globally. Each contract represents a fixed quantity of the underlying asset (e.g., 100 shares per contract in equity options).
The price of an option, called the option premium, is determined by multiple factors:
Underlying Price: Directly impacts call and put options differently. Calls gain value as the underlying price rises; puts gain as it falls.
Strike Price: The relationship of the strike to the current asset price defines intrinsic value.
Time to Expiration: More time increases the option’s potential to become profitable, adding to the premium.
Volatility: Higher expected price fluctuations increase the chance of profit, making options more expensive.
Interest Rates and Dividends: Slightly affect option pricing, especially for longer-term contracts.
Options traders use strategies to profit in various market conditions. They can combine calls and puts to create complex structures like spreads, straddles, strangles, and iron condors.
Popular Options Trading Strategies
Covered Call: Holding the underlying asset and selling a call option to earn premium. It generates income but limits upside potential.
Protective Put: Buying a put on a held asset to limit losses during downturns. Essentially an insurance policy.
Straddle: Buying a call and a put at the same strike price and expiry, betting on high volatility regardless of direction.
Strangle: Similar to a straddle but with different strike prices, cheaper but requires larger movements to profit.
Spreads: Simultaneously buying and selling options of the same type with different strikes or expiries to reduce risk or capitalize on specific movements. Examples include bull call spreads and bear put spreads.
These strategies allow traders to tailor risk/reward profiles, hedge portfolios, or speculate with leverage.

US Fed Policies & Indian Markets1. Introduction to U.S. Federal Reserve Policies
The U.S. Federal Reserve, as the central bank of the United States, plays a pivotal role in shaping global economic conditions through its monetary policy decisions. The primary tools at its disposal include:
Interest Rate Adjustments: Modifying the federal funds rate to influence borrowing costs.
Open Market Operations: Buying or selling government securities to regulate money supply.
Quantitative Easing: Purchasing longer-term securities to inject liquidity into the economy.
These policies aim to achieve the Fed's dual mandate: maximum employment and stable prices. However, their repercussions extend beyond U.S. borders, impacting emerging markets like India.
2. Transmission Mechanisms to Indian Markets
2.1 Foreign Capital Flows
The differential between U.S. and Indian interest rates significantly influences foreign institutional investments (FIIs) in India. When the Fed raises interest rates, U.S. assets become more attractive due to higher returns, leading to capital outflows from emerging markets, including India. Conversely, a rate cut by the Fed can make U.S. assets less appealing, prompting FIIs to seek higher returns in Indian equities and debt markets.
For instance, after the Fed's recent 25 basis point rate cut, Indian stock markets experienced a positive response, with indices like the BSE Sensex and Nifty 50 showing gains, driven by increased foreign investor interest
Reuters
.
2.2 Currency Exchange Rates
The U.S. dollar's strength is inversely related to the attractiveness of emerging market currencies. A rate hike by the Fed typically strengthens the dollar, leading to depreciation of the Indian rupee. This depreciation can increase the cost of imports and contribute to inflationary pressures within India. On the other hand, a rate cut can weaken the dollar, potentially leading to a stronger rupee and easing import costs
Reuters
.
2.3 Inflationary Pressures
U.S. monetary policy indirectly affects global commodity prices. A stronger dollar, resulting from Fed rate hikes, can lead to higher prices for commodities priced in dollars, such as oil. Since India is a major importer of oil, increased global oil prices can lead to higher domestic inflation, impacting the cost of living and economic stability.
3. Sectoral Impacts in India
3.1 Information Technology (IT) Sector
The Indian IT sector is significantly influenced by U.S. demand, as a substantial portion of its revenue is derived from American clients. A rate cut by the Fed can stimulate the U.S. economy, leading to increased IT spending and benefiting Indian IT companies. For example, after the recent Fed rate cut, Indian IT stocks experienced a surge, reflecting investor optimism
Reuters
.
3.2 Banking and Financial Services
Indian banks with substantial foreign borrowings are directly affected by changes in U.S. interest rates. A rate cut can reduce their borrowing costs, improving profitability. Additionally, lower U.S. yields can make Indian debt instruments more attractive to global investors, potentially leading to capital inflows and strengthening the banking sector.
3.3 Export-Oriented Industries
A stronger rupee, resulting from a weaker dollar due to Fed rate cuts, can make Indian exports more expensive and less competitive in the global market. This can adversely affect industries such as textiles, pharmaceuticals, and engineering goods.
4. Macroeconomic Implications
4.1 Economic Growth
The Fed's policies can influence global economic growth trajectories. A rate cut can stimulate global demand, benefiting Indian exports and economic growth. However, if the rate cut is perceived as a response to economic weakness, it may signal global economic challenges, potentially dampening investor sentiment in India.
4.2 Monetary Policy Coordination
The Reserve Bank of India (RBI) monitors U.S. monetary policy closely, as it may need to adjust its own policies in response. For example, if the Fed's rate cut leads to significant capital inflows into India, the RBI may intervene to prevent excessive appreciation of the rupee, which could harm export competitiveness.
5. Case Studies
5.1 2013 Taper Tantrum
In 2013, when the Fed signaled the reduction of its bond-buying program, global markets experienced turmoil. India was among the countries most affected, with the rupee depreciating sharply and foreign capital outflows escalating. This episode underscored the vulnerability of emerging markets to U.S. monetary policy shifts.
5.2 Post-2020 Pandemic Response
In response to the COVID-19 pandemic, the Fed implemented aggressive monetary easing, including rate cuts and quantitative easing. These measures led to a global liquidity surge, benefiting Indian markets through increased foreign investments and a stable currency environment.
6. Conclusion
The U.S. Federal Reserve's monetary policy decisions are instrumental in shaping global financial landscapes. For emerging markets like India, these decisions influence capital flows, currency stability, inflation, and sectoral performance. Understanding the transmission mechanisms of U.S. monetary policy is crucial for policymakers, investors, and businesses in India to navigate the complexities of the global economic environment.

Geopolitics & Energy TradingIntroduction
Energy is the lifeblood of modern economies. The global energy market encompasses oil, natural gas, coal, nuclear, and increasingly, renewable energy sources. Trading in these commodities is not just a commercial activity; it is deeply intertwined with international politics, national security, and global diplomacy. Geopolitical events—ranging from wars, sanctions, and territorial disputes to alliances, trade agreements, and regulatory changes—have the power to cause sharp fluctuations in energy prices and disrupt supply chains worldwide.
Understanding the connection between geopolitics and energy trading is crucial for policymakers, investors, and businesses. Energy trading markets are not purely governed by supply-demand fundamentals; political decisions, international relations, and strategic considerations often shape market dynamics, creating both risks and opportunities for traders.
Historical Perspective
Historically, energy trading has been shaped by geopolitical considerations. The oil crises of the 1970s are classic examples: the 1973 Arab Oil Embargo and the 1979 Iranian Revolution caused severe disruptions in oil supplies, triggering global economic shocks. Prices quadrupled within months, highlighting the vulnerability of economies reliant on imported energy.
Similarly, the Gulf Wars of the 1990s and early 2000s demonstrated how military conflicts in key oil-producing regions directly impacted energy markets. Traders learned that political stability in regions like the Middle East, North Africa, and parts of Asia is as critical as technical supply-demand forecasts.
Geopolitics as a Driver of Energy Prices
Energy prices are highly sensitive to geopolitical developments. There are several mechanisms through which politics affects trading:
Supply Disruptions: Conflicts, civil wars, and sanctions can cut off production in major energy-producing countries. For example, sanctions against Iran and Russia restricted oil and gas exports, creating supply shortages that pushed prices higher.
Transport & Transit Risks: Many energy supplies depend on transit routes, pipelines, and chokepoints such as the Strait of Hormuz or the Suez Canal. Geopolitical tensions near these routes can increase shipping insurance costs, reduce flow, and spike energy prices.
Resource Nationalism: Governments may control energy resources to advance political agendas. Nationalization of oil fields or preferential export policies can reduce global supply and disrupt markets. Venezuela’s oil policies in the past decades exemplify this phenomenon.
Strategic Alliances & Trade Agreements: Energy-exporting nations often form alliances like OPEC (Organization of the Petroleum Exporting Countries) to coordinate output and stabilize prices. Political alignment among members can dictate production quotas, influencing global trading dynamics.
Regulatory & Policy Changes: Geopolitical considerations often influence domestic energy policies. For instance, the U.S. decision to reduce dependence on Middle Eastern oil by boosting shale production reshaped global oil trading patterns and affected OPEC strategies.
Regional Geopolitics & Energy Markets
Middle East
The Middle East remains central to global energy trading. Countries like Saudi Arabia, Iraq, Iran, and the UAE hold substantial reserves of crude oil and natural gas. Political instability in the region often triggers price volatility. For instance, the U.S.-Iran tensions have repeatedly caused spikes in Brent crude prices, even without an actual disruption in supply. Traders closely monitor developments in the region, including diplomatic negotiations, internal unrest, and proxy conflicts, as these can have immediate market implications.
Russia & Europe
Russia is a dominant player in global energy markets, especially natural gas and oil. European reliance on Russian gas has made the region vulnerable to geopolitical conflicts. The Russia-Ukraine war in 2022 caused unprecedented disruptions in European energy markets. Gas prices surged, alternative energy sourcing became urgent, and European nations accelerated energy diversification strategies. Energy traders had to account not only for price risks but also for policy-driven changes like sanctions and supply restrictions.
Asia-Pacific
Asia’s energy market is characterized by high demand growth, particularly in China and India. These nations rely heavily on imported oil and liquefied natural gas (LNG). Geopolitical tensions in the South China Sea or with energy suppliers such as the Middle East or Australia can influence trading patterns. Furthermore, regional energy diplomacy, including agreements between China, Russia, and Central Asian nations, has implications for LNG and crude oil flows.
Africa & Latin America
African and Latin American nations are increasingly significant in energy markets. Political instability, regulatory uncertainty, and infrastructure challenges in countries like Nigeria, Angola, and Venezuela often lead to supply disruptions. Traders must account for both the risks and the potential arbitrage opportunities created by these geopolitical factors.
Geopolitical Risks and Energy Trading Strategies
Energy trading is inherently risky due to geopolitical uncertainty. Traders and investors employ various strategies to manage this risk:
Hedging: Futures contracts, options, and swaps allow traders to lock in prices and reduce exposure to geopolitical volatility. For example, airlines often hedge fuel costs to protect against sudden price spikes due to Middle East tensions.
Diversification of Supply: Energy importers diversify their sources to reduce dependence on politically unstable regions. Japan and South Korea, for instance, import LNG from multiple countries to mitigate supply risks.
Speculation & Arbitrage: Geopolitical events create short-term volatility, which can be exploited by speculative traders. For instance, a news report about potential conflict in the Strait of Hormuz can trigger immediate buying or selling of oil futures.
Long-Term Contracts & Strategic Reserves: Countries and corporations often enter long-term supply contracts or maintain strategic reserves to mitigate supply risks associated with geopolitical uncertainties.
The Role of International Organizations
Global energy trading is influenced by international institutions that seek to balance political and economic interests:
OPEC and OPEC+ coordinate production policies among member nations, using geopolitical leverage to influence global prices. OPEC decisions are often influenced by the political interests of its members, blending market economics with diplomacy.
International Energy Agency (IEA) helps coordinate energy security policies among developed nations, ensuring preparedness against geopolitical shocks. For example, IEA member countries maintain strategic oil reserves to stabilize markets in case of sudden supply disruptions.
United Nations & WTO frameworks affect trade policies and sanctions. Trade restrictions or embargoes imposed for political reasons can dramatically affect energy flows, influencing trading strategies globally.
Emerging Trends
The intersection of geopolitics and energy trading is evolving due to technological and structural changes:
Transition to Renewable Energy: As nations diversify toward solar, wind, and hydrogen, the geopolitical influence of traditional fossil fuel exporters may decline. However, new geopolitical dependencies could emerge around critical minerals for renewable technologies.
Energy Storage & LNG Flexibility: Advances in storage technology and liquefied natural gas transport reduce vulnerability to short-term supply disruptions. This mitigates some geopolitical risk for traders but also introduces complex market dynamics.
Cybersecurity Threats: Energy infrastructure is increasingly digital, making it susceptible to cyber-attacks that have geopolitical implications. A hack on a pipeline or electricity grid can disrupt markets instantly, adding a new dimension to energy trading risk.
Geoeconomic Competition: Countries are increasingly using energy as a strategic tool, influencing markets through tariffs, subsidies, or state-backed investments in foreign energy infrastructure. China's Belt and Road Initiative, including energy projects, exemplifies this trend.
Case Studies
1. Russia-Ukraine Conflict (2022–Present)
The war demonstrated how energy markets respond to sudden geopolitical crises. European nations scrambled for alternative gas supplies as pipelines from Russia were restricted. Energy trading became highly volatile, with natural gas prices in Europe reaching record highs. Traders had to incorporate political risk assessments, sanctions updates, and alternative sourcing strategies into their decision-making process.
2. Iran Sanctions & Oil Markets
U.S. sanctions on Iran over its nuclear program restricted its oil exports, reducing global supply and increasing crude prices. The uncertainty surrounding sanctions enforcement created trading opportunities for speculative investors while increasing costs for import-dependent nations.
3. Gulf Tensions and Strait of Hormuz
The Strait of Hormuz, a vital chokepoint for global oil flows, has been a geopolitical flashpoint. Military incidents and political posturing in the Gulf region cause immediate spikes in oil futures prices, demonstrating the tight coupling between geopolitics and energy trading.
Conclusion
Geopolitics and energy trading are inextricably linked. The energy market is not only a reflection of supply and demand but also a mirror of global political tensions, alliances, and conflicts. Traders and policymakers must constantly monitor international developments, anticipate risks, and employ strategies to mitigate the effects of geopolitical uncertainty.
The future of energy trading will be shaped by the interplay between traditional fossil fuel geopolitics and emerging trends like renewable energy, energy storage, and cyber threats. While diversification, hedging, and strategic planning can reduce exposure, the market’s inherently political nature ensures that energy trading will remain a high-stakes arena where economics and geopolitics converge.
Understanding this nexus is essential for anyone involved in energy markets, from traders and investors to policymakers and energy companies. In a world where a single geopolitical event can ripple through global supply chains and markets, staying informed and agile is not just advantageous—it is imperative.

Btc 1H long ideaHere's a detailed description of the information presented:
• Financial Instrument: The chart is for Bitcoin (BTC) priced against USDT (Tether), a stablecoin. The "Perp Perpetual Mix Contract" suggests this is a futures or derivatives contract that doesn't expire.
• Timeframe: The chart is set to 1-hour (1H), meaning each candlestick represents one hour of price movement.
• Trading Position: A long position is currently open, indicated by the green and red boxes. A long position is a bet that the price will increase.
• Entry Point: The white horizontal line marks the entry price at 116,980.2.
• Take-Profit Target: The top of the green box, labeled "Target," is at 119,810.0. The potential profit for reaching this target is 3,517.2 USDT, which is a 3.02% gain.
• Stop-Loss: The bottom of the red box, labeled "Stop," is at 114,658.0. This is the price level where the trade will automatically close to limit losses. The potential loss is 1,646.4 USDT, or a 1.42% drop.
• Risk/Reward Ratio: The text "Risk/Reward Ratio: 2.14" indicates that the potential profit is 2.14 times greater than the potential loss. This is a key metric used by traders to evaluate if a trade is worth the risk.
• Price and Indicators:
• The current price is shown as 117,210.1.
• The chart includes various indicators and tools, such as moving averages (the blue and yellow lines moving with the price) and a volume histogram at the bottom (red and green bars).
• There are also horizontal white lines that likely represent significant support and resistance levels.
In summary, the image provides a clear visualization of a planned crypto trade, outlining the specific entry, stop-loss, and take-profit levels, as well as the associated risk/reward profile.

BTC Price Action: Bulls vs BearsBTC Price Action: Bulls vs Bears
Bitcoin has shown a gradual recovery after a prolonged corrective phase, with market structure leaning toward a constructive buildup. Fundamentally, sentiment is influenced by global macro conditions—investors are watching U.S. monetary policy signals, while stable demand from institutions and long-term holders continues to provide a supportive backdrop. On-chain activity remains steady, with balanced exchange inflows and outflows suggesting no extreme directional pressure in the near term.
From a technical perspective, the market has shifted momentum from bearish flows into a developing bullish sequence. The recent break of structure on the 4H timeframe highlights strengthening upside intent, though price is still moving within a broader accumulation phase. Current flows suggest the possibility of a short-term dip for liquidity before continuation to higher levels, aligning with the overall constructive weekly outlook.

Btc long setupEntry Zone
🔵 $114,800 – $115,500
Stop-Loss
🔴 $113,800
Targets
🎯 TP1: $117,700
🎯 TP2: $118,700 – $119,000
Confluence:
Liquidity sweep ✅
Demand OB ✅
Discount entry
Imbalance fill ✅
Setup is asymmetric: Risk ~1% for potential 3–4% reward in 3–7 days.

PSU vs Private Banks: Investment Battle1. Banking Landscape in India
India’s banking sector is unique, blending legacy government-run institutions with modern, technology-driven private entities. As of 2025, there are:
Public Sector Banks (PSBs): 12 major banks, including SBI, Punjab National Bank, Bank of Baroda. Government holds a majority stake.
Private Sector Banks: Around 20 significant players, including HDFC Bank, ICICI Bank, Axis Bank, and Kotak Mahindra Bank.
Foreign Banks: Limited presence, serving niche segments.
Regional Rural Banks and Cooperative Banks: Focused on rural and agricultural lending.
PSUs historically had a social mission, prioritizing financial inclusion and rural credit, sometimes at the cost of profitability. Private banks, by contrast, prioritize efficiency, profitability, and innovation, targeting urban and retail segments. This sets the stage for the ongoing investment debate between the two.
2. Understanding PSU Banks
History and Role
PSU banks have roots in the post-independence era, where the government sought to consolidate fragmented banks and direct credit toward nation-building projects. The nationalization of 14 major banks in 1969, followed by six more in 1980, created the PSU banking system we see today. The objective was to:
Expand banking access to rural areas.
Fund agriculture, small businesses, and priority sectors.
Ensure financial stability during economic challenges.
Strengths of PSU Banks
Government Backing: Full support in crises, ensuring deposit safety.
Wide Reach: Extensive branch networks, especially in rural India.
Trust and Stability: Legacy institutions like SBI enjoy strong brand recognition.
Policy Benefits: Preferential government deposits and funding.
Weaknesses of PSU Banks
High NPAs (Non-Performing Assets): Historically, poor credit appraisal led to stressed assets.
Operational Inefficiency: Legacy systems, bureaucracy, and slow decision-making.
Lower Profitability: ROE and NIM often lag private peers.
Limited Innovation: Digital adoption and customer experience often lag private banks.
3. Understanding Private Banks
Emergence and Growth
Private banks gained prominence post-liberalization (1991), focusing on urban and semi-urban markets. HDFC Bank (1994) and ICICI Bank (1994) pioneered private sector banking with modern technology, efficient risk management, and customer-centric products.
Strengths of Private Banks
Higher Profitability: Strong ROE, better margins, and lean operations.
Innovation: Digital banking, mobile apps, and AI-driven solutions.
Asset Quality: Lower NPAs due to stricter credit appraisal.
Brand and Service: Emphasis on customer experience and retail lending.
Weaknesses of Private Banks
Limited Rural Reach: Focus on profitable urban segments, neglecting rural credit.
Dependence on Retail Credit: Vulnerable to interest rate fluctuations and economic cycles.
Higher Competition: Niche banks face intense competition from both PSUs and fintechs.
4. Investor Perspective
Dividend vs Growth Investing
PSU Banks: Often provide stable dividends due to government support, appealing to income-focused investors.
Private Banks: Focus on growth; dividends may be lower but capital appreciation is higher.
Risk vs Return Profile
PSU banks are lower-risk in terms of deposit safety but higher operational and credit risk.
Private banks offer higher returns but are more exposed to economic cycles and market volatility.
Long-Term vs Short-Term Outlook
Long-term investors may benefit from PSU reforms and privatization, while private banks continue to grow due to market share gains and digital adoption.
5. Regulatory & Policy Support
RBI Oversight: Capital adequacy, NPAs, and risk management regulations apply to all banks.
Government Reforms: Privatization plans and capital infusion for PSU banks aim to improve competitiveness.
Priority Sector Lending: PSUs are mandated, private banks have optional compliance with targets.
6. Future Outlook
Digital Disruption
Private banks are adopting AI, fintech partnerships, and advanced analytics faster, potentially widening the performance gap.
Credit Demand
India’s growth trajectory (targeting a $5 trillion economy) ensures rising credit demand. Both PSU and private banks will benefit, but private banks may gain market share in retail and SME segments.
PSU Revival
With government reforms, improved risk management, and digitization, PSUs could become more efficient, making them attractive for long-term value investors.
Private Expansion
Private banks continue to expand in semi-urban and rural markets, leveraging technology to offer competitive products.
Conclusion: The Investment Battle
The battle between PSU and private banks is essentially a trade-off between safety, stability, and growth:
PSU Banks: Suitable for risk-averse investors seeking dividends and potential long-term gains from reforms.
Private Banks: Suitable for growth-focused investors seeking high returns and digital innovation exposure.
Balanced Portfolio Approach: Combining both can provide a mix of stability, income, and growth potential.
The investment choice depends on individual risk appetite, investment horizon, and market outlook. PSU banks represent legacy, government backing, and potential undervaluation, while private banks symbolize efficiency, innovation, and growth. Understanding these dynamics is critical for investors navigating India’s complex banking sector.

$BTC short planAs for now CRYPTOCAP:BTC is trading near 116K$, market sentiments are very bullish, so i think if even after tomorrow rates cuts if we get 120K$ that will be a good area to short the market keeping stoploss above the previous highs and targetting lower.

BTCUSDT Elliott Wave Analysis (2H Chart)Currently tracking a 5-wave Elliott structure:
Wave (1) initiated the bullish impulse.
Wave (2) retraced back with healthy correction.
Wave (3) extended strongly, showing momentum.
Wave (4) completed with a corrective pullback.
Wave (5) is in progress, approaching the liquidity zone between 117,000 – 119,500.
⚡ Price is now pushing towards the upper liquidity zone where potential supply and profit-taking may occur.
⚠️ Watch for possible reversal or consolidation around this area after Wave (5) completes.
Key Levels to Watch:
Support: 110,700
Resistance / Liquidity: 117,000 – 119,500
This zone could decide whether BTC continues higher or begins a corrective ABC structure.

Bitcoin Market Update – September 15, 2025🔴 Bitcoin Market Update – September 15, 2025
📈 The main trend is still UP
💹 Last week, Bitcoin closed the trading session around 115k2 and is currently hovering near 115k4. The weekly (W) candle of Bitcoin is showing quite a good signal, closing as a green candle with a short wick.
📊 Volume is at an average level, but this gives the market a positive outlook as the price just successfully retested the 20 EMA. Most of this volume comes from traditional inflows via BTC ETFs (as I analyzed in last week’s LIVE session).
📰 News: This week, the Federal Reserve Interest Rate decision is an important event, scheduled at 1 AM on Thursday.
⚡ Short-term strategy:
✅ The current market condition is favorable for altcoins.
✅ Focus on trading altcoins.
✅ Only do scalping trades and prioritize LONG (BUY) positions.
⚠️ Current disadvantage for Bitcoin:
🔻 MACD has shown a bearish divergence at the top.
🔻 The current price zone may form a consolidation range on the W timeframe (Gray box zone).
🛡️ Nearest support: 108k
🚀 Nearest resistance: 123k
🍀 Wishing everyone an efficient trading week ahead!

BTCusdtBTC positional view - looks like making support near 105000-107000 zone next any correction in next 4-5 session towards 112000-113500 level will be good opportunity to position for long for tgt 140000 expecting in next 2-3 month .

Timeframes Change EverythingInfluential educators often spread erroneous ideas that end up costing the community money. One of the most harmful opinions, sadly accepted by most investors, is that all timeframes are equal for practical purposes, since the market is fractal. With this article, I aim to shed light on this phenomenon and demonstrate that timeframes are more than just a matter of preference.
Mass Psychology and Historical Record
Shorter timeframes, such as intraday charts, offer a price record and a more limited context compared to longer timeframes—daily, weekly, or monthly—which can make it difficult to identify clear and reliable patterns. Additionally, another relevant aspect is that the duration of a market phenomenon is often an indicator of its consistency: trends that persist over time tend to reflect more stable and predictable behavior.
For this reason, investors prefer to base their decisions on an analysis that considers a greater amount of historical data, such as that provided by longer timeframes. The lack of a complete history limits the ability to detect solid and consistent patterns, increasing the risk of less informed decisions.
News, Events, and Rumors
The appearance of a surprise announcement about interest rates or a geopolitical event can trigger panic or euphoria among investors, leading them to buy or sell assets without a clear strategy. Even a simple rumor can cause chaos in price charts, highlighting how unpredictable humans are in the face of new circumstances. This instability is generally clearly reflected in 5-, 15-, or 60-minute charts, where volatility increases dramatically. The historical record of this irrationality rarely affects trends in longer timeframes, which offer a more stable and consistent perspective.
On this, the renowned investor and author, Dirk du Toit , has said the following:
"The smaller your timeframe, the greater the randomness of what you're observing. If you're watching price changes every five or fifteen minutes, the degree of randomness is very high, and your probability of anticipating the next correct price movement, or series of price movements, is very low."
Manipulation:
Higher timeframes require a greater volume of money to be manipulated, as the interests that form the price action have matured over a longer period (increasing their reliability). Generally, higher timeframes are operated by more capitalized participants who trade with long-term objectives.
High-frequency trading (HFT) is a form of automated trading that uses advanced algorithms, high-speed computer systems, and low-latency connections to execute a large number of trades in fractions of a second. This type of trading is characterized by exploiting small market inefficiencies, operating with large volumes, and holding positions open for extremely short periods.
In lower timeframes, price movements can appear random or "noisy" due to HFT activity, which makes traditional technical analysis difficult for manual traders.Technical patterns (such as supports, resistances, or breakouts) can break quickly due to algorithmic action, which does not operate based on classical patterns, but on high-frequency data like order flow or statistical correlations.
Randomness increases with shorter timeframes. An example of this is the reduction in the success rate of trading systems as we move to lower timeframes. Profitable systems (documented) on daily charts can become unusable on timeframes like 4-hour or 1-hour.
Additional Ideas:
-All classic indicators (MACD, RSI, Bollinger Bands, Keltner Channels, Donchian Channels, Williams Alligator, Ichimoku Cloud, Parabolic SAR, DMI, etc.) have been created based on timeframes higher than intraday.
-All known classic methodologies (Dow Theory, Chartism, Elliott Theory, Harmonic Patterns, Wyckoff Method, Gann Theories, Hurst Cycles, Japanese Candlestick Patterns, etc.) were created with a focus on timeframes higher than intraday.
-All great classic analysts, and most great current investors, apply an investment approach higher than the intraday timeframe.
On Some Authors:
-Richard W. Schabacker in his book “Technical Analysis and Stock Market Profits” (1932) structured market fluctuations into Major Movements (monthly chart or higher), Intermediate Movements (weekly chart), and Minor Movements (daily chart). His analyses were based on the study of these timeframes.
"The more time it takes for the chart to form the image of any formation, the greater the predictive significance of that pattern and the longer the subsequent movement, the length, size, and strength of our formation."
- Dirk du Toit in his book titled “Bird Watching in Lion Country” comments:
"The smaller your timeframe, the greater the randomness of what you're observing. If you're watching price changes every five or fifteen minutes, the degree of randomness is very high, and your probability of anticipating the next correct price movement, or series of price movements, is very low."
"A coin, just like a five-minute chart, has no memory. Just because it has come up heads eight times in a row, it doesn't start to 'adjust' to provide the required probability balance of a 50/50 ratio in a given number of tosses. Five- or fifteen-minute charts are the same. Trying to predict whether the next five-minute period will end up or down is exactly like flipping a coin."
Conclusions:
I do not intend to dismiss methodologies that take advantage of fluctuations in shorter timeframes. My goal is to warn retail investors about the risks of intraday trading: randomness, manipulation, and limited information turn these timeframes into dangerous terrain. Even effective systems proven on daily charts tend to suffer statistical wear. In contrast, higher timeframes offer clarity and consistency, backed by mass psychology, historical record, and trading volume.

BTC Buy Zone Forming – Potential Bullish Breakout AheadAnalysis:
Trend Structure: After a corrective decline from the $124K resistance area, BTC has rebounded strongly, forming a rising channel (highlighted in blue).
Support Levels: Strong demand observed near $107,200, aligning with the 0.868 Fibonacci retracement, making it a crucial support zone.
Buy Zone: Chart highlights the $114K–$116K range as a buy zone before continuation of the upward trend.
Resistance Levels: Key resistance remains around $124K–$126K, which is the next major target if the bullish momentum sustains.
Outlook: As long as BTC stays above $114K support, the bias remains bullish, with a potential rally towards $120K–$124K. A breakdown below $112K would invalidate the bullish scenario.
✅ Bias: Bullish continuation
🎯 Targets: $120,000 → $124,000
🛑 Invalidation: Break below $112,000
Bitcoin Correction or Trap? What’s Next for BTCBitcoin Correction or Trap? What’s Next for BTC
📊 Bitcoin Market Analysis (BTC/USDT)
🔹 Fundamental Outlook
Macro Environment
Global liquidity conditions remain a key driver for Bitcoin. With central banks signaling slower tightening and some economies leaning toward easing, risk assets like crypto gain renewed interest. This keeps institutional flows active, even amid volatility.
Investor Sentiment
Market confidence has been mixed—recent ETF inflows show strong long-term positioning, while short-term traders are exiting positions due to price uncertainty. This dual behavior creates volatility but underscores Bitcoin’s sustained appeal as a hedge against inflation and monetary instability.
Adoption & Regulation
Ongoing regulatory clarity in major regions (U.S., EU, Asia) adds both challenges and opportunities. While restrictions dampen speculative activity in some markets, clearer frameworks are encouraging institutional adoption.
🔹 Technical Outlook
Trend Observation
The chart shows a prior bullish impulse followed by a sustained corrective phase. Momentum has clearly shifted from strong upward pressure to a controlled decline, suggesting a cycle rotation is in play.
Market Structure
Recent price action highlights break-of-structure events on the downside, reflecting that sellers temporarily dominate. However, consolidation phases are appearing, often precursors to volatility expansion.
Momentum & Volume
Declining volume on the latest drops suggests that selling pressure may be losing strength. This opens the probability for accumulation at lower price zones before the next directional move.
Possible Scenarios
Short-term weakness: Further decline is possible as the market continues to seek liquidity.
Medium-term recovery: If macro tailwinds (liquidity injections, ETF demand, weaker USD) persist, Bitcoin may reattempt a bullish cycle once accumulation is complete.

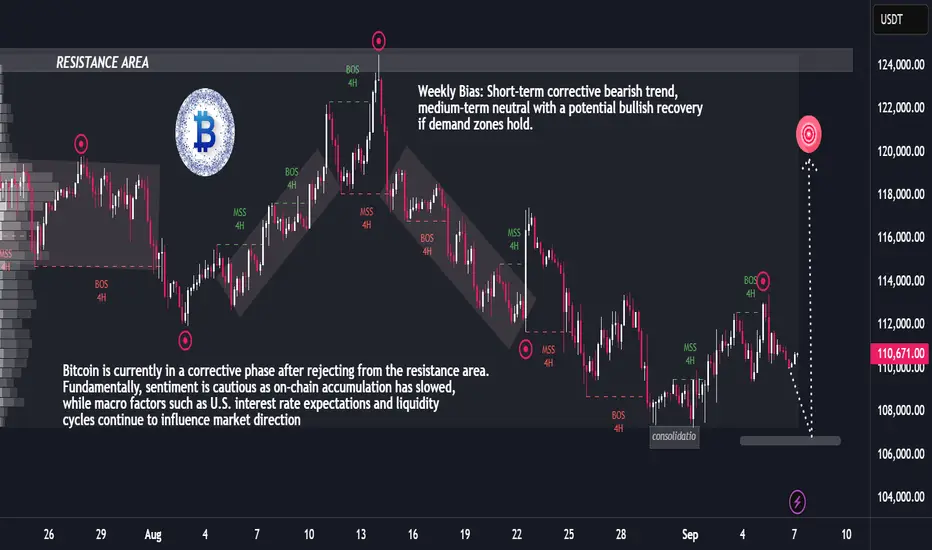
BTC Weekly Analysis: Correction Phase with Rebound PotentialBTC Weekly Analysis: Correction Phase with Rebound Potential
Weekly BTCUSDT Fundamental–Technical Report
Bitcoin has entered a consolidation-to-correction phase after failing to hold momentum above the resistance zone. From a fundamental perspective, global liquidity conditions and Fed rate expectations remain the primary drivers, while institutional demand provides medium-term support. On-chain activity shows stable network usage but weaker whale accumulation, signaling reduced aggressive buying in the near term.
From a technical perspective, the chart reflects a sequence of market structure shifts (MSS) and breaks of structure (BOS) on the 4H timeframe, highlighting a transition from bullish momentum into a controlled correction. Current price action suggests pressure toward the 106k–107k demand zone, where market reaction will be decisive. A strong defense at this level could trigger a rebound toward 114k–120k, while a breakdown below 106k would expose Bitcoin to deeper downside risk around 104k.
Weekly Bias: Short-term corrective bearish trend, medium-term neutral with a potential bullish recovery if demand zones hold.
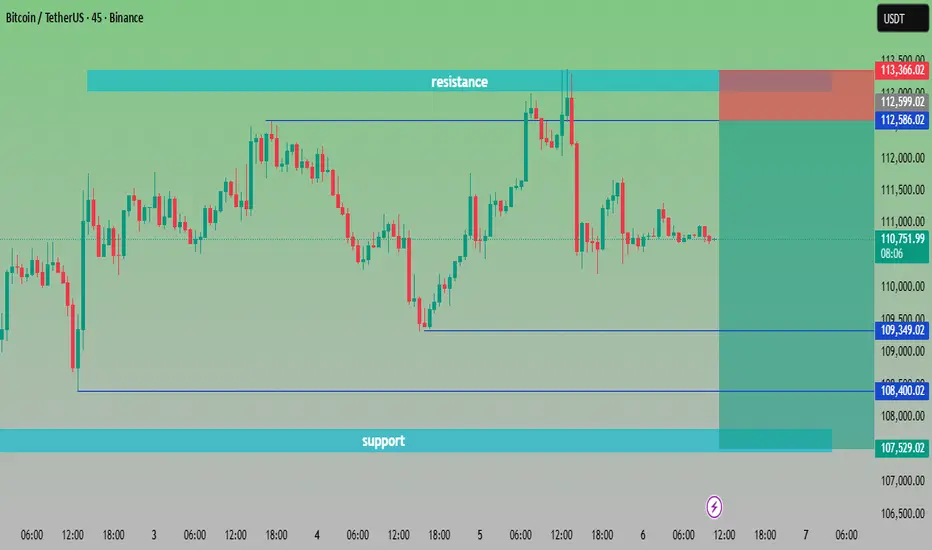
“BTC/USDT at Crossroads | Key Levels to Watch🔎 Chart Analysis – BTC/USDT (45m)
Resistance Zone: Around 112,586 – 113,200 USDT. Price has tested this area multiple times but failed to break out, confirming strong selling pressure.
Support Zone: Around 107,529 – 108,400 USDT. Buyers have consistently defended this zone, making it a key demand area.
Current Price: 110,720 USDT, sitting in the middle of support and resistance.
📌 Scenarios:
Bullish Case 🟢🚀 – If BTC breaks above 112,586 USDT, momentum could push toward 113,500+ USDT.
Bearish Case 🔴📉 – If BTC fails to hold 109,349 USDT, price may retest the deeper support around 107,500 USDT.
⚖️ Trading Plan Idea:
Long Entry: Above 112,600 breakout ✅
Short Entry: Below 109,300 breakdown ❌
Target Zones:
Upside 🎯 → 113,500+
Downside 🎯 → 107,500
Part 2 Master Candlestick PatternTypes of Options and Market Participants
1. Call Options (Right to Buy)
A Call Option gives the holder the right to buy an asset at a strike price. Investors use calls when they expect prices to rise.
Example: Buying a TCS ₹3,000 Call at ₹100 premium means you profit if TCS rises above ₹3,100 before expiry.
2. Put Options (Right to Sell)
A Put Option gives the holder the right to sell at a strike price. Used when expecting prices to fall.
Example: Buying Infosys ₹1,500 Put at ₹50 premium pays off if Infosys drops below ₹1,450.
3. Option Market Participants
Hedgers: Reduce risk by using options as insurance. (e.g., farmer hedging crop price, or investor protecting stock portfolio).
Speculators: Bet on price movements to earn profits.
Arbitrageurs: Exploit price differences across markets.
Writers (Sellers): Earn premium by selling options but take on higher risks.
Psychology & Discipline in Option Trading
Trading is not just math. It’s mindset.
Fear of Missing Out (FOMO): Leads to impulsive trades.
Over-Leverage: Options tempt traders with small premiums, causing overtrading.
Discipline: Setting stop-loss, position sizing, and risk management is crucial.
Patience: Most successful option traders focus on probability, not prediction.

[SeoVereign] BITCOIN BEARISH Outlook – September 03, 2025Let me first take a look at the situation of Bitcoin.
Currently, the situation of Bitcoin is not very good.
These days, it has been continuing to decline, based on 124,400.
Unfortunately, I expect there will be a little more decline this time as well.
The first is the double top.
If you check around 111,760, you can see that a double top has formed.
Accordingly, we can expect a downward trend, and since the bottom trigger in between has also broken downward, I believe this has been clearly confirmed.
The second is that the arbitrary wave M wave is forming a length ratio of 1.618 of the N wave.
This part could be carefully counted by attaching names according to Elliott Wave theory, but as those who have been reading my articles for a long time would know, I consciously do not count waves in detail.
I judge that focusing only on the length ratio is better.
The third is the downward break of the trendline.
The trendline refers to the trendline that can be found when connecting 108,400 and 110,240.
Since this trendline has been broken downward, I think Bitcoin could see a short-term decline.
Lastly, although it is not certain so it is a bit ambiguous to say, the movement that has been forming since August 29 at 21:30 could be seen as a Shark pattern.
This part is somewhat ambiguous to define as a harmonic because the range is formed ambiguously, but I thought it would be better to write it down, so I am informing you.
By comprehensively judging the above matters, I estimated the final TP to be around 107,778.
All the grounds in this article have been carefully drawn on the chart, so I think there will be no significant difficulty in reading.
I will continue to track this idea, and as the movement develops, I will deliver additional information to you through updates of this idea.
Thank you for reading.

Inflation and Its Impact on Markets1. Understanding Inflation
1.1 Definition
Inflation is the rate at which the general level of prices for goods and services rises, eroding the purchasing power of money. If the inflation rate is 6% annually, an item costing ₹100 this year will cost ₹106 the next year, assuming all else remains equal.
1.2 Causes of Inflation
Economists generally classify inflation into two broad categories:
Demand-Pull Inflation – Occurs when aggregate demand in an economy outpaces aggregate supply. Example: rising consumer spending, government expenditure, or investment that pushes up prices.
Cost-Push Inflation – Triggered when production costs rise (e.g., due to higher wages, raw material costs, or supply chain disruptions), and businesses pass these costs onto consumers.
Other causes include monetary expansion (too much money chasing too few goods), structural bottlenecks, taxation policies, or geopolitical crises that disrupt supply chains.
1.3 Types of Inflation
Creeping Inflation: Mild (1–3% annually), often seen as healthy for growth.
Walking Inflation: Moderate (3–10% annually), may start hurting purchasing power.
Galloping Inflation: Double-digit inflation, destabilizes economies.
Hyperinflation: Prices rise uncontrollably (e.g., Zimbabwe, Venezuela).
Stagflation: Inflation combined with stagnation in economic growth and high unemployment (1970s U.S. example).
Deflation: Persistent fall in prices, often damaging as it discourages spending and investment.
1.4 Measuring Inflation
Common indicators include:
Consumer Price Index (CPI): Tracks retail prices of a basket of goods and services.
Wholesale Price Index (WPI): Measures price changes at the wholesale level.
Producer Price Index (PPI): Monitors prices from the producer’s perspective.
GDP Deflator: Broader measure of inflation in an economy.
2. Inflation and Its Impact on Financial Markets
Inflation has a multi-dimensional impact on different segments of financial markets. Let’s examine them one by one.
2.1 Impact on Stock Markets
Stocks represent ownership in companies, and inflation affects corporate earnings, investor sentiment, and valuation multiples.
Corporate Profits:
Rising inflation increases costs of raw materials, wages, and borrowing. If companies cannot pass these costs to consumers, their profit margins shrink.
Valuation Multiples:
Higher inflation leads to higher interest rates (central banks hike rates to control inflation). As rates rise, the present value of future cash flows declines, leading to lower stock valuations (P/E ratios fall).
Sectoral Impact:
Winners: Commodity producers (oil, metals, agriculture), energy firms, FMCG companies with strong pricing power.
Losers: Consumer discretionary, technology, and financials (due to margin pressure and higher cost of capital).
Investor Sentiment:
Inflation creates uncertainty. Equity markets often turn volatile during inflationary phases as investors reassess growth prospects.
Example: In the 1970s U.S., inflation was extremely high due to oil shocks, and stock markets delivered poor real returns.
2.2 Impact on Bond Markets
Bonds are highly sensitive to inflation because they provide fixed income.
Interest Rates and Yields: When inflation rises, central banks raise policy rates. This pushes bond yields up, causing bond prices to fall.
Real Returns: Inflation erodes the real return of fixed-income instruments. For example, if a bond yields 5% but inflation is 7%, the real return is –2%.
Inflation-Indexed Bonds: Governments issue instruments like TIPS (Treasury Inflation-Protected Securities) in the U.S. or Inflation-Indexed Bonds in India to protect investors.
Conclusion: High inflation is generally negative for bondholders, except for inflation-linked securities.
2.3 Impact on Currency Markets
Inflation has direct implications for currency values in the forex market.
Currency Depreciation: High inflation erodes purchasing power and often leads to depreciation of a country’s currency.
Interest Rate Differential: Central banks raise rates to curb inflation, which can temporarily strengthen a currency due to higher returns on domestic assets.
Trade Balance: Inflation makes exports costlier and imports cheaper, widening trade deficits, further pressuring the currency.
Example: Turkish lira has depreciated sharply in recent years due to persistently high inflation.
2.4 Impact on Commodity Markets
Commodities as Hedge: Commodities like gold, oil, and agricultural goods often perform well during inflationary periods, as they are tangible assets.
Input Cost Pressures: Rising commodity prices themselves fuel inflation, creating a feedback loop.
Energy Prices: Oil price shocks are among the most common triggers of global inflation.
2.5 Impact on Real Estate
Real estate is often seen as a hedge against inflation.
Positive Effects: Property values and rental incomes tend to rise with inflation, protecting investors.
Negative Effects: High interest rates increase mortgage costs, reducing affordability and slowing demand.
Commercial Real Estate: Long-term leases may lag inflation, impacting yields for landlords.
3. Inflation and Central Bank Policies
Central banks, such as the Federal Reserve (U.S.), European Central Bank (ECB), and Reserve Bank of India (RBI), play a pivotal role in managing inflation.
3.1 Tools of Monetary Policy
Interest Rate Hikes: To cool demand.
Open Market Operations: Controlling money supply.
Cash Reserve Ratio / Statutory Liquidity Ratio: Used by RBI to regulate liquidity.
Forward Guidance: Communicating policy stance to manage expectations.
3.2 Inflation Targeting
Many central banks adopt formal inflation targets (e.g., 2% in the U.S. and Eurozone, 4% in India) to maintain price stability.
3.3 Dilemma for Policymakers
Too Aggressive Tightening: Risks slowing growth or causing recession.
Too Soft: Risks runaway inflation.
4. Historical and Global Case Studies
4.1 The U.S. in the 1970s – Stagflation
Oil price shocks triggered high inflation + low growth.
Stock markets stagnated, bonds suffered, commodities soared.
4.2 Zimbabwe (2000s) – Hyperinflation
Prices doubled every few hours.
Currency lost value, people resorted to barter trade.
Financial markets collapsed.
4.3 India (2010–2013) – High Inflation Phase
CPI and WPI inflation soared due to food and fuel prices.
RBI raised rates multiple times, slowing growth.
Equity markets remained volatile, bond yields spiked.
4.4 Pandemic & Post-Pandemic (2020–2023)
Global supply chain disruptions + fiscal stimulus led to inflation surge.
Central banks responded with aggressive rate hikes.
Stock markets turned volatile, real estate demand shifted, commodity prices spiked.
5. Inflation and Investor Strategies
Investors cannot control inflation, but they can adapt strategies to protect their wealth.
5.1 Hedging Against Inflation
Commodities: Gold, silver, oil, agricultural products.
Real Assets: Real estate, infrastructure.
Equities: Companies with strong pricing power, dividend-paying stocks.
Inflation-Protected Bonds: TIPS, index-linked government securities.
5.2 Portfolio Diversification
Balancing equities, bonds, commodities, and alternative assets reduces the risk of inflation eroding overall portfolio value.
5.3 Sector Rotation
Moving investments into inflation-friendly sectors (energy, utilities, consumer staples) during high inflationary phases.
6. Broader Economic and Social Implications
Purchasing Power: Consumers struggle as essential goods (food, fuel) become costlier.
Wage-Price Spiral: Workers demand higher wages → businesses increase prices → further inflation.
Inequality: Inflation hurts low-income households more, as they spend a larger share of income on essentials.
Political Instability: Persistent inflation can lead to social unrest, protests, and government changes.
7. Conclusion
Inflation is a double-edged sword. Controlled inflation is a sign of a healthy, growing economy, ensuring that demand is strong and businesses are profitable. But when inflation becomes excessive or unpredictable, it erodes purchasing power, distorts investment decisions, destabilizes financial markets, and undermines trust in economic management.
Its impact on markets is wide-ranging:
Stocks face pressure due to higher costs and lower valuations.
Bonds lose value as yields rise.
Currencies depreciate if inflation is uncontrolled.
Commodities and real estate often benefit, acting as hedges.
For policymakers, investors, and ordinary citizens, understanding inflation is essential. It is not merely an economic indicator but a force that shapes market dynamics, business strategies, and household decisions. In an interconnected global economy, inflation in one part of the world can ripple across continents, influencing global capital flows and market stability.
