It's Time to get fully Bearish on Bitcoin for next 3 years.I think this bull cycle is over now and now its time to get bearish on Bitcoin till 2028.
My targets of bitcoin for next three years is 76000 dollar or possibly 56000 dollar is conditions get worse.
Trade ideas

BTCUSDT: Continued Growth in the Short TermBTCUSDT is currently trading within a stable price range, with a clear uptrend channel forming. After bouncing off the strong support at 116,000 USD, BTCUSDT is likely to continue its bullish momentum, with the first target set at 123,000 USD.
The latest news from the cryptocurrency market shows a growing confidence in Bitcoin, driven by positive signals from major financial institutions. Recent price corrections have created good buying opportunities for investors. The global economic situation, particularly the weakening of the USD and increasing institutional adoption of Bitcoin, is driving BTC's value higher.
Trading Strategy:
Buy: Enter a buy position when the price approaches the 116,000 USD support level again or breaks above 117,000 USD.
Stop-loss: Set a stop-loss below the 116,000 USD support level to protect in case of a reversal.
With the current market structure and supportive factors from both news and technical analysis, the bullish trend of BTCUSDT is highly likely to continue in the near term.

BTC - 18th Aug Before US Open - Dump & Pump or Dump ?History was repeating exactly till half of 5th wave but market considered new ATH as possible profit booking and sold off instead of going in to parabolic up move. The exact place where it has to start the parabolic up move it got dumped. Either its due to CME close and few market players doing false move or its sure dump or lack of buying at these high price or ETH got importance instead of BTC. In this cycle ETH, SOL and XRP and few mother crypto pulling the liquidity and BTC missing those money. Need to wait and watch today and this week. Right now price is still at swing low from where it can move to new ATH to 127 and 130K.

XAUUSD - SD + OTE + PD Array Entry/ExitThis long trade in XAUUSD includes cumulative entry and exit models.
1. SD - Standard Deviation Target 1 - 3274
Standard Deviation Target 2 - 3408
2. OTE - Optimal Trade Entry ( Equilibrium + 40 pips)
3. PD Array - 4H/15m FVG (caused due to CPI news)
PD array + OTE overlapping perfectly, so there's double confirmation.
Last manipulative leg before IDM (Inducement) and MSS (Market Structure Shift) taken for predicting Standard Deviation Targets.
This is a 1D + 4H PD array at play, with Liquidity of previous weekly candle already taken. So it's very possible that trade hits both of our targets.
Already 333pips captured in this trade, waiting for more, let's see what happens!
Share your thoughts and analysis below in the comments.
I'd honestly like to know about your opinion :)

SHORT BITCOIN1. Elliott Wave Count
The chart has an Elliott Wave (1–5) marked, showing a completed impulse wave down.
After the 5-wave decline, you’ve outlined a corrective A-B-C structure forming (in blue).
Wave A: Small rebound after the 5th wave.
Wave B: Expected pullback (still developing).
Wave C: Possible upward correction toward resistance (red zone).
2. Support & Resistance
Resistance Zone (Red box): Around 119,500 – 120,000 USDT.
This aligns with your stop-loss level → if BTC breaks above, bearish bias is invalidated.
Support Levels:
Short-term: Around 117,000 (current trading zone).
Stronger: 113,500 – 111,500, which is also your target zone.
3. Moving Averages
Yellow (50 MA) is sloping down and acting as dynamic resistance.
Pink (200 MA) is also trending downward → confirms broader bearish bias.
4. Trade Setup
Entry: Near 117,600–118,000 (current price).
Stop-loss: Around 119,665 (above resistance & corrective wave C top).
Take-profit target: ~111,570.
This is roughly a 1:3 risk-to-reward ratio, favoring shorts.
5. Market Implication
After a completed 5-wave down, BTC may attempt a corrective A-B-C bounce.
However, unless it breaks above 120,000, the bias remains bearish.
Breakdown below 117,000 could trigger momentum toward 113,500–111,500.

BTC LONG WEEKLY SETUP🚀 BTC Long Setup (SMC Based)
Entry Zone: 115,500 – 116,000
🎯 Targets: 117,000 | 118,000 | 119,000 | 120,000 | 122,000
🛡️ Stop Loss: 113,500
⚡ Plan: Waiting for a clean break + confirmation above 115.5k–116k zone before entering. Once triggered, scaling partial profits at each target level to secure gains while riding momentum.
Risk-Reward ratio looks 🔥 if managed properly. Always stick to your SL and don’t over-leverage.

BTC - TP 130K - History repeating with more bullish trendIn my previous chart I clearly said we are going to see 3rd wave as per history pattern seems to be repeating as per ABC pattern worked exactly. In chart clearly shown 3rd wave, 4th wave and one top followed by accumulation (right now happening) after 3rd wave and before parabolic 5th wave exactly happenings. From ABC to 4th wave its exact price move repeating and I wish and expecting the 5th wave in parabolic move and reach the FIB extension shown in chart for 130K logic. since its more bullish may be TP may be higher than 130K as well. Right now price is in accumulation phase after one top followed by wave3 top.
Do not lose your 50 to 60% BTC qty in any false moves. And do not take 100% long qty as well
Maintain Money Managment strictly.
Factors Supporting Crypto - mainly BTC and ETH
1) Fiat money printing causing $ index and US dollar weak
2) Strong US data, Euro zone data and no recession in any country now
3) All trade tax with Europe and China and most of the countries are good
4) Pension money flow in crypto in US + new adoption by corporates one after another
5) New IPO focusing on BTC and nonstop ETFs fund flow as usual

BTC - 17th Aug Asia Night view - Bullish TP1 -120700Explained my view in chart text it self. Its Bullish and expecting 120700 and 121600 minimum first to see if any resistance ome or not... not point is selling now and just need to be 50 to 60% capacity long in BTC now

BTC SHORT BTC Short Setup
Entry Trigger: Short only if a 15-min candle closes below 118,900
Stop Loss (SL): 119,300
Invalidation: Any 15-min candle close above 119,200
Target: 116,500
Bias: Bearish rejection expected near resistance zone 118,900–119,200
⚠️ Wait for confirmation close before entry. Strict risk management is key.

$BTC at make-or-break zoneCRYPTOCAP:BTC at make-or-break zone
Holding above $116K = bullish reaction likely → next leg higher Toward New ATH
Losing this support = bearish breakdown → eyes shift to $100K liquidity pool.
Market structure is clear: support defends or capitulation begins.

BTC - 17th Aug - Buy @ 117K during re test of supportBitcoin reacts and respects Fib levels and as expected seen taking support at very crucial and stronger support area around 117 K. Its a confluence of support area. 1) 10th Aug Strategy bought BTC at this area, 2) resistance line broken area converting to support. 3) FIB golden line area. Price is coming for re test of the support and expecting very good buying interest today 17th Aug. Its a must buy time in Bitcoin today. Buy with all required Money Management.
Last few days ETFs funds inflow only seen so many people are accumulating only,

BTC @ Strong Support - 117K Resistance turned Support areaIf Bitcoin is Bullish then price cant go further below than this area at 117K where price broke the resistance line forming the support. Which is the last and strongest support area for Bitcoin in chart.
I am 100% long in Bitcoin at this level now with all required margin in case of any more false down move. will need to hold this long for new ATH. I do not have any other strategy for now.
All data and impacting factors for Bitcoin suggesting +ve for Bitcoin.

BTC - 15th Aug - Buy Price as shown in chart around 118 and below is 2nd wave support and buy zone for upper 3rd wave. Trend is Bullish. SPX open higher than yesterday is bullish. I am expecting BTC moving to again new ATH or at least previous high. Risk - big players may manipulate to get their liquidity ... they too need to buy before pushing price to upside.... hold 50 to 60% long in BTC and hold tight for higher levels in coming days or even for today. All US , Europe Data is +ve for US equity and BTC. Dollar Index is crashing as expected fiat money. BTC will go up for sure

BTC LONG SETUPBTC LONG SETUP
Enter long in btc between 118300 to 118500
Sl 118000
Target 118800/119000/119300/119500/119000
Lets enter on btc long once it sustain above 118000 above and boom rally will start

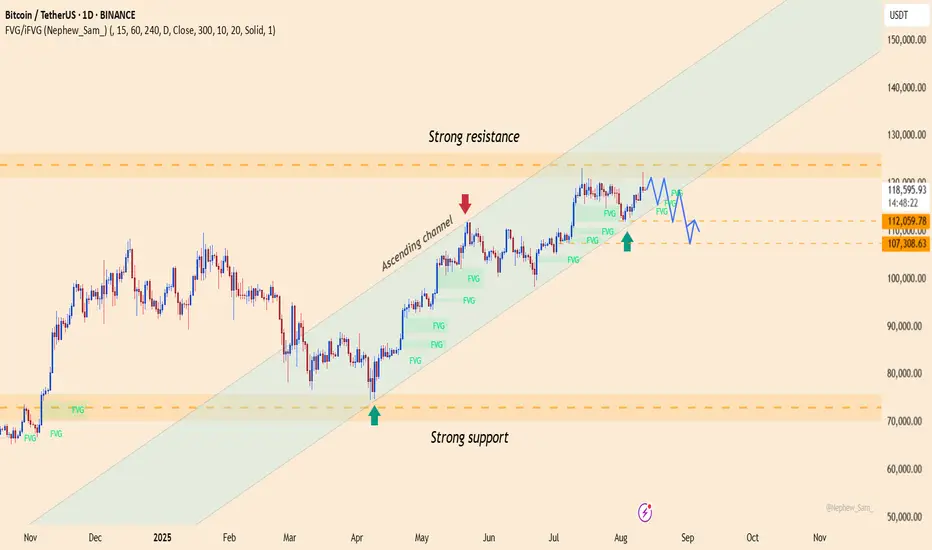
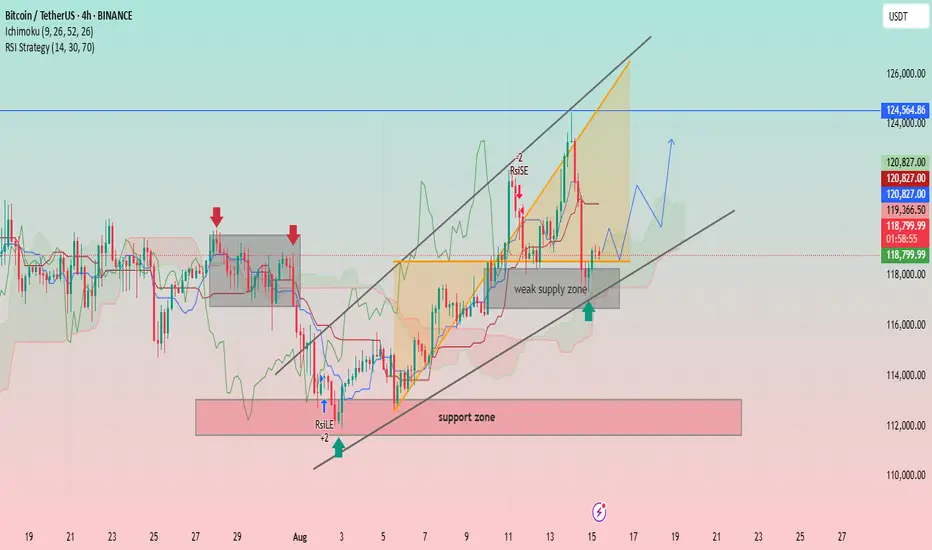
BTC/USDT: Bullish Momentum and Key Support LevelsUptrend Channel: The price is trading within an ascending channel, denoted by two parallel black trendlines. This suggests a bullish trend is in play.
Support and Resistance:
A significant support zone is identified between approximately 112,000 and 114,000 USDT.
A weak supply zone is marked around 118,000 USDT. The price has recently tested this area and found some support.
A strong resistance level is visible at approximately 124,564.86 USDT.
Indicators:
Ichimoku Cloud (9, 26, 52, 26): The price is currently trading above the cloud, indicating a bullish sentiment. The cloud itself appears to be thin and slightly bullish, suggesting potential for continued upward movement.
RSI Strategy (14, 30, 70): The Relative Strength Index (RSI) is used as a strategy, with a "RSILE" signal (likely "RSI Low Entry") marked with a "+2" and a red arrow, suggesting a potential buy signal near the support zone in early August. A "-2" signal is marked near the top of the channel, indicating a potential overbought condition or reversal signal.
Price Action and Projections:
The price recently experienced a sharp decline from the upper trendline, indicating profit-taking or resistance at that level.
The price is currently near the lower trendline and the "weak supply zone," which appears to be acting as support.
A potential future price path is drawn with a blue arrow, suggesting that the price may consolidate or bounce off the current support area and move higher towards the upper boundary of the channel.
Another potential path is drawn with a red arrow, showing a possible further drop towards the lower trendline before a bounce.
BTCUSDT – Continuing the Uptrend, Targeting 124,000 USDBTCUSDT continues its strong uptrend, with price moving within a stable ascending channel. The nearest support is at 116,900 USD, where the price has bounced and maintained its upward momentum. Recent fundamental factors, including rising demand and positive market sentiment towards Bitcoin, are driving this growth. The next target for BTCUSDT is the resistance zone at 124,000 USD. If this level is broken, BTC could move towards 135,000 USD.
Trading Strategy: Buy when the price tests support at 116,900 USD and wait for confirmation of continued upward movement. The target is 124,000 USD, and beyond that, 135,000 USD. Place a stop-loss below 116,000 USD. As long as the price remains above 116,900 USD, the uptrend remains intact.

BTC SHORTBTC is at ATH, now we can see some selling pressure. First indication is the strong red candle which was formed on 14th Aug. According to Price action it can test 108K and then and trend line which is in red coming from Nov 2022.
If we get a lower low formation in lower timeframe we can short below short and even if sl get hit can try to reenter.
I am confidant though.

BTC - 14th Aug - Buy re enter level - Buy below 121 for TP -131In my previous charts i clearly commented to Book Profit.
No Price has done correction 2nd wave all most done and
is expected to take key support at support & resistance
inter change zone marked in green in chart. This area is strong support zone forming a
strong W formation and rectangle of support given breakout on
up side. I strongly expect price to take support from here and move up side mostly.
Keep buying the dips with money management.
This view is given before US Jobs data expected in less than 1 hr from now
As pointed out earlier given CPI data failed to create any impact.
In my view this Jobs data too is not important for Bitcoin but few people
listen to others and do buy or sell ... Market makers need to pull BTC from others.
Buy BTC below 121 in small qty and green area at 121300 is strong level to accumulate.
Up move could be in sub waves which we will know based on price action.
We got Buy levels for now. Price went to new ATH due to so many big whales massive
buying and they are holding ... only the weak hands keep seeing US data and other news sell.
All corrective trend have lesser volume compared to main trend.
US Dollar Index and Dollar - Fiat money will keep crashing and Bitcoin going to Moon - 150 or 180 after 131 K

BTC Update 15th august BTC recovers the inefficiency left on10th July, bouncing on the support level at 111K and returning on the last target, in the red zone.
From a technical point, this is could be forecast following the empty zone, as the wick on July 14th, which underlines a POL (point of liquidity), also supported by the heatmap liquidation.
Fundamentally, this new sphere of positivity and institutional adoption is helping BTC's rally to conclude this cycle with the utter targets.
The grow in the past cycle is been sustained- less hyped than the previous two. Both due to the high currency price of the Big coin, which makes difficult have a high percentage changes in short time, and due the consistent consolidation of the VIX index. At the same time, the entrance of new institutional players, as side general traders, investors and big whales, has stabilized a bit the market in terms of entrance and exit, make it more forecastable and stable.
New targets in the next post.
Thanks for reading,
M

BTCUSDT – Uptrend ContinuesThe chart shows that Bitcoin (BTC) is moving within a strong ascending channel , with strong support at 117,300 USD. The current pattern indicates that each time the price tests this support level, BTC bounces back strongly, showing that buying pressure is dominant. The price has continuously broken through key resistance levels and is now heading towards 130,000 USD , where it may encounter strong resistance .
Regarding the news, although there are no direct events impacting Bitcoin today, the global cryptocurrency market continues to benefit from the stability of other risk assets and growing interest in assets like Bitcoin. Expectations for cryptocurrency adoption in major countries and the increase in Bitcoin investment funds are also driving the uptrend.
Currently, BTC is facing resistance at 3,407 USD, and if it breaks through successfully, it could continue to rise towards 3,450 USD. However, strong support remains at 3,330 USD, which could lead to a bounce if there is a minor pullback.
Strategy:
Buy around 117,300 USD, with a target of 130,000 USD.
Stop loss below 117,000 USD to protect the position in case the support is broken.

BTC - 13th Aug viewPrice seems to be making sub waves inside the 5th wave where we have new ATH targets open.
In the sub waves price just took 2nd wave support and make 3rd wave and need to see 4th sub wave re test 120200 to 120400 support area or else make false move by breaking to 118 which is a possibility but i do not want or do not expect it to happen after such a good up move. Just want to caution so money management is taken care and do trade only with 50 to 60% capital all ways. buy the dips and sell the rallies with profits and with no greed for more and more without taking profits... we will get dips too... or at least higher low with proved support to take raisk instead of chasing

BTCUSDT – Bulls Maintain Control, Upside Scenario IntactOver the past two days , the crypto market has been supported by a series of positive developments: yesterday, U.S. PPI data cooled, easing inflationary pressure and strengthening expectations that the Fed may soon cut interest rates; today, global risk sentiment improved as U.S. and European stock indices rebounded; and most recently, Bitcoin ETF inflows continued to post net gains, signaling that institutional investors remain confident in the bullish trend.
On the daily chart , BTC is still moving within an ascending channel, with a strong resistance zone around 121,000 – 122,000 USDT. Currently, the price is consolidating right near the upper boundary of the channel, showing that buying pressure remains in control. The strong support zone lies between 112,000 – 110,000 USDT, aligning with the channel’s lower boundary.
Preferred strategy: look for buying opportunities if the price pulls back toward 112,000 – 110,000 USDT, targeting a return to 121,000 USDT and potentially new highs. The bullish trend remains intact as long as the price stays within this ascending channel.