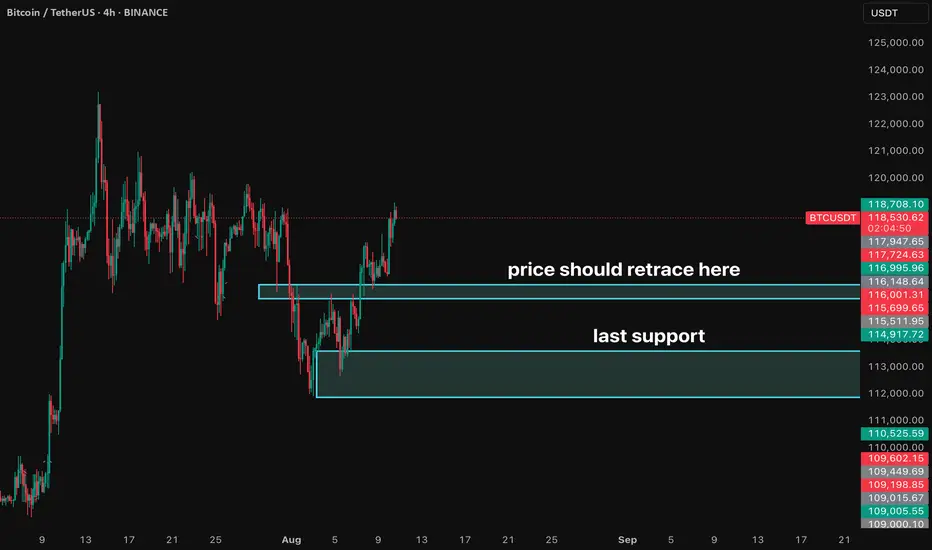
BTC Weekly and Daily analysisOverall BTC Analysis – Weekly + Daily View
Trend: Strong bullish structure on both weekly and daily.
Current Position: Price is sitting just below 118.5k–118.7k, a heavy resistance/equal highs zone with big buy-side liquidity.
Weekly View:
Major demand/support at 110.5k–111.8k (unmitigated OB + FVG).
Market likely to remain bullish unless we close below 109.6k.
Space above 118.7k for continuation if highs break.
Daily View:
Short-term demand at 115.5k–116.0k (last bullish base before recent push).
Small imbalance in this zone could attract a retest before any breakout.
Liquidity Picture:
Buy-side liquidity: Above 118.7k → could trigger strong upside if taken.
Sell-side liquidity: Below 116k → could be swept in a pullback.
Overall Bias: Bullish trend intact, but we’re at premium pricing and near resistance.
Healthy pullback into 115.5k–116k (daily) or deeper into 110.5k–111.8k (weekly) would strengthen the next leg up.
Trade ideas
Bitcoin Long idea:On the post previously as i was longed CRYPTOCAP:BTC since 115K$ and i think i will take partial profits @ 120500$ and next area will be New ATH
I think we are going up anyways to New ATH in bitcoin, But there is one scenario which i think is pretty much suitable for the market, we reach 120500 and market dump and we enter the consolidation period for CRYPTOCAP:BTC i.e. 111k$-120K$ area so i am bullish currently which is correct and will be bullish in every bullish dump we get, but i will build any big position keeping this range in mind if get
BASIC UNDERSTANDING-
I will look for a dump from 120500$ and i think we are going to be in the HTF choppy trend and if its gonna be true i will be longing that dip
BTC SHORTTrade Plan:
Price is expected to extend towards the 117,800 resistance zone. Upon reaching this level, monitor for signs of exhaustion. A 15-minute bearish rejection candle will serve as confirmation for a potential reversal entry. Maintain patience and allow the candle to close before initiating any short positions.
Key Levels:
Resistance: 117,800
Confirmation: 15-minute rejection candle close
Bias: Short after confirmation
Note: Avoid premature entries; confirmation is critical to minimize false signals.

Bitcoin is at Edge This is a very rare Pattern where it gives an option to Open Hedge Positions.
Upper Trend line is The Strong Resistance so we may se a small correction in price. ( 2% to 3% )

$BTC 15Mins Chart AnalysisCRYPTOCAP:BTC 15Mins Chart Analysis
Bitcoin has formed a Double Top pattern on the 15-minute timeframe at 117,000, signaling possible short-term exhaustion.
🔹Double Tops often indicate a potential pullback if the neckline is broken — here, the key neckline support sits around 116,350.
🔹Price is consolidating between 116,350 – 116,800 after the second top.
🔹A break above 117,000 could invalidate the pattern and invite bullish momentum.
🔹A drop below 116,350 may open the way toward 115,800 – 115,500.
🔹Bulls need to reclaim 117K+ quickly to avoid deeper correction.
🔹Bears will eye the neckline for confirmation.
BINANCE:BTCUSDT

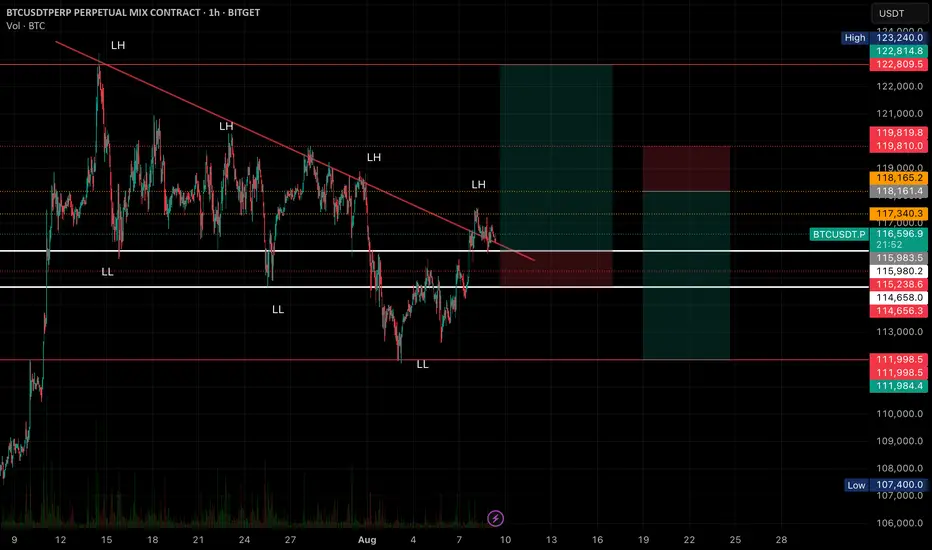
BTCUSDT – 1H Chart Analysis📊 BTCUSDT – 1H Chart Analysis
Current Structure
• Market has been in a downtrend with a sequence of Lower Highs (LH) and Lower Lows (LL).
• Price recently broke above the descending trendline and is now testing it for support.
• Key horizontal levels marked in white and red provide both breakout and rejection opportunities.
⸻
📈 Bullish Scenario (Breakout Confirmation)
• Trigger: If price holds above 116,000 – 116,200 and closes 1H above trendline.
• Entry Zone: 116,500 – 116,800 (post retest confirmation)
• Targets:
• TP1: 117,340 (immediate resistance)
• TP2: 118,165 (strong supply zone)
• Extended: 119,810 – 122,800 (major liquidity zone)
• Stop Loss: Below 115,980 (trendline break + support fail)
⸻
📉 Bearish Scenario (Rejection & Breakdown)
• Trigger: If price fails to hold above the trendline and breaks below 115,980.
• Entry Zone: 115,800 – 115,500 (after breakdown retest)
• Targets:
• TP1: 115,238 (previous demand)
• TP2: 114,656 (strong support)
• Extended: 112,000 – 111,984 (major demand)
• Stop Loss: Above 116,700 (fakeout invalidation)
⸻
💡 Summary:
• Bulls need a clean hold above the trendline to reverse the downtrend structure.
• Bears regain control if support breaks and price returns inside the descending channel.
• Watch volume closely — a breakout with weak volume may lead to a fakeout.
BTCUSDT – pressure building before the breakoutMarket context:
US trade policy eases restrictions for certain major tech companies → risk appetite improves.
Expectations of a more dovish Fed → capital flows return to the crypto market.
Sentiment & flows:
Short-term Bitcoin holdings increase by around 20 billion USD → trading activity is heating up, but profit-taking pressure is also building.
Investors are closely watching the 116,000 USDT level before adding aggressive long positions.
8H technicals:
Support: 112,600 USDT – a zone that has repeatedly triggered rebounds, maintaining the bullish structure.
Resistance: 116,000 USDT – the “gate” that could open the way to 123,000 USDT.
Bullish scenario remains favored if price closes above 116,000 USDT with confirming volume.
Key takeaway:
The market feels like it’s “winding the spring” – tight consolidation before a potential breakout.
A break below 112,600 USDT would invalidate the short-term bullish view and increase the risk of a deeper pullback.

[SeoVereign] BITCOIN BEARISH Outlook – August 10, 2025In the August 10th idea I’m sharing today, I would like to focus on the bearish perspective.
As a swing trader, I am not particularly tied to the major trend, but I believe that this decline is meaningful enough within the short time frame, and I would like to share this perspective with you.
The main bases used in this idea are as follows:
-Harmonic 1.902 Crab Pattern
-Traditional ratio relationships in Elliott Wave Theory (1.618)
-Full Fibonacci 0.618 retracement
Based on this, I have set the average target price at approximately 114,500 USDT.
As time goes by, I plan to add more specific drawings to support this idea so that you can understand it more easily, and if the target price is reached, I will also share the entry price and take-profit price for your reference.
Thank you very much for reading,
and I sincerely wish you an overwhelming amount of strong luck.
Thank you.

Bitcoin targets $133,000 with institutional capital inflowsBitcoin is currently trading in an upward channel, forming higher highs and higher lows, indicating a strong bullish trend.
Capital inflows from major financial institutions like JPMorgan and Citigroup are increasing into BTC, combined with expectations that the Fed will cut interest rates in September, providing positive momentum for the price. The Trump administration's cryptocurrency policies and Syz Capital reopening its BTC Alpha fund with 2,000 BTC have driven strong participation from institutional investors.
Technically, BTC has bounced off the support at $112,816 and could continue toward the resistance at $119,249. A break above this level could set the next target at $133,000 by the end of 2025. Investors should carefully monitor signals and manage risk accordingly.

Bitcoin’s $664K Target Is Not a Joke: It’s a Chart-Based WarBitcoin is forming a massive macro structure and the neckline is the final barrier.
Break above it, and the technical target stretches to $664,000.
Yes, you read that right.
This isn’t hopium. It’s based on measured move projections from the breakout zone.
The only question now:
Does BTC explode to $664K this cycle… or in the next?
One breakout changes everything.
Watch the neckline. Stay focused.
Note: NFa & DYOR
BTCUSDT Buy View
BTCUSDT showing bullish momentum. Expecting upside movement towards the target of 115,242 in the coming sessions

BTCUSDT facing resistance near recent highs - Short viewBTCUSDT losing bullish steam near resistance zone.
Selling pressure building up – signs of trend reversal visible.
🔻 Short Setup Activated
🎯 Target: 114,499 USDT

BTCUSDT – Institutional Money Returns, Signs of a Strong ReboundBitcoin is showing positive recovery signals as major capital flows are re-entering the market. Notably, Syz Capital has successfully raised $200 million to invest in BTC – a strong indicator of growing long-term confidence from institutional investors.
On the H8 chart, BTC remains in a downtrend channel but is forming an accumulation pattern around the 111,000 USDT support area. Previous FVG zones have been filled, suggesting buying pressure is absorbing supply well. Volume is also slightly increasing at the lows – indicating selling pressure is weakening.
If BTC holds above 111,000, a move toward 117,500 is likely, with potential to reach 120,000 if it breaks above the descending channel. This would confirm a clearer medium-term uptrend.

BTC Short Below: $113,500 SL: Above: $116,000 Target Levels (Take-Profit Zones):
🎯 TP1: $112,000
🎯 TP2: $110,000
🎯 TP3: $108,000
Consider partial profit-taking at each level and trailing stop to secure gains.
This setup aims to capitalize on potential bearish continuation following a breakdown below the $113,500 support zone. A 15-minute candle close below this key level would indicate weakening buyer interest and a shift in momentum. With proper confirmation, this setup offers a clean risk-to-reward ratio.
💡 Never enter on anticipation — wait for the 15m close. Manage your position sizing based on your capital and risk appetite. Don’t just trade to win, trade to last. 😎

BTC long planThis order I am playing in my Main account And this is safe order who wants safe side play

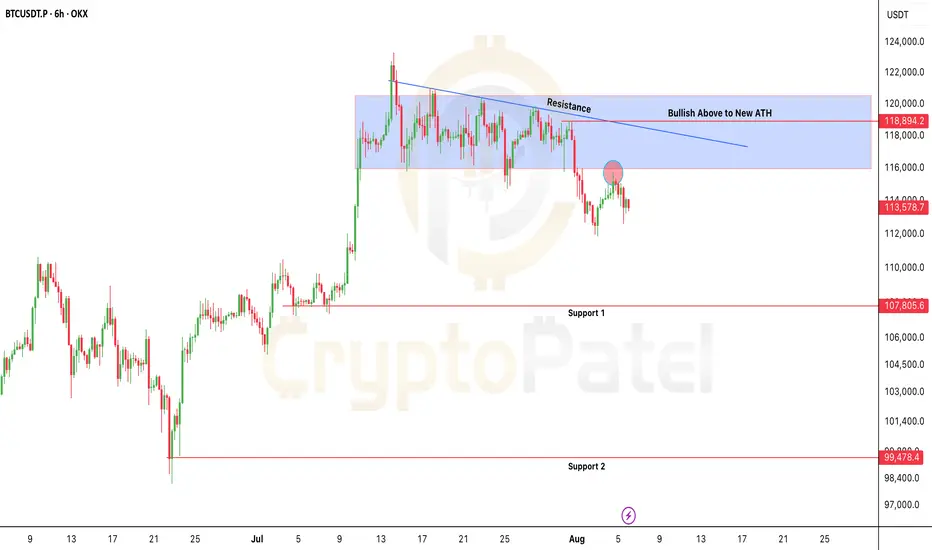
Bitcoin at Risk: $115.7K Is the Line Between Bounce or BreakdownBitcoin at Risk: $115.7K Is the Line Between Bounce or Breakdown
CRYPTOCAP:BTC is trading below key resistance ($115.7K–$118.9K) and rejected cleanly at the trendline.
As long as price holds below $115,700, bearish bias remains.
⚠️ Failure to reclaim = high risk of breakdown toward $107K and even sub-$100K levels.
Bearish invalidation only above $119K
NFA & DYOR
FOLLOW: BTC As for altcoin, the nowadays news has created few fluctuations in the market during the past days.
However BTC is following the path.
The downtrend continues, leaving high liquidity area at 122K, and recovering the inefficiency, as btc uses to do.
The ultimate target are still within the buy zone range, with POI at 111K and 104K.
This next drawdown will close the cup shape on daily tf, and follow the bearish altcoin forecasted trend.
Similar to cryptos, it satisfys the sellers and start a new cycle.
Patter-wise, it is similar to the btc's past ones: strong and consisted monthly flag pattern, made by head shoulders or cup shapes on shorter Time Frames.
Psychologically, i think this indicates a pursuing hope in investors behaviour followed by a partial satisfaticion, and so general exit from the maket due to the high price, which drown the price and makes an entry for big whales and institutionals to buy more. And then, price up, hope up...and again new cycle...
Hope has to be meant as a positive social acceptance and public curiosity which led traditional investors to explore this market.
Volumes sings for a high liquid zone at 111K on daily. At the same time the high amount in OI and liquidations at upper levels can led think of a bounce on ranging levels, 111K, and get the upper last targets, ≈122K, ≈135K, ≈154K.
Following the path.
Thanks for reading,
M

BTC - will the history repeat now ? 6th Aug 2025 viewIn Bitcoin previous patterns repeat and many people refer to previous year or earlier pattern.
The price at which price took support and moving up now is similar to the move in below levels in chart as shown and explained. only difference now is in the below pattern wave 3 was much earlier and very aggressive but right now its much lower level tested and yet to move up and show signs of wave 3 to confirm whether history will repeat or not. price action this week is crucial for Bitcoin

Chart update for BTCNBL
I trail my sl to strict at the pointed area
And tp also maintain on the chart
RSI also oversold area

BTC LONG SETUP📈 BTC/USD Long Setup – Eyes on the Rebound
Currently observing a potential bounce opportunity on Bitcoin from the 113,500 zone, which has been showing signs of acting as a near-term support.
🟢 Entry: 113,500
🔻 Stop Loss: 113,000 (conservative) / 112,900 (aggressive buffer)
🎯 Targets:
TP1: 114,000
TP2: 114,500
TP3: 115,000
TP4: 115,600++ (trail if momentum confirms)
Context:
Price is reacting off a micro support after a brief consolidation. RSI shows mild recovery from oversold territory, and we're seeing early signs of a potential short squeeze brewing. If bulls hold this level, we could see a clean rally into the mid-115K range.
⏳ Risk-Reward looks favorable here if BTC maintains above 113K. Manage sizing and consider scaling out at key resistance levels.

Bitcoin consolidationBTC has good retracement point till 107k to 108k. Then only it will be ready for next big move. Just my view as per chart.

BTCUSDT – Bullish trend remains intactBitcoin is still trading within a long-term ascending channel. After a mild pullback to the FVG zone around 112,100 USDT, the price rebounded and is now consolidating above the ascending trendline support. If this level holds, BTC is likely to continue toward the upper channel target at 122,500 USDT.
Recent news supporting the uptrend:
Fidelity and BlackRock have continued accumulating Bitcoin-related ETF shares.
Weak US jobs data has fueled expectations of a Fed rate cut, drawing capital back into crypto.
Ethereum's upcoming hard fork upgrade is boosting overall market sentiment.
With both technical structure and fundamentals aligned, BTC remains bullish as long as it stays above 112,100.

BTC SHORT VIEWbtc short setup:
target levels – 113k / 112k / 110k / 109k
stop loss – 118k
expecting minor upside momentum possibly up to 117k, but bias remains bearish. watching for a reversal and drop from that region.
