BTC MOVEMENT BULLISH OR BEARISH ?btc create a new ath 128000 ? BINANCE:BTCUSDT
btc in down trend line if the trend line breakout and wait for the conformation to retracement
entry in retracement take long
Trade ideas

[SeoVereign] BITCOIN BULLISH Outlook – July 26, 2025The previous idea did touch the average TP price, but showed a rather disappointing rebound, so I will once again attempt to capture the starting point of the rebound. It is still considered that one more upward wave remains.
Accordingly, the TP is suggested at 118,057 USDT.
As always, I will carefully observe how the chart develops over time and update this idea with further explanations by organically integrating its specific interpretations and underlying rationale.
Thank you.

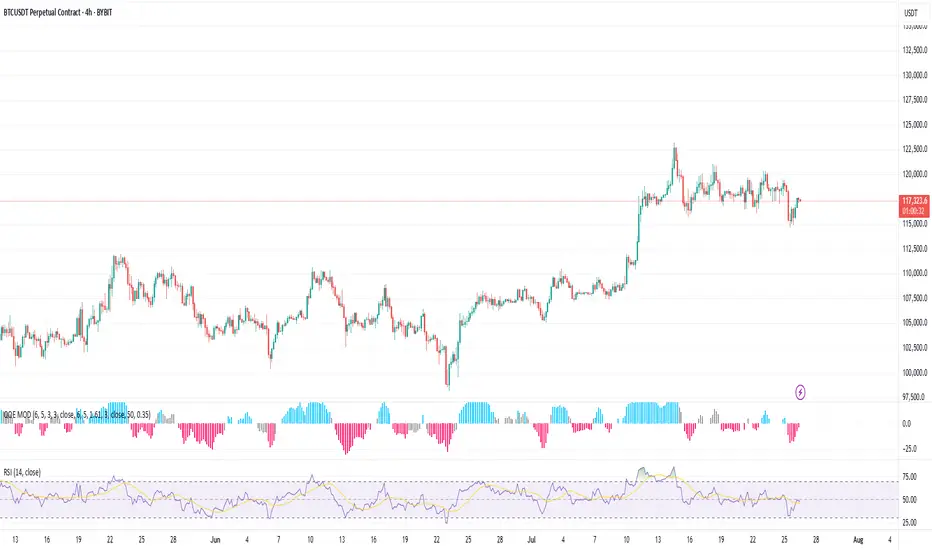
High Timeframe Profit Taking? Caution for Bulls!
After a strong run-up, the 4H BTC chart is showing the first signs of bullish exhaustion. With news breaking of a legacy whale offloading 80k BTC through Galaxy Digital, caution is warranted. Volatility is likely. Short-term downside is possible, but watch for dips to be aggressively bought if broader market structure remains bullish.
Short-term Support: 115k–113k zone (recent consolidation/last swing lows).
Major Resistance: 125k+ (recent top, failed to close above).
Momentum: QQE MOD histogram has just flipped negative after a multi-week rally, and RSI is declining, but no panic selling yet.
Possible Plays
1. Short-Term Cautious Short
Entry: On a failed bounce to 119k–120k, or any bearish rejection candle on the 4H.
Targets: 115k, then 113k.
Stop: Above 121.5k (last minor high).
Rationale: Momentum fading, whale news, and risk of further distribution.
2. “Buy the Fear” Scalps
Entry: If price flushes quickly into 113k–115k support zone, look for reversal candles or positive divergence on RSI/QQE for quick scalps.
Targets: 117k, 119k (previous support becomes resistance).
Stop: Tight below 112.5k (clear break of structure = get out).
Rationale: Market has absorbed large unlocks before; panic drops often get bought in uptrends.
Risk Factors
If market interprets the news as old/unimpactful (OTC handled, already priced in), a fast bounce could occur.
If whales continue to dump or spot selling accelerates, deeper correction to 110k or lower is possible.
Watch US stock indexes and macro for correlation spikes (risk-off can accelerate BTC drops).
BTCUSDT – Ready to Break the Resistance Wall?Bitcoin just made a perfect rebound from the $115,000 support zone and is now gathering momentum toward the $119,097 resistance. While price remains inside the descending channel, price behavior suggests a potential bullish breakout.
Latest news:
Grayscale confirmed an additional $1.2 billion investment into its Bitcoin fund.
The Fed is signaling a possible pause in rate hikes at the upcoming meeting → weakening USD → direct boost for BTC.
Technical outlook:
FVG zones have been filled → selling pressure is fading.
A “bounce – retest – breakout” formation is emerging.
The descending channel is under pressure, and buyers seem to be gaining control.

[SeoVereign] BITCOIN BULLISH Outlook – July 24, 2025We are the SeoVereign Trading Team.
With sharp insight and precise analysis, we regularly share trading ideas on Bitcoin and other major assets—always guided by structure, sentiment, and momentum.
🔔 Follow us to never miss a market update.
🚀 Boosts provide strong motivation and drive to the SeoVereign team.
--------------------------------------------------------------------------------------------------------
Hello.
This is SeoVereign.
I am still holding the long position that I suggested in the idea posted on July 9th.
Regarding the upward trend that started around 107,200 USDT, I have consistently maintained my position without much doubt until just before posting this idea, as there were no clear signs indicating a decline.
However, at the time of writing this idea, some elements suggesting downward pressure are gradually being detected. Nevertheless, this idea is constructed around the upward scenario. The reason is that, as mentioned in this idea, a ‘single upward move’ is expected to occur with relatively high probability. Whether this rise leads to a trend reversal or serves as a precursor to a downturn will likely depend on how the chart unfolds.
The average TP (target price) is set around 119,300 USDT.
As always, I will carefully observe how the chart develops over time and will update with further explanations that organically integrate the detailed interpretations and grounds of this idea accordingly.
Thank you.

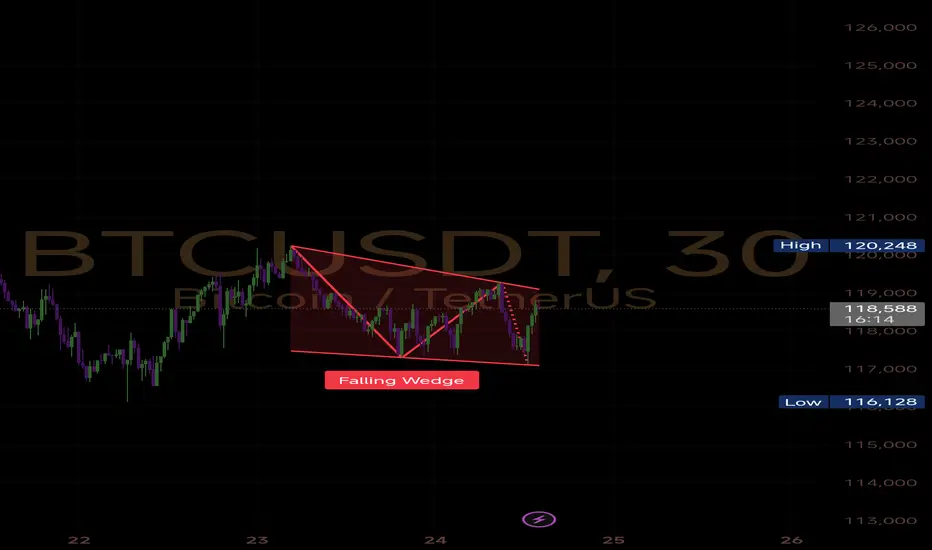
$BTC 30mins Chart Analysis
OKX:BTCUSD
A classic Falling Wedge pattern just broke out on the 30mins timeframe, signaling a potential short-term bullish reversal for #Bitcoin.
🔻 Pattern: Falling Wedge
📍 Support held firm near $116,128
📍 Breakout confirmation above $118,500
🟢 Bullish Confirmation:
A sustained hold above $118.6K could trigger bullish continuation
⚠️ Watching $117.7K as retest zone for dip entries
🔴 Invalidation Zone:
Break below $116.1K invalidates wedge breakout
Next Targets (if breakout holds): $119.3K, $120.2K, $121.5K+ (extension)
🛑 STOPLOSS : $116.1K
BTCUSDT – Charging Ahead in an Ascending Channel, Eyes on 120K!Bitcoin is gliding steadily within a rising channel, consistently printing higher highs and higher lows. After tagging the 120K psychological zone, price made a healthy pullback to key support and bounced back swiftly — reaffirming buyer dominance.
Price action reveals sustained bullish momentum, especially with key U.S. economic data on the horizon. If risk-on sentiment holds, BTC is well-positioned to break past psychological resistance and unlock the next leg higher.
This pullback? It’s not weakness — it’s a setup. And the market is gearing up for another breakout move.

Btc trendThis is only for reference for btc , all horizontal line is self resistance aswll as support. Study going on for this strategy

Bullish In Bitcoin Just My View
We Have to wait for an Confirmation can 5M candle I.e. Hammer or Bullish Engulfing, Marubozo...
Entry @ 119035
Sl @ 118170
Tp 1 @ 122287 ( Must Book 75%)
Tp 2 @ 125000 (With Trailing SL)
Have a Great Day guys

BTC 4 HOUR
Bitcoin is consolidating inside a bullish flag — a classic continuation pattern after a sharp upside rally.
. Observe Volume
Volume should expand on breakout.
Declining volume inside the flag = healthy.
Watch for any sudden spike in buy volume near resistance.
🪙 .Avoid Premature Entries
Don't jump in because it's a “bullish flag” — it must break out.
False breakouts are common; wait for closing candle + volume.
📌 Trade Plan:
Wait for breakout confirmation with volume. No rush—let the chart tell you the story.
🕯️“No setup, no trade. Let price come to you.”

BTCUSDT – Rebounding from Fair Value Zone! Is the Bull Run Back?Bitcoin is building a strong base around the FVG support zone after rejecting the resistance trendline twice in a row. The current price structure is a textbook bullish setup: pullback – retest of liquidity zone – accumulation – and now prepping for a strong breakout.
Fair Value Gaps have been consistently filled and are acting as dynamic support, signaling that buyers are still in full control. RSI remains steady and not overheated – creating perfect conditions for a breakout.
Target: The 125,910 USDT area is the next clear price objective if BTC holds above the 116,082 USDT support zone.
Fundamental Catalyst: The crypto market is regaining strength after BlackRock officially confirmed its plan to expand its crypto ETF products – investor sentiment is back on the bullish side.
BTC ChartBTC Chart "Lorem ipsum" is a placeholder text commonly used in graphic design, publishing, and web development. It is designed to mimic the appearance of real text without actually conveying any meaning. Its purpose is to allow designers to focus on the visual layout and presentation of a document without being distracted by the actual content.

BTC in 15TF...My Strategy...
If you want Ebook... DM me on IG - Trade_With_Shubham2006
📢 Just 99₹ & change your life forever...🧿🎯
$BTC – Bullish Pennant Formation
OKX:BTCUSD
#Bitcoin is currently consolidating inside a bullish pennant after a strong vertical rally from ~$98K to ~$123K 🚀
🔷 This pattern typically signals a continuation move — bulls are taking a breather before the next leg up.
📌 Key Levels:
🔹 Resistance: ~$120K–123K
🔹 Support: ~$116K
🔹 Breakout Target (on confirmation): $130K+
The price is like a spring ready to bounce! A big breakout with volume could send us soaring to new heights!
Don’t front-run it — watch for a clean breakout with strong candles and volume.
Eyes on the breakout! 📈

BTC 4 Hour Chart 🔍 Price Action Insight:
Bitcoin is currently consolidating within a symmetrical triangle on the 4H chart. This structure is forming after a strong bullish leg, indicating a potential continuation pattern.
📈 Breakout Levels to Watch:
Resistance to clear: 119,940 USDT
Immediate support: 117,280 USDT
Key support zones: 116,250 and 115,222 USDT

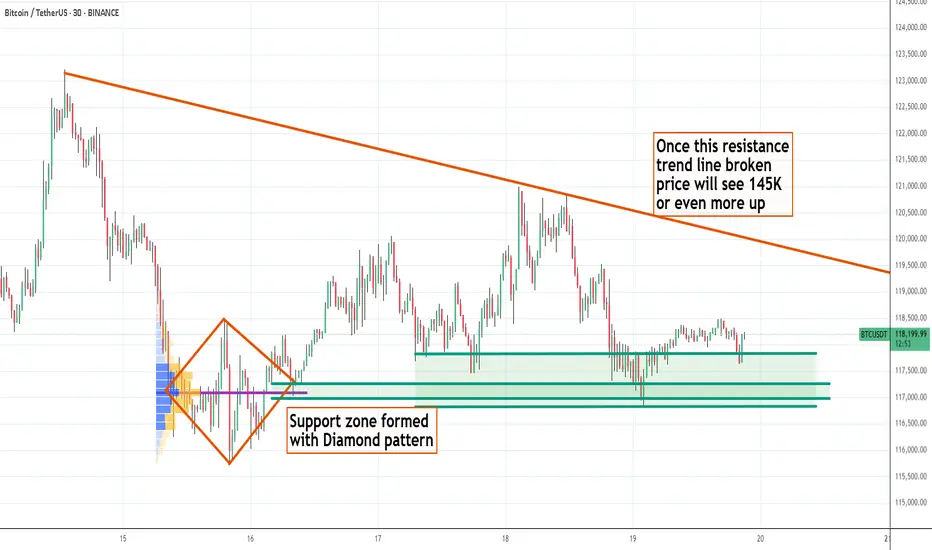
BTC - 19th July - Bullish with sideway correction - Target 145KBTC has been bullish with fundamental reasons - Fiat US $, US Govt Crypto Policy and non stop accumulation by Saylor and ETF, corporates etc ... every week and month new corporates adapting BTC After a good move price is now seeing side way correction and once the newly formed resistance line taken, I strongly expect BTC price to see 145 K easily
BTC AI Prediction Dashboard - 6h Price Path (19.07.25)
Prediction made using Crypticorn AI Prediction Dashboard
Link in bio
BTCUSDT Forecast:
Crypticorn AI Prediction Dashboard Projects 6h Price Path (Forward-Only)
Forecast timestamp: ~14:30 UTC
Timeframe: 15m
Prediction horizon: 6 hours
Model output:
Central estimate (blue line): -118,036
Represents the AI’s best estimate of BTC’s near-term price direction.
80% confidence band (light blue): 117,507 – 118,220
The light blue zone marks the 80% confidence range — the most likely area for price to close
40% confidence band (dark blue): 116,886 – 119,191
The dark blue zone shows the narrower 40% confidence range, where price is expected to stay with higher concentration
Volume on signal bar: 197.06
This chart shows a short-term Bitcoin price forecast using AI-generated confidence zones.
Candlesticks reflect actual BTC/USDT price action in 15-minute intervals.
This helps visualize expected volatility and potential price zones in the short term.
BTCUSDT BTCUSDT has given all time high of 1,23,200$ and now consolidate at 1,19,000 price but as we can see it's forming bearish flag pattern with target of 1,13,900$ , However we also gave CME gap at the same price (1,13,900$). After filling CME gap we can see further upside move towards 1,50,000$.

BTCUSDT – Breakout confirmed, bullish momentum continuesBTCUSDT has officially broken above a long-standing resistance channel, confirming a breakout and establishing a base around the nearest Fair Value Gap. The price action maintains a clear uptrend structure with consecutive higher lows and higher highs, supported by consistent buying pressure after minor pullbacks.
In terms of news, the U.S. decision to temporarily delay stricter regulations on spot Bitcoin ETFs, along with stable interest rate signals from the Fed, has boosted market sentiment. Capital continues to flow into crypto, especially as altcoins show limited recovery, making BTC the preferred asset.
As long as BTCUSDT holds above the nearest support zone, the pair is likely to advance toward the next psychological resistance. Any pullbacks could offer a buy-on-dip opportunity in line with the current trend.

BTCUSDT: Strong Uptrend, Targeting New HighsBTCUSDT is in a very strong uptrend, consistently setting new highs driven by overwhelming buying pressure and green Fair Value Gaps (FVGs).
Currently at $125,144, Bitcoin could reach $134,128 around July 21, 2025. This rally is fueled by ETF approvals, the Halving effect, a favorable macroeconomic environment (safe-haven, inflation hedge), and the expanding crypto ecosystem.
The preferred strategy is to buy on dips or breakout of resistance, always managing risk tightly.

Bitcoin shows bearish Divergence on weekly time frameBitcoin is showing bearish Divergence on weekly time frame along with the resistance drawn from 2018 & 2021 highs. Ignore the moonbois calling 200k-400k. Music is about to stop.
Disclaimer: DYOR, NFA

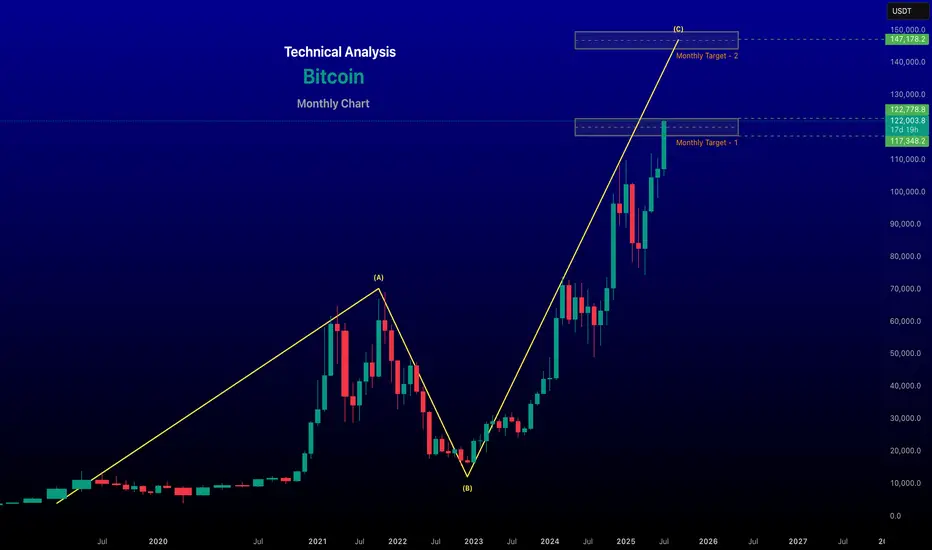
renderwithme | Bitcoin Technical Analysis for August 2025 # Price Trends: Bitcoin is trading above key exponential moving averages (EMAs) on daily charts (20-day: $108,285; 50-day: $105,843; 100-day: $101,952; 200-day: $95,985), signaling sustained bullish momentum.
# Support and Resistance:Support: $110,000–$111,909 is a critical support zone. A drop below could test $105,000 or $101,000.
# Resistance: $125,724–$126,000 is the next hurdle. A breakout above could target $145,000–$150,000
Chart for your reference
~~ Disclaimer --
This analysis is based on recent technical data and market sentiment from web sources. It is for informational \ educational purposes only and not financial advice. Trading involves high risks, and past performance does not guarantee future results. Always conduct your own research or consult a SEBI-registered advisor before trading.
#Boost and comment will be highly appreciated
Weekly Bitcoin (BTCUSDT) Outlook | Altcoin Season on the Horizon✅ BTC Hits a New All-Time High — Now What?
Bitcoin has just printed a new all-time high, which is often a critical time to watch the market closely, especially altcoins. We may be approaching the start of an altcoin party, and this is when attention to the broader crypto market pays off.
📈 Weekly BTC Chart Analysis
Looking at the weekly timeframe, BTC has been trading inside a rising channel. Historically, each time BTC has tested the bottom of the channel, it has rebounded and pushed to form new highs. Currently, we are interacting with the channel's midline, a key decision point.
📌 Several bullish signs are emerging:
RSI is approaching the 70 level, potentially signaling the start of a strong upward momentum.
The SMA cluster is tight and directly beneath the current price candle, which often precedes a sharp move.
That said, this does not mean it's time to jump in impulsively. Instead, we should wait for confirmation on lower timeframes (e.g., 4H or 1H) before entering long positions.
❌ As for short positions — there’s no compelling reason to go short right now. The market remains strongly bullish, and any downward move is more likely to be a temporary correction within an uptrend rather than a reversal.
📉 If price breaks through the midline sharply, keep a close eye on lower timeframes for bullish triggers to go long.
📊 BTC Dominance (BTC.D) Weekly Outlook
Take a look at the chart on the right — this is Bitcoin Dominance (BTC.D). Despite BTC making a new high, dominance has been declining, which is a bullish sign for altcoins.
While BTC.D hasn’t fully broken into a downtrend on the weekly chart just yet, a weekly candle close below 63.3% would confirm a bearish structure on BTC.D, increasing the odds of a strong altcoin rally.
⚠️ Risk Management Reminder
A rapidly moving market often leads to emotional decisions and FOMO-driven behavior. But this is exactly when risk control matters most.
Always follow a well-defined trading plan.
Prepare your strategy before the breakout, not after.
Position sizing and risk allocation must be deliberate — the brain reacts slower when price action gets wild.
🚀 Final Thought
This week’s setup is promising — Bitcoin is in price discovery, and altcoins are gaining momentum. With BTC.D potentially breaking down, a strong altcoin season could be forming.
Don’t rush in — let the charts confirm your setups on lower timeframes and stay disciplined.
#Bitcoin #BTCUSDT #BTCdominance #CryptoAnalysis #WeeklyCryptoOutlook #Altseason #AltcoinRally #PriceDiscovery #CryptoStrategy #TechnicalAnalysis #RiskManagement #FOMOControl
