2025 first semster - btc crypto revieww Finally, we made some progress in the past few hours.
I understand that BTC is getting lazy, or it's getting old, points of view, but it's evident that it takes a move and pursues it for a month.
June was pretty sidewards
May was upwards
April goes up too
March was consolidating
February goes down
January bubbled
The first semester of 2025 was highly significant for the cryptocurrencies in general. The positive and declared interest of big institutions and governments consolidated the basis of the market. At the same time, explosion is always a double weapon, for instance, the big bubble in January and the February drawdown were linked with the US past election and fee wars.
This was sustained by the decline in markets such as SP500, US30, EURONEXT, and NEKKEI, after the US and Chinese declaration about the import-export fees that had increased the popular interest in crypto. Mostly due to a high level of volatility in the traditional markets, which had a strengthened role of crypto as an alternative.
Here is a quick update about the last analysis of BTC, to be considered with the TOTAL crypto market cap :
TOTAL recovered an inefficiency of 3 - 2.8T --> left behind since May, normalizing the volume and price.
BTC reached 108K --> fulfilling the demand and last orders, as shown on the liquidation heatmap. Double top, strong body, Fibonacci levels perfectly respected till the price entered again in the range zone.
Sidewarding for a week. A lateral phase may indicate a consolidating phase for the price and a balanced power between sellers and buyers.
The pattern is similar to what it was at the end of May. The last 108k liquidated several orders. The retail/institutional ratio increased, returning to the April levels.
The last weekend was the most significant for the coin. The fast decrease confirms the last spikes as liquidity and volume recovers. The price dropped and reached a last level of inefficiency.
The range brokerage at 101800, kept since May, and strong overpassing of the psycho level of 100K, confirmed the drawdown.
98600 --> Inefficiency recover from begin of the May spike. Strong reaction at the level, double confirmed the drawdown theory.
The volume, liquidation maps, and institution vs retail ratio, show a decline in the price linked with an increase in shorts, mostly from retails. Simultaneously, the rise in nr of accounts holding more than 1K bitcoin, the Fear & Greed index, and the ETF increase, shows a next positive scenario for bitcoin.
This drawdown was essential to allow a growth over 108-111K. The last zone I will keep an eye on is 92-93K.
92K --> strong support and POI. It will end the cup shape and restore the price before the May leg up, but retracing on a monthly time frame since it would coincide with 0.5 monthly.
This would happen after a recovery to the range, 102-105K.
Thanks,
M
Trade ideas

Weekly Long Setup | June 23rd 2025 | Valid Until Weekly ClosePrice is retracing to a strong pivot zone (marked by the red box).
Structure remains bullish with potential for continuation after pullback.
The green box represents a high-probability long opportunity with tight risk control.
Watch for price reaction within the red zone. Entry only if confirmation (e.g., bullish engulfing, strong wick rejections) appears.
The setup expires at end of the weekly candle close.

BTCUSD LONG 9-11 June. checking and validating for every single basic price actions and other moves. it is my prediction for the BTC/USDT, to go up will 110k-111k within 9-11 july.

Weekly Short Setup | Valid Until Weekly CloseI have been in this trade for sometime now with first TP taken. Due to uncertainty globally, I am not posting any intraday charts.
Stay safe, save capital is the motto right now.
Note:
This is an weekly setup and idea that expires at Weekly Candle Close. Re-evaluate the setup if price remains indecisive near the entry zone close to that time.
$BTC Technical Breakdown – As Predicted!CRYPTOCAP:BTC Technical Breakdown – As Predicted!
I already warned you at $110K to exit or short — and guess what?
We’re now up with 8% profit from that exact call!
#Bitcoin broke structure with a Bearish Divergence, and the trendline is looking weak.
If this war doesn’t stop, I expect further downside below $100K.
Key levels to watch:
🔻 Support 1: $73,500
🔻 Support 2: $48,700
If $100K breaks, don’t be surprised to see $90K → $80K → even $70K.
Don’t say I didn’t alert you.
I clearly told you to short or exit at the top.
Booked profits? Let me know below 👇

btc long zone in 4hr time frameI have clearly mentioned the initial of supply & Demand in resepective Universal colour Arrow in 4hr time frame supported by 1 Day closing on previous High

BTC goes wild. But there’s worse. With PipGuard.“BTC goes wild. But there’s worse. With PipGuard.”
Hola, hi my friends! How are you doing? Hope you're doing amaziiiing!
Today we’re having a little chat about Bitcoin, shall we?
I admit it: this time I messed up and took the USDT spot chart instead of USD… but heeey, I’m lazy and it doesn’t really matter. What counts is the trend, RIIIGHT?
But first… boost me and drop a comment <3
📈 The trend is your friend... until it messes with you
🔼 If it goes up, it goes up
BTC is still in a strong bullish trend long term.
Nothing new? Maybe, but if it keeps going… it’s aiming for new highs. Simple.
And if not today, then tomorrow. Your loss if you miss it.
🧠 Always keep one eye on assumptions and the other on objectivity. The market will thank you.
🔽 If it drops... better be ready
And if it decides to go down?
Here come the targets: 102k , 100k , and that delicious 94k I’d love to see.
Why? Because even crypto needs a break.
And each level is potentially a reversal point , you know that already, right?
🧱 Supports, resistances... and your debts
• Resistance: 109k (rounded like those 100€ you still owe me haha)
• Serious support: 78k
• Cuddly support: 88k
• The rest is noise.
• Trend still strong, yes. But if you’re not watching… someone else will watch your wallet.
🔥 The market today? On fire, as always
• BTC did its usual trick: touched 106k , then dropped below 103k
• Liquidations? BOOM 💣: over 450 million dollars in longs
• The market shook like a noob on their first short
🌍 War, hacks, and chaos: BTC loves it
• Israelis flying around Iran bombing targets
• Iranians firing back missiles
• Israeli hackers broke into Nobitex and BURNED 90M in crypto
• The White House is silent, but the US has a “Bitcoin Reserve”
• Result? BTC pumps, dumps, pumps again… you tell me
🐍 Juicy GOSSIP
• In New York, two crypto bros kidnapped an Italian guy from Rivoli and tortured him for 17 days to get his wallet password
• Electroshock. Power saw. “Wild” sessions with madams & friends
• All this between parties, bondage, and wheelchairs
• The guy, alive by miracle, is now the new symbol of “ never give your key to anyone ”
📊 Technical Recap
🧱 Resistance: 109k
🪨 Supports: 88k / 78k
💣 Liquidations: +450M long
📉 Price Range: 106k ➝ below 103k
🌍 Geopolitics: Real bombs & BTC
😈 Gossip: Crypto-bros under pressure 😱
😂 The curtain drops…
My fingers hurt. And not just from typing… oops, I said it? I did.
If you had fun, boost and comment .
If not… next time I’ll give you support at 69k, that’ll teach you.
A hug from your loyal lunatic, PipGuard 🤣🧨
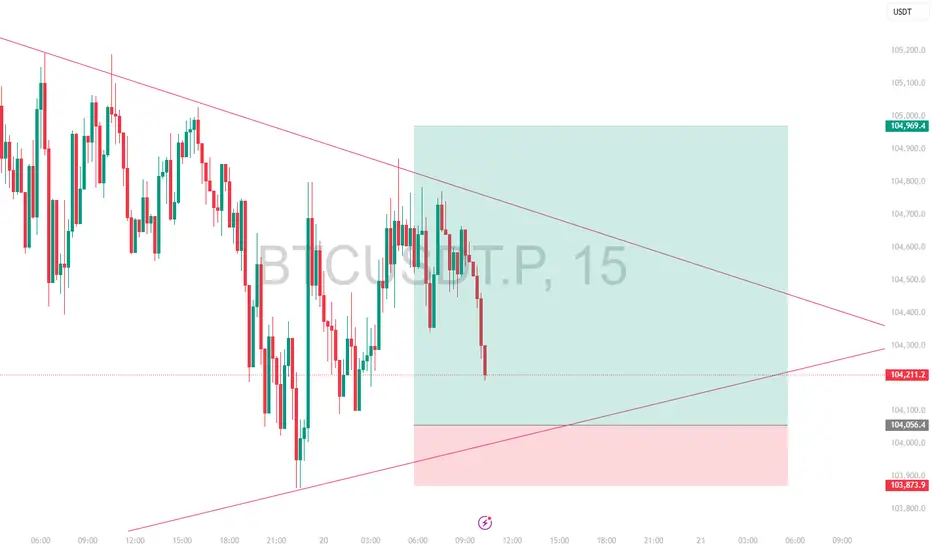
Intraday Long Setup | June 20th 2025 | Valid Until Daily ClosePrice retraced to a strong pivot zone.
Structure remains bullish with potential for continuation after pullback.
Tight risk control.
Watch for price reaction within the red zone. Entry only if confirmation appears
The setup expires at end of the daily candle close.
BTCUSDT – Holding Support, Bullish Signs EmergingBitcoin remains within a descending channel but continues to defend the strong support area around 101,296 USDT — a level that previously triggered a sharp rebound. On the H4 timeframe, price is consolidating sideways, forming an accumulation range. If this support holds, a bounce toward the 105,356 USDT zone is likely.
As of June 19, Binance holds 41% of global BTC trading market share, providing deep liquidity and tight spreads. This market condition favors a potential short-term recovery in BTC.
A breakout above the key resistance zone at 105,000–106,000 USDT could open the door for a broader upside continuation.

Will Bitcoin Hit $80k Before $171,000 ?Bitcoin is Forming a Inverse Head & Shoulders on the 2D chart...
And if this plays out — we could be looking at a move to $171,000
Here’s what you need to know:
Structure Breakdown:
▪️ Left Shoulder: Completed
▪️ Head: Completed
▪️ Right Shoulder: (in progress)
Neckline: ~$112.5K-$115k
Breakout above neckline = $171K target
That’s a +49% upside move from here.
But here’s the catch...
When too many spot the same pattern — whales love to trap.
Fakeouts, stop hunts, liquidations — you’ve seen it before.
❌ If BTC drops below $100K (Right Shoulder base), this setup flips bearish fast.
Key Support Zones:
▪️ $93,940 (Fib 0.382)
▪️ $80,780 (Fib 0.786)
Trade with confirmation, not emotion.
Respect your invalidation levels and protect capital.
What’s your play if we tap $112K? 👇
NFA & DYOR

BTC on 2H TF.....Short Opportunity on BTC...📉
Wait for Breakdown but candle closing is much important...
This is for educational purposes!
Do on your own Risk!

BTC is going to hit back to 101400 u can see that its been two days no big move and that's a big sign for big move and its risky to choose a side but from this chart i can see its going deeper down , its not advice but u should pay attention to what's going on that chart its super easy to predict that its going down but its not sure so just watch and don't engage and enjoy the show if it goes my way ofc ...

BTCUSDT – Selling Pressure is IncreasingThe price is retesting a strong resistance zone around 110,464 USDT, where heavy selling pressure previously emerged.
The likely scenario is that the price forms a Lower High pattern and then breaks the uptrend line → confirming a bearish trend.
Potential support area: 101,236 USDT, where price previously reacted.
Strategy:
Priority is to wait for sell opportunities around the 110,000–110,500 zone if a clear reversal signal appears.
Target at 101,200 USDT. Stop-loss placed above the resistance zone at 111,700 USDT.
News Supporting the Bearish Outlook:
The SEC has delayed approval of the spot Ethereum ETF, triggering negative sentiment in the crypto market.
Capital is flowing out of the market due to expectations that the Fed will maintain high interest rates for a longer period.

BTC MAYBE GO SELL IN 15 M MAPPING MARKET BREAK THE 15 M LH and also doing 1 hour liquidity sweep and there are also 15m sell zone so we are planning to sell btc...

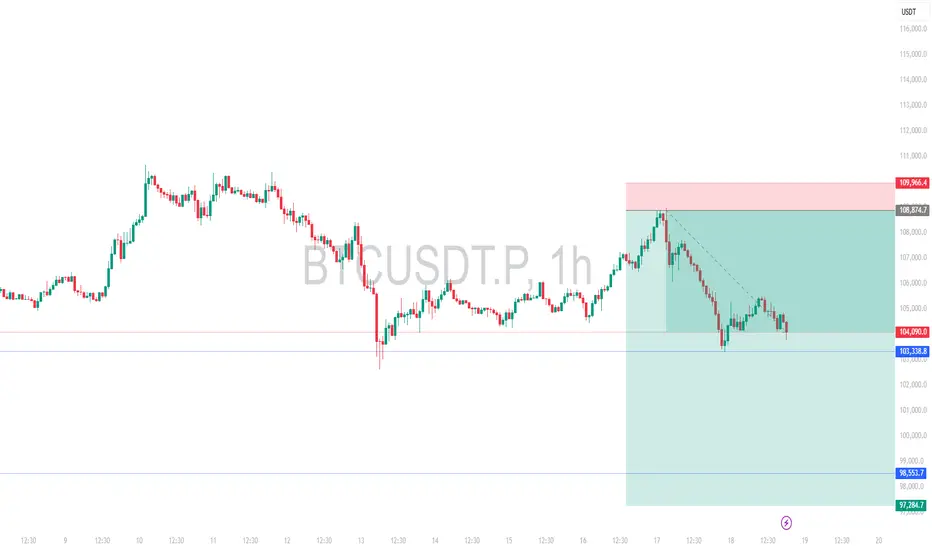
[SeoVereign] Bitcoin Bearish Outlook – June 17, 2025We are the SeoVereign Trading Team.
With sharp insight and precise analysis, we regularly share trading ideas on Bitcoin and other major assets—always guided by structure, sentiment, and momentum.
🔔 Follow us to never miss a market update.
🚀 Boosts provide strong motivation and drive to the SeoVereign team.
--------------------------------------------------------------------------------------------------------
Hello,
This is SeoVereign, approaching technical analysis not as a result but as a prediction, with a realistic perspective.
I am presenting a bearish view on Bitcoin as of June 17, 2025.
First, based on the fact that a downtrend appeared near the 0.786 level of the overall Fibonacci retracement, I believe strong downward pressure is forming, and thus I am outlining this bearish perspective.
This 0.786 level corresponds to around the 109,000 price range. On the chart, the 109,000–110,600 range is a very strong supply zone where support and resistance have repeatedly been confirmed.
Next, from a wave counting perspective, the 1.272 trend-based Fibonacci extension lies in a similar area as the 0.786 retracement level, which further reinforces my conviction in this view.
After successfully predicting the downward movement from the 11th, I have been continuously counting the recent upward wave, and the wave structure on the chart appears to align naturally, as I see it.
In addition, from a harmonic perspective, the Alt Bat pattern is functioning effectively, and since the movement has been captured within the pre-set X–1.13 range, the confirmation of this pattern can also be considered successful.
The first target is currently set around the 105,700 level.
I will continue to monitor the market closely, and once this idea progresses to a certain point, I will share more specific evidence and the thought process behind the bearish entry through an additional update.
Thank you.

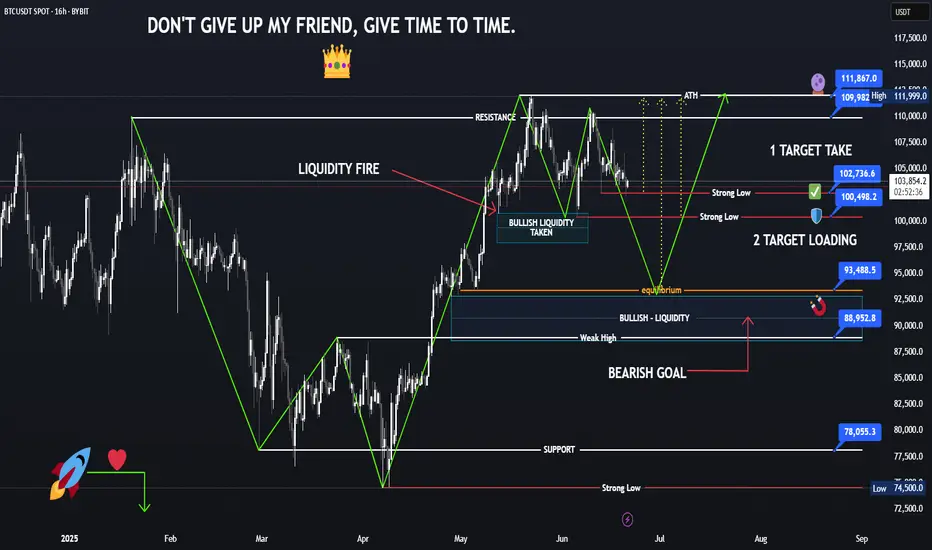
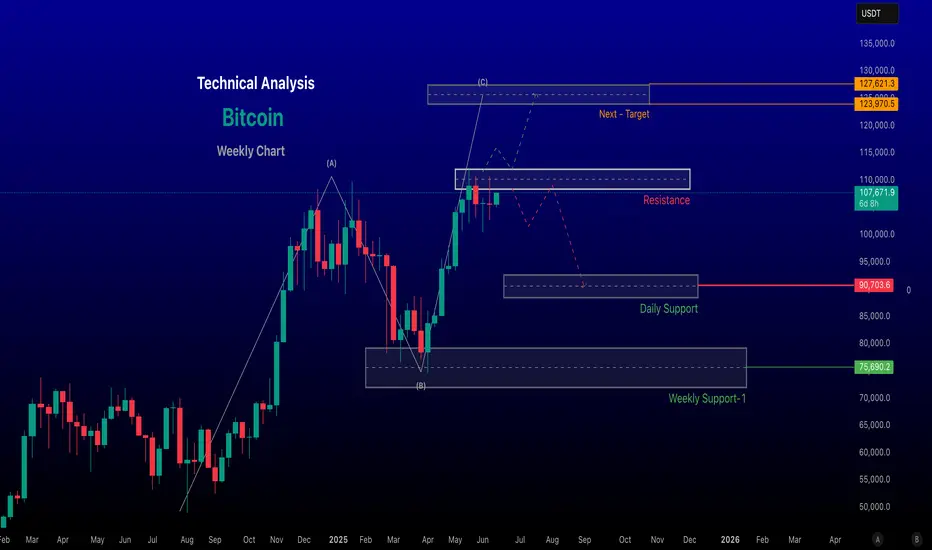
Bitcoin (BTC) Technical Analysis for the Week of Jue 16 -June 22~~ Technical Analysis ~~
-- Trend:
Short-Term: Bitcoin has broken the floor of a rising trend channel, suggesting a slower rise or potential sideways movement.
Medium/Long-Term: Despite the short-term slowdown, the long-term trend remains bullish, with Bitcoin testing resistance at ~$106,000–$110,000. A breakout above $111,000 could signal strong upward momentum.
Bearish Signals: Negative volume balance (higher volume on down days) and RSI divergence indicate potential for a short-term correction.
Key Levels:
Support: $102,400, $90,000
Resistance: $106,000–$110,000, with a critical zone at $110,000–$111,800. Breaking this could push BTC toward $125,000–$155,000.
-- Disclaimer --
This analysis is based on recent technical data and market sentiment from web sources. It is for informational purposes only and not financial advice. Trading involves high risks, and past performance does not guarantee future results. Always conduct your own research or consult a SEBI-registered advisor before trading.
#Boost and comment will be highly appreciated
BTC/USDT 4H Analysis – Bullish Cup Formation 📈 BTC/USDT 4H Analysis – Bullish Cup Formation ☕🚀
🔍 Chart Overview:
The 4-hour chart of Bitcoin against USDT on Binance displays a clear "Cup" pattern, suggesting a strong bullish continuation setup. The price action reflects a rounded bottom forming after hitting a solid support zone.
🟣 Key Zones:
🔻 Support Zone: ~$101,000–$103,000
Strong buying interest was observed here with a sharp wick rejection, forming the bottom of the cup.
🔺 Resistance Zone: ~$110,000–$112,000
This area has acted as a historical rejection zone and now stands as the next major target for bulls.
📊 Technical Insights:
The price is gradually curving upward, respecting the rounded cup pattern, often a precursor to a breakout.
A clean break above the resistance zone may trigger continuation toward new highs, possibly above $112,000.
The price is currently at ~$107,700 and gaining momentum with higher lows forming consistently.
🎯 Price Projection:
📌 Target: $111,500–$112,000
📉 Invalidation: Break below the $103,000 support
💡 Conclusion:
If the bullish momentum continues and breaks past resistance, we can expect a powerful upside breakout. Traders should watch for volume confirmation near the resistance zone for potential entry or breakout trades.
📍Pattern in Play: Cup Formation
⚠️Watch for pullbacks before breakout attempts.

LEST GRAB LONG BTC TO SEE WHERE IS THE NEXT BIG MOVE WILL BE lest grab BTC long for know till we have clear idea to which side gonna be the big move these days

break of instruction it broke the previse BOS and it needs to grab liquidity from 110300 to either push up more or to fall all the way back to 106 ..

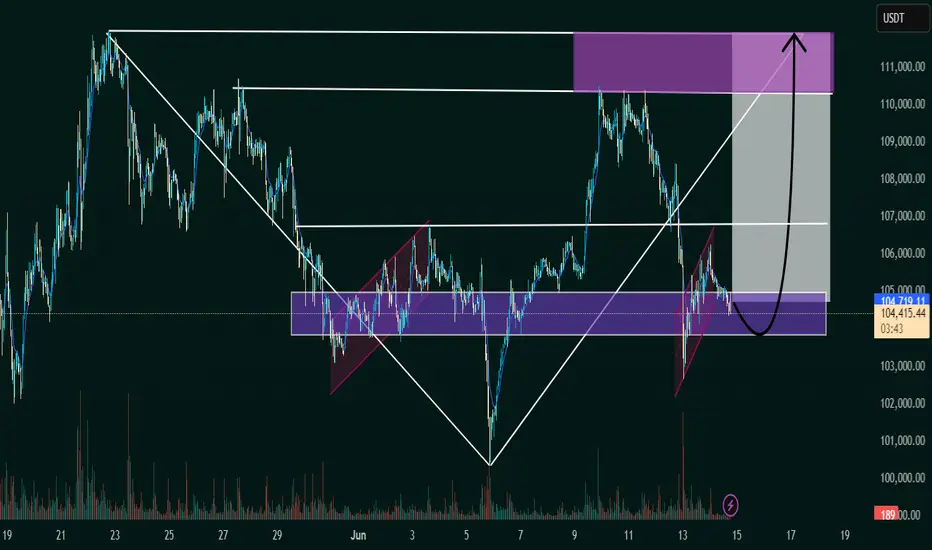
BTC/USDT Bullish Reversal Zone AnalysisSupport Zone:
The horizontal purple box (~104,000 USDT area) has acted as a strong support/resistance flip zone multiple times.
Falling Wedge Breakout:
The price action broke out of a falling wedge pattern earlier, confirming bullish momentum.
Flag Formation (Current):
A smaller bullish flag/pennant appears to be forming, and a breakout above could trigger a strong upward move.
Projected Move:
The black arrow indicates a potential bounce from this support zone, with the price targeting the 111,000–112,000 USDT zone (highlighted in the top purple box).
Volume Spike:
Notable volume spike near the bottom supports the idea of accumulation and possible reversal.
📈 Conclusion:
If the support zone holds and price breaks above the minor flag, a bullish continuation is likely toward the 111,000–112,000 resistance area. Traders should watch for confirmation of a breakout and volume increase for validation.
$BTCUSDT quick short setup. OPENED CRYPTOCAP:BTC Short
Stop Loss : High $106300
Target : $104k
$102.5k

BTCUSDT – Rebound from 104,200, recovery opportunity emergingBTCUSDT has bounced back from the 104,200 support zone with a potential double bottom pattern, signaling the return of buying pressure. The price is consolidating around the 106,000–107,000 area. If this zone holds, the probability of retesting the previous high at 110,500 is high.
The EMA34 and EMA89 are narrowing – a sign of weakening selling pressure.
Supporting news:
The Fed kept interest rates unchanged, U.S. CPI slightly declined, and capital inflows from ETFs like BlackRock are returning to the market, creating momentum for recovery.

BITCOIN Short Position Update – June 11, 2025We are the SeoVereign Trading Team.
With sharp insight and precise analysis, we regularly share trading ideas on Bitcoin and other major assets—always guided by structure, sentiment, and momentum.
🔔 Follow us to never miss a market update.
🚀 Boosts provide strong motivation and drive to the SeoVereign team.
--------------------------------------------------------------------------------------------------------
Bitcoin downside perspective shared.
Currently, Bitcoin appears to have entered an overheated zone based on both Elliott Wave Theory and harmonic pattern analysis.
While it has been continuously setting new highs alongside Ethereum, the technical structure suggests the possibility of a short-term pause.
Accordingly, a bearish idea is shared.
The first target is set at 108,600.
More detailed ratio analysis and additional reasoning will be shared through an idea update once the first target is reached.
Flexible response according to market conditions is necessary.
