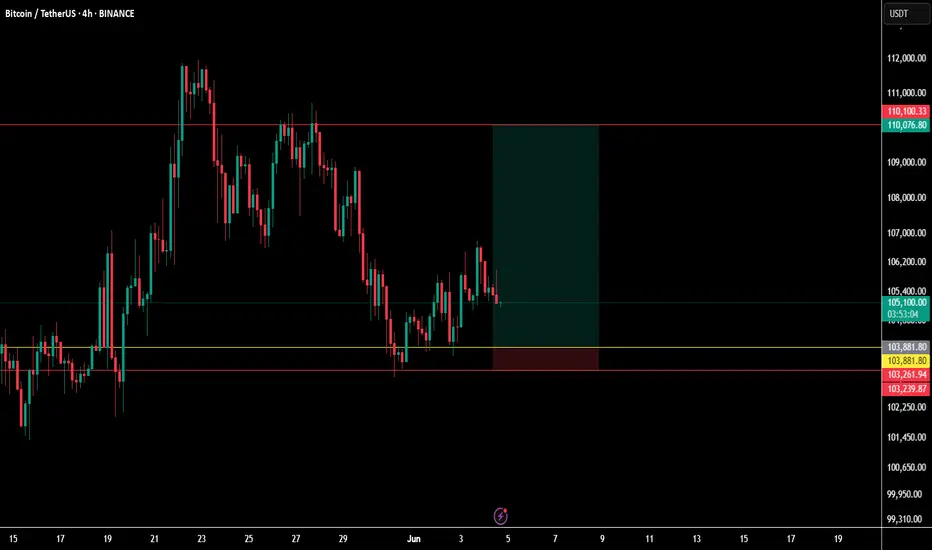
BTC Just Chose Its Side - The Silent Confirmation....The structure has shifted.
Price didn’t shout — it whispered.
It crossed the threshold silently… a confirmation only visible to those who understand structure without indicators, without noise.
This isn't a pump.
It's alignment.
The mark I’ve drawn is not support — it’s the echo of decision.
A place where buyers proved their intent without needing volume to scream.
Now, above that line — the bias is bullish.
Not because of emotion, not because of hope —
but because price has shown commitment.
If it returns and breaks beneath that origin point...
the bullish script vanishes.
The structure flips — cold, clean, without apology.
This is not a prediction.
This is structure unfolding.
And I’m not reacting.
I’m witnessing what I already knew.
BTC is playing a script.
And Leviathan saw the outline long before the market made its first move.
#LeviathanFX #StructureSpeaks #MarketWhispers #PriceKnowsFirst #ScriptedMoves #LiquidityLogic #TradingProphecy #SilentConfirmation #DecodeTheMarket #TheChartNeverLies #BTCUSD #BitcoinTA #SmartMoneyConcepts #MarketStructure #PriceActionTrader #4HChart #SupplyAndDemandZones #TechnicalFlow #OrderFlowMindset #HighProbabilitySetups
Trade ideas

BTCUSDT | Weekly Analysis June 9-13 2025Hi,
I am sharing my view on BTC further upside movement if sustatined above 107391 then next will be 109501 and 111429.
Disclaimer: This is only for educational purpose.
Thanks

BTC Daily Bias – Bearish – 8 June 2025 (Target: 106000)🧠 Market Overview:
Today’s bias on Bitcoin (BTC) is Bullish. I’m expecting a move towards the previous day's High at 106000, targeting liquidity beneath that level.
🎯 Trade Setup Plan:
– Entry: After liquidity grab / SMC confirmation near
– SL: Above recent swing Low
– TP: 100305 and possibly lower if momentum continues
📌 Notes:
This analysis is part of my daily bias posting. Use it as an educational reference only. Always manage risk properly.
Posted by Vicky | Trading Pulse
📺 YouTube: Trading Pulse

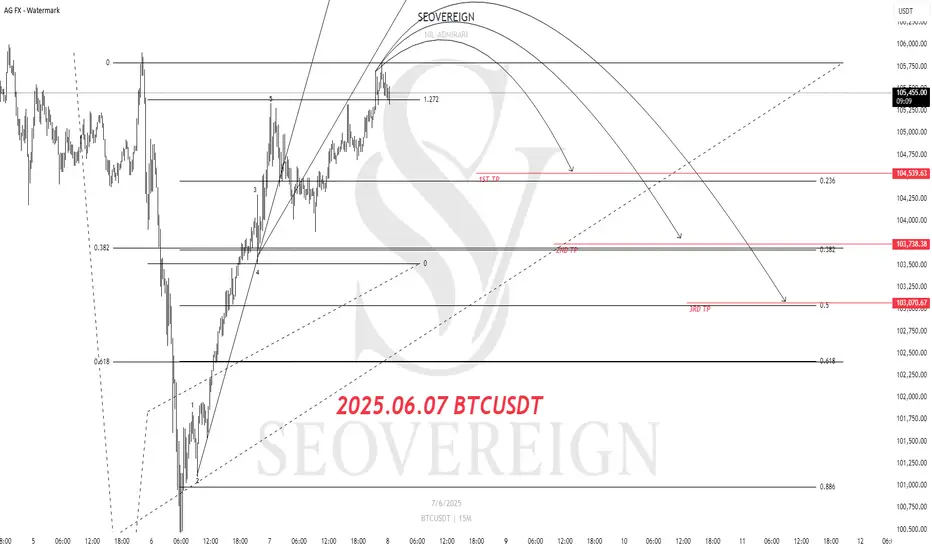
Bitcoin Short Position Update – June 7, 2025We are the SeoVereign Trading Team.
With sharp insight and precise analysis, we regularly share trading ideas on Bitcoin and other major assets—always guided by structure, sentiment, and momentum.
🔔 Follow us to never miss a market update.
--------------------------------------------------------------------------------------------------------
Bitcoin Analysis
After a prolonged downtrend, Bitcoin is attempting a temporary rebound in the form of a dead cat bounce. This current upward move appears to be more of a technical rebound within the broader downtrend rather than a strong trend reversal.
From an Elliott Wave structure perspective, the current rebound is being captured as an impulsive wave, which suggests it could either be the final leg of a 5-wave move or the movement just before a corrective phase begins. Based on this view, I am considering entering a short position by targeting the point at which the upward momentum starts to exhaust.
Wave Ratio:
The length of the current 5th wave is approaching 1.618 times the length of the 1st wave, a ratio often observed in overextended wave patterns.
Target Price:
The initial target is set at 104,500, which coincides with the retracement zone of the previous decline and the prior support level.
The current area is considered favorable for a short entry in terms of risk-reward ratio. However, it is crucial to confirm whether the upward wave has truly concluded.
With overbought signals from oscillators and the appearance of a trend-reversal candlestick pattern, a short entry can be considered upon confirmation.
BTC Breaks Downtrend – Eyes on 105911📊 Cycle Status:
🔼 HWC: Bullish
🔽 MWC: Bearish
🔼 LWC: Bullish
Because of this cycle configuration, I’m not looking for short positions. The larger structure still favors bullish momentum.
📈 Structure & Channel Breakout:
BTC broke out from a descending channel with 6 confirmed touches. On the 7th touch, we saw a breakout.
You might ask: "Parsa, what’s the use of a broken channel now?"
Well, here’s why it still matters:
The channel hasn't had a proper pullback yet.
Price might reject from the 10,5911 resistance, which is a strong level.
If rejected, price could revisit the channel’s upper boundary as a retest.
That retest could create a strong R setup on the 15m chart — if we get a clear structure and confirmation.
🧠 Important Notes:
If BTC breaks and holds above 10,5911, this could flip our MWC to bullish, which would be a strong continuation signal.
Until then, I’m waiting and watching for either:
Retest of the broken channel
Clean break and hold above 10,5911
🎯 Targets:
If price holds above current levels, next resistances are:
✅ 108890
✅ 110490
As long as BTC stays above 103880, I won’t be talking about short setups.
📌 Got a coin in mind? Drop it in the comments and I’ll analyze it for you.
⚠️ Without proper risk management, you're just a ticking time bomb.

BTC: Saturday Range Play - Targeting PDH Liquidity & Downside CoGood morning/afternoon, traders!
My daily bias for Bitcoin today (Saturday) is cautiously bearish, anticipating a potential range-bound day with a downside lean.
Here's the rationale:
Weekend Dynamics: With lower trading volume typically seen on Saturdays, I expect a relatively tighter daily range (1.5-2%).
PDH Liquidity Grab: My primary scenario involves BTC potentially making a move towards the Previous Day's High (PDH) to sweep liquidity.
Downside Confluence: After interacting with PDH (either a liquidity sweep or a clear rejection from a reactive area near PDH), I'll be looking for bearish confirmations on lower timeframes to plan entries for a move to the downside.
Key Levels to Watch:
Previous Day's High (PDH): 105283
Previous Day's Low (PDL): 101003
My Plan:
I'll be patiently waiting for price action around the PDH. A strong rejection, market structure shift on lower timeframes, or confirmation from a supply zone will signal potential short opportunities, targeting the day's lower range.
Invalidation: A strong, sustained break and close above PDH without any bearish follow-through would challenge this bias.
Remember to always practice sound risk management.
This is my personal analysis and not financial advice. Do your own research.
ALERT: BTC TRAPPING SELLERSBTC can trap sellers before going to original sell. Here psychology is more important.Trail after entry to ctc let it run huge.
sell 1:105600
sell 2:107000
BUY 1:107400

BTC Daily Bias – Bearish – 6 June 2025 (Target: 100305)🧠 Market Overview:
Today’s bias on Bitcoin (BTC) is bearish. I’m expecting a move towards the previous day's low at 100305, targeting liquidity beneath that level.
🎯 Trade Setup Plan:
– Entry: After liquidity grab / SMC confirmation near 103000
– SL: Above recent swing high
– TP: 100305 and possibly lower if momentum continues
📌 Notes:
This analysis is part of my daily bias posting. Use it as an educational reference only. Always manage risk properly.
Posted by Vicky | Trading Pulse
📺 YouTube: Trading Pulse

Bitcoin Bulls vs Bears — Battle Zones Mapped Out#Bitcoin Bulls vs Bears — Battle Zones Mapped Out
🔰 $105K–$106.7K = Bearish Order Block:
Below this zone = CRYPTOCAP:BTC stays bearish unless HTF closes above $106.7K
🔰 Next Moves:
▪️ Likely retest $105K–$106K before next leg ↓
▪️ Target: $97K–$95K zone
🔰 Key Levels:
✅ Holding 0.618 Fib (support)
✅ Unfilled FVG: $97K–$98.3K
✅ Bullish OBs: $95.7K–$97K | $93.5K–$94.7K
If $97,000 holds strong → Expect BIG bounce!

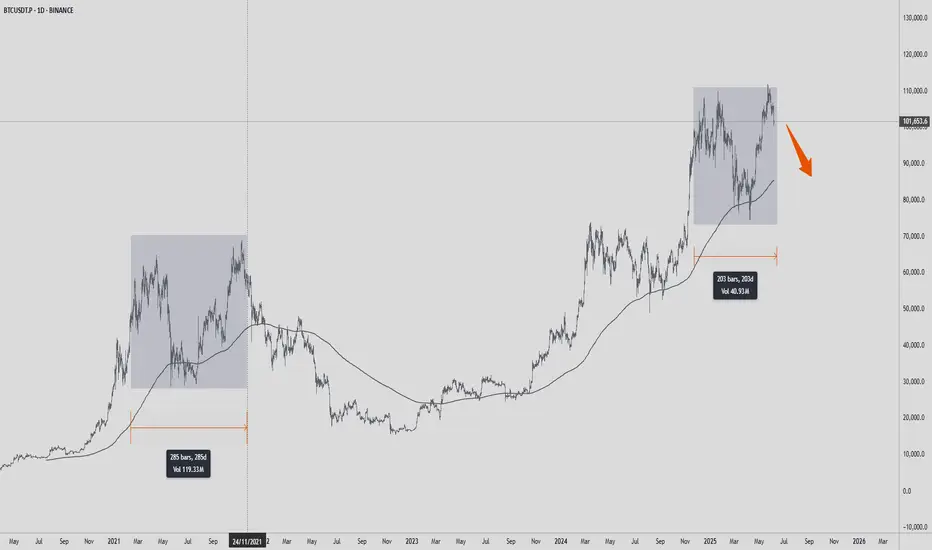
BTC Market Update: Signs of a 2021 Replay?📉 BTC Market Update: Signs of a 2021 Replay?
Looking at the chart, BTC is showing a price structure quite similar to late 2021—right after reaching its ATH around 69k before a major downturn.
🔁 If history repeats itself, the upcoming market conditions could turn bearish.
Currently, price has retested the moving average zone and is beginning to show a negative reaction.
⏳ This is a phase where traders should remain cautious—avoid FOMO, stay calm, and wait for clear confirmation signals.
📲 I’ll continue to post updates as soon as stronger signals emerge.
BTC Breakdown or Bounce? Key Levels You Need to Watch!BTC Breakdown or Bounce? Key Levels You Need to Watch!
#Bitcoin 4H Chart Analysis – SMC Overview:
BTC is currently in a short-term downtrend, respecting a descending channel and showing clear bearish structure.
🔴 Bearish Signs:
Price rejected from 2 major Bearish Order Blocks:
▶️ $106K–$104K
▶️ $111K–$109K
Breaks of Structure (BOS) and Change of Character (CHoCH) confirm trend shift to bearish Couldn’t hold the 0.382 Fibonacci level at $104.4K — now testing the 0.5 Fib at $102.2K
🟢 Key Support Zones (Potential Reversal Areas):
1️⃣ $100K Zone
✔️ 0.618 Fib level
✔️ Unfilled Fair Value Gap (FVG)
🔍 Possible bullish reaction from here
2️⃣ $97K Zone
✔️ 0.786 Fib
✔️ Bullish Order Block (OB)
✔️ Another FVG
💥 Strong confluence — good probability of reversal
3️⃣ $93K Zone
✔️ Deep Bullish OB
🛡️ Last strong support if $97K fails
🔼 If bulls reclaim control: We need a clear CHoCH above $104.5K to confirm bullish shift
⚠️ Tip: Mark these zones. Use alerts. Let the price come to you — don’t force trades.
📢 Share if useful & stay updated
Bitcoin (BTC/USDT) 2-hour chart, focused on the buy side only!📊 Chart Overview
The chart shows BTC/USDT on the 2-hour timeframe, featuring clear levels of resistance, mini-resistance, and target zones. Let’s break down the buy idea:
🚀 Key Zones & Levels
💜 Resistance Zone (Purple Box):
Historical price ceiling.
Price dropped from this area several times.
🟦 Target Zone (Blue Line):
106,691 - 106,683 USDT.
Target for the next bullish move!
🟧 Mini Resistance (Yellow Box):
Around 102,000 USDT.
Acting as support (buy zone!) now.
💰 Buy Setup & Entry Area
✅ Buy Zone:
Just below 103,000 USDT, aligning with the mini resistance / support box (yellow).
✅ Entry Level:
Between 102,000 - 103,000 USDT.
Best if price consolidates or forms a reversal candle here.
🟢 Target:
First target: 106,000 USDT
Next major target: 106,683 - 106,691 USDT.
📉 Stop Loss:
Below 101,000 USDT for protection.
🎯 Trading Plan
1️⃣ Wait for a bullish reversal candlestick at the mini resistance box (~102,000 - 103,000 USDT).
2️⃣ Enter long (buy) position.
3️⃣ Target profit at 106,000 and 106,691 USDT.
4️⃣ Stop below 101,000 to manage risk.
⚡️ Summary
🟢 Buy: At mini resistance (~102,000 - 103,000).
🎯 Targets: 106,000 - 106,691.
❌ Stop: 101,000.
🚀 Let's ride the bullish wave! 💹📈🟢

Bitcoin Long Setup – Chart Analysis (June 5, 2025)We are the SeoVereign Trading Team.
With sharp insight and precise analysis, we regularly share trading ideas on Bitcoin and other major assets—always guided by structure, sentiment, and momentum.
🔔 Follow us to never miss a market update.
--------------------------------------------------------------------------------------------------------
Bitcoin technical analysis is presented as follows.
The current wave structure, based on Elliott Wave Theory, appears to be in the final stage of the corrective pattern, specifically in WAVE Y. Notably, WAVE Y has extended to 1.618 times the length of WAVE W, which suggests a potential completion of a typical WXY corrective pattern. This can be interpreted as a strong reversal signal.
In addition, the 1.414 Butterfly pattern, one of the harmonic patterns I have been monitoring, has also completed in the same zone. As Butterfly patterns often indicate high reversal probability between the 1.272 and 1.618 levels, the precise formation at the 1.414 ratio adds further technical confirmation and reliability to this signal.
In summary, the convergence of these two technical factors strongly supports a bullish bias at the current level and increases confidence in a potential short-term price rise for Bitcoin. Therefore, this zone is considered a strategic point for entering a long position.

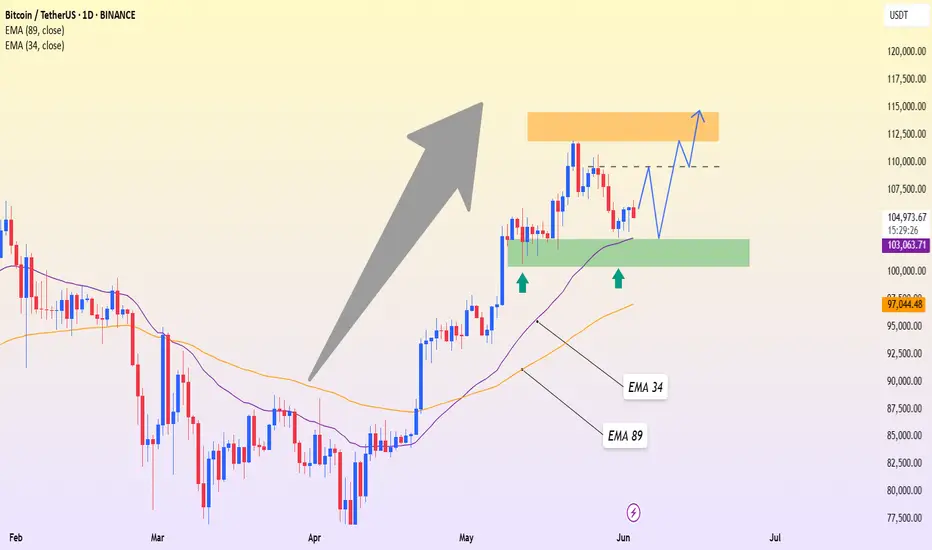
BTCUSDT – Squeezed enough, ready to explode?Bitcoin is currently trading within a converging triangle pattern – a setup every trader knows often signals an imminent breakout. The price is sitting between the EMA 34 and EMA 89, consolidating right above the long-term ascending trendline, indicating that buying pressure is still quietly in control.
The 105,000 – 106,000 USDT area is the key resistance zone to watch. If BTC breaks through this level decisively, it could trigger a new bullish wave aiming for 110,000+.
On the news front, market sentiment has turned optimistic again after the SEC Chairman hinted at the possibility of approving more Bitcoin ETFs in the upcoming quarter. This has given a strong psychological boost to the buying side.

Bitcoin (BTC) Technical Analysis for the Week of Jue 02 -June 09Technical Analysis
Price Action: Bitcoin is consolidating around $105,000–$108,000 after a sharp rally from April lows (~$74,000) and a peak near $112,000. A recent 3% correction was driven by profit-taking, with BTC stabilising near $106,000.
Trend: Medium-term trend remains bullish, but momentum is slowing. BTC has broken the previous resistance , indicating a potential slower rise or horizontal movement.
Note : Indicator MACD making bearish diversions in my view its not strong .
Key Levels:
Support: ~$102,600–$103,500 (recently tested)
Resistance: ~$106,000 (current resistance) and $110,500–$123,000 (next major target).
-- Disclaimer --
This analysis is based on recent technical data and market sentiment from web sources. It is for informational purposes only and not financial advice. Trading involves high risks, and past performance does not guarantee future results. Always conduct your own research or consult a SEBI-registered advisor before trading.
#Boost and comment will be highly appreciated

BTC Eyes 108800 After Triangle Validation📊 Cycle Structure:
HWC (Higher Wave Cycle): Bullish 🔼
MWC (Middle Wave Cycle): Ranging 🔁
LWC (Lower Wave Cycle): Weak Bearish 🔽
⛔ Note: This analysis is only for traders looking for long positions. If you're aiming for shorts, skip this one — I personally won’t short in this setup.
📐 Market Structure:
Bitcoin is currently forming an Expanding Triangle pattern on the 15-minute chart.
The third touch confirmed the validity of the triangle and triggered a strong bullish reaction, which is a good sign of structure strength.
🎯 Long Triggers & Strategy:
🔹 Trigger #1 (Riskier): Breakout above the descending trendline
⚠️ Not my favorite setup due to its shape, but it's still valid. If you use this trigger, manage your risk tightly.
🔹 Trigger #2 (Preferred): Breakout of 106467 resistance
✅ This level aligns with triangle breakout and offers a cleaner entry with better structure.
📌 Target:
In case of a successful breakout, price could push toward 108800, which is a strong resistance zone and a solid place for partial profit-taking.
📌 If there's a coin or pair you'd like me to analyze, drop it in the comments.
⚠️ Without proper risk management, you're just a ticking time bomb.
— PXA

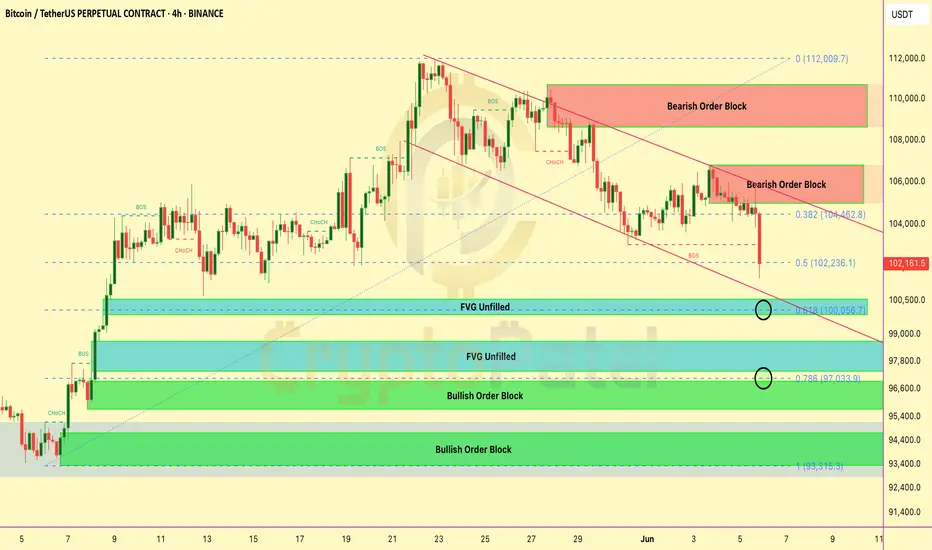
BITCOIN WARNING – $104K IS KEY🚨 BITCOIN WARNING – $104K IS KEY
#Bitcoin is showing signs of weakness on the 4H chart! Let’s break it down:
🔻 Trend Shift Detected:
Recent CHoCH and BOS suggest the uptrend is over. Market structure has turned bearish.
Key Levels to Watch:
▪️ Support at $104K is being tested again. If it breaks, we may see a drop.
▪️ Next major targets:
➤ $100.5K (Unfilled Fair Value Gap)
➤ $98K – Strong demand zone
➤ $96.6K – Bullish Order Block + FVG confluence
Why It Matters:
▪️ Price rejected hard from the $107K zone (supply + FVG)
▪️ Liquidity was grabbed from Equal Highs
▪️ Now it’s hunting lower liquidity near $100K
⚠️ If $104K fails, get ready for a quick drop to $100.5K or even $96.6K
Plan: Short-term bearish unless BTC breaks back above $106K with volume.
Stay alert — volatility incoming!

Bitcoin can take support from 103881.8Bitcoin can take support from 103881.8 and go to 114780. then fall can expect.
Bitcoin may touch 75k in near future as all technical showing price overbought. I was planning to short at 114780 sl 118804 tp 75000. This is my personal entry please take financier advice before taking any entry. which has good rr. refer my previous post.
BTCUSDT – Still Has Upside Potential, as Long as Support HoldsBitcoin is showing strong signs of recovery after retesting the support zone around 102,574 – which also aligns with the 34 EMA on the D1 chart. This bounce suggests that buying pressure remains intact and the market continues to respect the overall bullish structure.
If BTC can hold this area over the next few sessions, a breakout toward the resistance zone at 114,461 is a realistic scenario. With enough momentum, price might even break above the previous high and head toward the 118,000+ region.
That said, the 102,500 – 103,000 area is now the “make-or-break” zone. If it gets breached, the uptrend could be in jeopardy, and BTC might correct deeper toward the 89 EMA.
Intraday Long Setup | June 3rd 2025 | Valid Until Daily ClosePrice is retracing to a strong pivot zone (marked by the red box).
Structure remains bullish with potential for continuation after pullback.
The green box represents a high-probability long opportunity with tight risk control.
Watch for price reaction within the red zone. Entry only if confirmation (e.g., bullish engulfing, strong wick rejections) appears.
The setup expires at end of the daily candle close.
Intraday Long Setup | June 4th 2025 | Valid Until Daily ClosePrice is retracing to a strong pivot zone (marked by the red box).
Structure remains bullish with potential for continuation after pullback.
The green box represents a high-probability long opportunity with tight risk control.
Watch for price reaction within the red zone. Entry only if confirmation (e.g., bullish engulfing, strong wick rejections) appears.
The setup expires at end of the daily candle close.
BTCUSDT Trade Analysis📊 BTCUSDT Trade Analysis
Previous Move (Sell)
✅ Sell executed successfully – target reached (🎯).
📈 New Trade Setup (Buy)
💡 Current Plan:
Switching to buy now as the market has reached the previous sell target.
New Target:
Next major resistance area near 111,025 – 111,072 USDT range (🟩 target box at the top).
📍 Key Levels:
Entry Zone: Above 105,000 USDT mini-resistance area (🟧 mini-resistance box).
Support: Around 102,999 USDT (blue support line).
Current Target (Buy):
Target zone: 111,025 – 111,072 USDT.
📌 Trade Plan Summary
Entry: Above 105,000 mini-resistance area break.
Target Point: 111,025 – 111,072 USDT 🟩.
Stop Loss: Suggested below 102,999 USDT to limit downside (🔴 red zone).
🎯 Conclusion:
🔵 Target for the buy move is well-defined and positioned above current resistance levels.
🟢 Awaiting price action above mini-resistance area for a safe entry for the next bullish leg!

Bitcoin Chart Analysis – June 4, 2025We are the SeoVereign Trading Team.
With sharp insight and precise analysis, we regularly share trading ideas on Bitcoin and other major assets—always guided by structure, sentiment, and momentum.
🔔 Follow us to never miss a market update.
--------------------------------------------------------------------------------------------------------
Hello, this is Seovereign.
In this idea, I will approach the Elliott Wave Theory from a fundamental perspective and share the entry point and take-profit level together.
Chart Analysis Overview
Top Left Chart: Wave Structure and Rationale
The current wave is judged to be a complex correction (W–X–Y) structure,
in which the Y wave appears to have extended to approximately 1.618 times the W wave.
Formula: Y = 1.618 × W
In the subsequent Impulse wave,
the 5th wave is estimated to have formed a length of 1.618 times that of the 1st wave.
Formula: Impulse 5 = 1.618 × Impulse 1
In the final wave, an Ending Diagonal pattern is observed.
This aligns with the typical rules of Fibonacci ratios and Elliott Wave Theory,
suggesting that the current zone may be entering a technical completion phase.
Bottom Left Chart: Supporting Structure
In this section, a 5-wave diagonal with overshooting appeared,
followed by a corrective wave sequence.
This 5th wave appears to have ended with a length ratio of 0.5 times the 1st wave.
Conclusion and Scenario
Referring to the right chart, a predicted path for future movement is presented.
As of now, the first target price is set at 108,191,
with the following rationale:
Whipsaw near 103,600
Support formation zone around 104,800
