BTCUSDT SHORT I was sitting in Short after a good bearish candle formed at resistance with very good volume, i just took 1:2 and i was out of the trade.
Logic :- Price was too stretched and bears were gaining control, bulls were trapped
But still the trend is bullish for me, lets see 🚀
Happy profits 🥂 enjoy guys, sorry i didn’t posted this trade earlier
LIKE AND FOLLOW FOR MORE TRADE IDEAS
Trade ideas

As posted earlier 1:2 done As posted earlier i was sitting long in Btcusdt, 1:2 is done and i am out of the trade with 70% qunatity.
BINANCE:BTCUSDT
Like and follow for these types of trade ideas !!
And Join me with my journey so you can make yours 👍
Disclaimer: This is not financial advice. Please consult your financial advisor before making any investment decisions.

Bitcoin_Short Elliot WaveBitcoin appears to be completing an ABC pattern, potentially reaching up to 106,000. I anticipate a downside move below 99,000 once it tests resistance around 106,000. A short position could be considered near that level with a tight stop-loss.Please do your own research before taking any trade decisions.

bitcoin bullish bitcoin will bullish from 98 or 96 price If good candle near my OFL like positive engulfing or any other bullish candle than bitcoin will hit all time high and my pervious analysis is going to hit the target which was analysis before the crash of the bitcoin you can check it

#BITCOIN TECH UPDATE: BEARISH IN CONTROL#BITCOIN TECH UPDATE: BEARISH IN CONTROL
CRYPTOCAP:BTC is down 14% from $115K retest, clean rejection.
Trend remains bearish, structure forming lower highs & lower lows.
Key Zones:
Relief zone: $105K–$108K (short setup area).
Major support: $94K → break below = $76K next.
Momentum:
Selling pressure dominates; no bullish divergence yet.
Invalidation:
Only a close above $111.5K flips bias bullish toward $150K. ( Super Bullish Above $116.5K)
Plan:
Sell rallies. Manage risk. Avoid FOMO longs.
NFA & DYOR

$BTC LongLooks like bottom is in and 4hrs timeframe looks pretty decent to me for the next move at least to 108K$ and that will be the area where i will be more cautious and look into the daily timeframe and if we manage to break above the daily OB i believe we will make a new ATH

BTCUSDT Outlook 08/11/2025So right now, what I’m seeing on crypto today — honestly, it’s the weekend, and that’s never the best time to look for high-probability setups. But if we ignore the timing for a second and just focus on structure, I’m leaning bearish.
On the daily, the flow’s clearly bearish. ETH already cleared the daily FVG and showed SMT divergence with BTC, while Bitcoin couldn’t even take out the highs — basically an SMT sell setup between the two.
On the H4, you can spot the second stage of SMT divergence — one up at the top, and another with the previous candle.
Price looks like it wants to pull back and roll over from here.
So yeah, I’m kinda expecting a red weekend for BTC, as long as this structure keeps holding

My Journal - 08/11/2025 - BTCUSDT Scalp Idea Price has tapped into H4 FVG and has formed a bullish SMT with ETH, a 1 to 2 RR Trade. Do your own research.

Pat 9 Tradig Master ClassThe Greeks in Options
The Greeks measure the sensitivity of an option’s price to various factors:
Delta: Measures how much the option’s price changes for a ₹1 move in the underlying asset.
Gamma: Measures the rate of change of delta; it helps traders understand how delta will change as the market moves.
Theta: Measures time decay—how much the option loses value each day as expiration approaches.
Vega: Measures sensitivity to volatility changes.
Rho: Measures sensitivity to interest rate changes.
Understanding these helps traders manage risk and create balanced strategies.

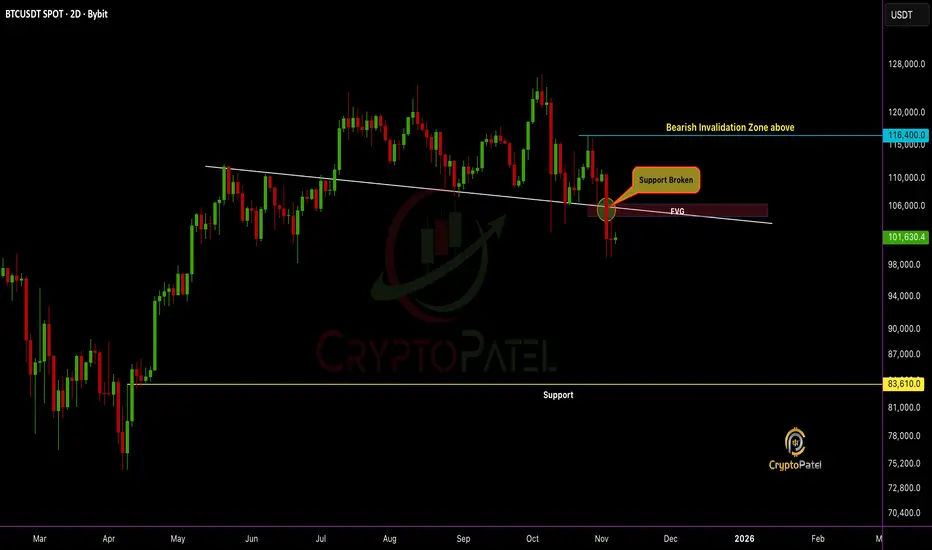
BTC Breakdown Confirmed, Structure Flipped Bearish: Next $88610?BTC Breakdown Confirmed, Structure Flipped Bearish: Next Stop $83,610?
Support is broken and the structure confirms a clear bearish shift.
#Bitcoin failed to reclaim the Fair Value Gap (FVG) zone, turning it into strong resistance.
High chances CRYPTOCAP:BTC could fill the FVG and continue the downside move toward $83,610.
Bulls remain trapped unless price reclaims $116,400, the bearish invalidation zone.
Trend bias remains bearish. Liquidity targets below are in play.
NFa & DYOR
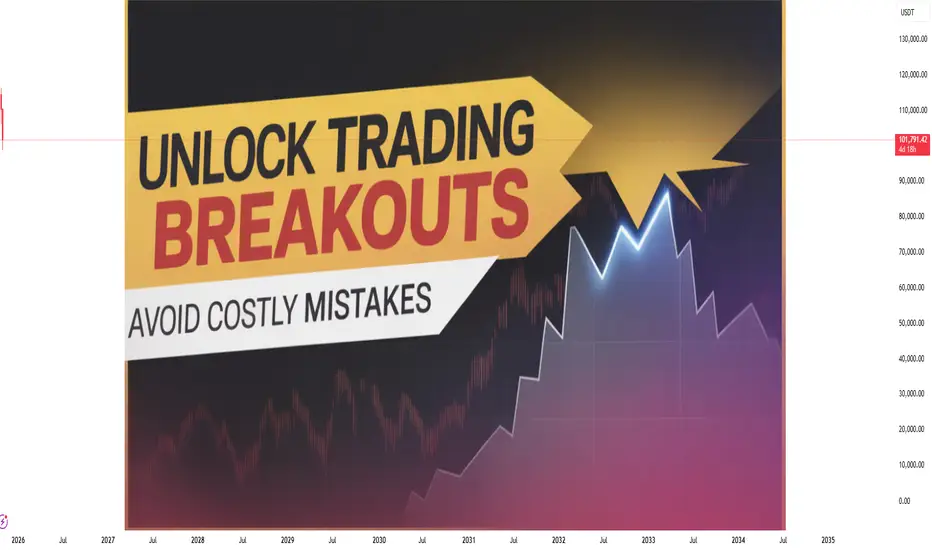
Unlocking Trading Breakouts and Avoiding Costly Mistakes1. What Is a Breakout in Trading?
A breakout occurs when the price of a stock or asset moves outside a key support or resistance level with increased volume.
Resistance Breakout: Price moves above a resistance level (previous high or consolidation zone).
Support Breakout: Price drops below a support level (previous low or base).
This movement suggests that market sentiment is shifting—buyers or sellers are gaining control. A valid breakout often signals a new phase of volatility or the beginning of a strong trend.
For example, if a stock has been trading between ₹100 and ₹120 for weeks, a close above ₹120 on strong volume may signal a bullish breakout—potentially leading to a larger upside move.
2. Why Breakouts Matter
Breakouts often mark major transitions in supply and demand.
When price breaks above resistance, it shows that buyers have overpowered sellers.
When price breaks below support, it means sellers have overwhelmed buyers.
These moments attract large institutional traders and trigger algorithmic buying or selling. Breakout traders attempt to capture the early stage of a trend before the broader market catches on.
However, not every breakout leads to a sustainable move. Many fail quickly—these are known as false breakouts or “bull traps” and “bear traps.” Understanding how to differentiate them is key to success.
3. Characteristics of a Strong Breakout
To filter high-probability breakouts, traders should look for certain confirming signals:
a. High Volume
Volume is the heartbeat of any breakout. When price breaks a key level with high volume, it shows strong participation and conviction among traders. Low-volume breakouts often fail.
b. Tight Consolidation Before Breakout
A tight range or a base pattern (like a flag, pennant, or triangle) before breakout suggests accumulation or preparation for a major move.
c. Strong Close Beyond the Level
The price should close beyond the breakout point—not just spike intraday. Closing strength confirms that the breakout is genuine.
d. Favorable Market Context
Breakouts perform best in trend-supportive markets. A bullish breakout in a strong overall market (e.g., NIFTY 50 uptrend) has a higher chance of succeeding.
4. Common Types of Breakout Patterns
1. Horizontal Breakouts
Price breaks a flat support or resistance level, often after sideways movement or consolidation.
2. Trendline Breakouts
A long-standing trendline is breached, signaling a potential reversal or acceleration of momentum.
3. Chart Pattern Breakouts
Patterns like triangles, flags, rectangles, cups and handles, and head and shoulders often lead to breakouts. Each has its psychology of accumulation and release.
4. Volatility Breakouts
Price suddenly expands after a period of low volatility (e.g., after a squeeze on Bollinger Bands). Such breakouts are explosive but short-lived.
5. The Psychology Behind Breakouts
Understanding trader psychology is as important as chart analysis.
When price nears resistance, many traders expect rejection and place sell orders there. But once the price breaks above that level, short sellers are forced to cover, adding to buying pressure. Similarly, breakout traders jump in, driving price higher—a self-reinforcing cycle that fuels trends.
However, emotions can be dangerous. Many traders fear missing out (FOMO) and chase the price after the breakout has already extended too far. This often leads to losses when price retraces.
6. The Most Common Breakout Mistakes (and How to Avoid Them)
a. Entering Too Early
Jumping in before confirmation is a common trap. Wait for a daily or hourly candle close above resistance (or below support). Premature entries often get caught in false breakouts.
Solution: Be patient. Confirmation matters more than speed.
b. Ignoring Volume
Breakouts without volume often lack strength. Many traders ignore this and assume every move beyond a line is a breakout.
Solution: Use volume indicators (like Volume Profile or OBV) to confirm market participation.
c. No Stop-Loss Strategy
Many traders enter breakouts without pre-defined stop-loss levels, hoping the price will “eventually” go in their favor. This leads to big losses.
Solution: Always place a stop-loss just below the breakout point (for longs) or above it (for shorts). This protects against false breakouts.
d. Chasing Price
After the breakout, price may retest the breakout zone before resuming its trend. Impatient traders chase extended moves, only to see price pull back.
Solution: Wait for a retest or minor pullback before entering.
e. Ignoring Market Context
A breakout in a weak overall market is risky. Broader sentiment influences individual stock movement.
Solution: Align trades with broader trend direction. Bullish breakouts perform better in bull markets.
f. Over-Leveraging
Using high leverage amplifies both profit and loss. If the breakout fails, leveraged traders face margin calls.
Solution: Keep position sizes moderate—risk no more than 1–2% of capital per trade.
7. Smart Techniques to Trade Breakouts Effectively
a. Use Multi-Timeframe Analysis
Check higher timeframes (like weekly or daily) to confirm structure, and use lower ones (like 1-hour) for entries. This ensures alignment between short-term and long-term trends.
b. Employ Volume Profile
Volume Profile helps identify high-volume nodes (HVNs)—zones of strong support/resistance—and low-volume nodes (LVNs)—areas where breakouts are likely to accelerate.
c. Watch for Retests
Many valid breakouts come back to retest the broken level before continuing. This offers low-risk entry points.
d. Combine Momentum Indicators
Use RSI, MACD, or ADX to confirm momentum. If these show strength during breakout, chances of success rise.
e. Manage Emotions
Don’t let excitement or fear dictate action. Follow your trading plan strictly—discipline beats prediction.
8. Risk Management in Breakout Trading
Breakout trading works best with strict risk management because not all breakouts succeed.
Here’s how to manage risk effectively:
Stop-Loss: Place just beyond the opposite side of the breakout.
Position Sizing: Limit risk to 1–2% of capital per trade.
Trailing Stops: As price moves in your favor, trail your stop-loss to lock in profits.
Risk–Reward Ratio: Target at least 2:1. For every ₹1 risked, aim to gain ₹2.
Without proper risk control, even a few failed breakouts can wipe out profits from several successful ones.
9. Identifying False Breakouts
False breakouts happen when price temporarily breaches a key level and then reverses sharply. These are often caused by stop-hunting or lack of follow-through buying/selling.
How to Identify:
Breakout happens with low or average volume.
Price doesn’t close beyond the level.
Immediate reversal candle (like a shooting star or bearish engulfing).
How to Avoid:
Wait for confirmation on closing basis.
Avoid trading during major news events when volatility is erratic.
Use alerts instead of instant market entries.
10. Conclusion: Mastering the Art of Breakouts
Breakout trading offers tremendous potential—but only for disciplined traders who respect structure, volume, and risk. Successful breakout traders don’t chase—they anticipate, confirm, and control risk.
By focusing on volume confirmation, price structure, and broader trend context, you can distinguish between genuine and false breakouts. Equally important is patience—waiting for setups that align technically and psychologically.
Remember: every breakout is an opportunity, but only if you trade it with a plan. Stay objective, manage your emotions, and protect your capital. Over time, mastering breakout trading becomes less about prediction and more about precision—the art of entering when others hesitate and exiting when others panic.
BITCOIN TECH UPDATE: BEARISH DOMINATES MUST READ🚨 BTC TECH UPDATE: BEARISH DOMINATES MUST READ 🚨
CRYPTOCAP:BTC is down 14% from my bearish short at $115,000 retest.
✅ Those who shorted, well played.
✅ Those who avoided longing at the top, capital saved.
Price Action:
#BITCOIN hit 1st support and broke below, trend remains bearish.
Next target: $94,000.
Short-Term Relief:
Expect a bounce toward $105,000–$108,000 (retest + FVG zone) before the next leg down.
Longer-Term:
$94,000 key decision zone → potential drop to $76,000 if bearish momentum continues.
Will update with precision once $94k is reached.
Sentiment: Bearish as forecasted from $115k.
Bullish Trigger:
If BTC breaks $111,500 with HTF candle close, bullish scenario activates → potential ATH toward $150,000.
Trade smart. Watch levels. Manage risk.
Your move: Ride the bearish wave or wait for the relief rally?
NFA & DYOR

watch this trendline in BTCwe clearly havea trendline here, must hold 98k,
anyway looks like capitulation like IPOs, nowsecondvawe must begin imo
BTC First Weekly BB Break Since March: This Changes EverythingFirst Weekly BB Break Since March: This Changes Everything!
Bitcoin is currently testing a key support zone around $104K, forming what appears to be the 5th major support retest in this ongoing bullish cycle.
Historical Pattern Insight:
Each of the previous four support retests (1–4) led to substantial rallies ranging from +70% to +200%, as shown in the green zones.
If the pattern repeats, the next potential upside move (Wave 5) could project CRYPTOCAP:BTC toward the $200K region, marking a ~100% upside from current levels.
New Technical Development:
This week marks Bitcoin’s first breach of the lower Bollinger Band (BB) on the weekly timeframe since March, signaling heightened volatility and potential exhaustion of the current corrective phase.
Bearish Scenario:
A confirmed breakdown below this critical support could trigger a deeper correction toward the $50K area (–55%), similar to previous cycle corrections highlighted in red.
Key Levels to Watch:
🔹 Support: $103K–$100K
🔹 Resistance: $110K, then $135K
🔹 Upside Target: $200K
🔹 Downside Risk: $50K
Indicators:
Bollinger Bands remain squeezed, indicating volatility expansion is near. The weekly mid-band continues to act as dynamic support, but a sustained close below it could shift the bias short-term.
🟩 Bullish Bias remains valid above $100K, invalidated only on a weekly close below support.
🟩 Pattern repetition or deviation here will define Bitcoin’s next macro leg.
NFA & DYOR

BTC/USDT (4h timeframe)...BTC/USDT (4h timeframe), I can summarize what’s visible and help interpret my targets:
Current price: Around $107,469
Chart setup: my using Ichimoku Cloud (Kumo) with marked zones:
Resistance level (green zone) around $107,000 – $108,000
Two target points drawn on the chart:
First target point: around $111,350 – $111,500
Second (higher) target point: around $116,500 – $117,000
✅ Summary of target levels visible on my chart:
1. Target 1: ~$111,350
2. Target 2: ~$116,700
These targets are likely based on a breakout above the Ichimoku Cloud and prior resistance zones.

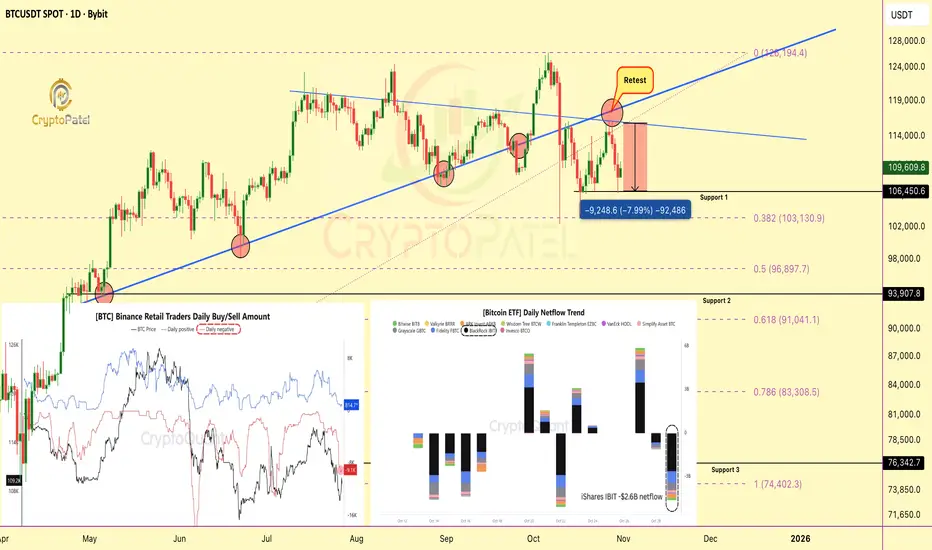
[SeoVereign] BITCOIN BEARISH Outlook – November 03, 2025I would like to share my Bitcoin idea as of November 3.
This idea is an extension of the one from October 27. The short positions entered on the 27th will be closed in profit in connection with this idea, and I plan to add some additional positions at the same time.
This idea is based on a bearish (short) perspective,
and I see a high possibility of a downward correction based on technical grounds.
First Basis — FIBONACCI 1.272 Retracement
Currently, Bitcoin is located in the 1.272 retracement zone relative to the previous downward movement.
This is generally recognized as the completion zone of a rebound,
where buying pressure tends to weaken and selling pressure begins to appear.
Second Basis — Trendline Breakdown
Bitcoin has clearly broken below the short-term ascending trendline.
This indicates the end of the short-term upward movement
and suggests the potential for a new downward trend reversal.
Accordingly, I set the average target price around 100,600 USDT.
Further position management and updates will be provided depending on market developments.
Thank you for reading.

Part 12 Trading Master Class With Experts Types of Options
There are two main types of options:
Call Option – A call gives the buyer the right to buy the underlying asset at the strike price before expiration.
Traders buy calls when they expect the price of the underlying asset to rise.
Put Option – A put gives the buyer the right to sell the underlying asset at the strike price before expiration.
Traders buy puts when they expect the price of the underlying asset to fall.
Each option can also be American-style (exercisable anytime before expiry) or European-style (exercisable only on the expiry date). In India, most index options like NIFTY or BANKNIFTY are European-style.

BtcThis chart shows BTC/USDT on the H1 timeframe analyzed using the Kumo-Only v2.2 system.
Price is currently testing the Kumo cloud area with RSI staying above 50, suggesting potential bullish continuation.
Key levels: Cloud top and bottom, recent swing high/low.
Trade plan: Target 1.5R, stop loss below the nearest swing low.
Volume confirmation is used when it exceeds the 20-period average.

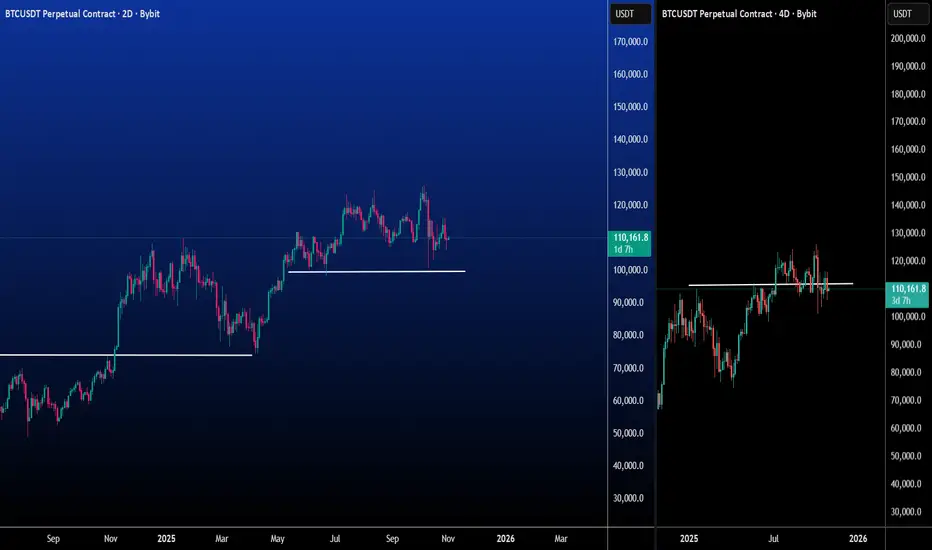
ByBit BTCUSDT Chart ( Mid Term Trade )Welcome Back To My Page.
Very Simple Chart.
-> First Trend Line
-> Second Trend Line
As we see the the pullback from the first Trend Line in Left Graph, Right Side Graph shows that Price got rejected from it's ATH and looking to take the support at Second Trend Line.
Like If your view align with my view.
Make sure any strong new now capable to Dump the price so take this advantage as December arrives soon.
Note : This is not a financial advice. Made just for Educational purpose
DAILY BULLISHCurrently Daily Structure looks bullish to me until we are going fail to hold the Higher Lows on the Daily time frame. Structure remains the same until we broke the HL

Retail Panic Meets ETF Outflows: $1B Bitcoin Sell-Off Hits MarkeRetail Panic Meets ETF Outflows: $1B Bitcoin Sell-Off Hits Markets
Bitcoin saw renewed selling pressure on Oct 30, as Binance retail traders dumped over 9,200 BTC (~$1B) around $107.7K, just days after another 12,000 BTC sell wave near $108.3K.
Technical View:
Retail traders are aggressively selling into weakness, while long-term holders remain largely inactive.
Historically, these sharp sell-offs from short-term players often form local bottoms, liquidity events where smart money quietly accumulates.
Fundamental Side:
Spot Bitcoin ETFs added more weight to the downside:
🔹 BlackRock: -$2.6B
🔹 Fidelity: -$790M
🔹 Grayscale: -$500M
These ETF outflows likely shifted capital to spot exchanges, amplifying short-term selling pressure.
Key Insight:
▶️ Retail capitulation + ETF outflows = short-term volatility
▶️ But remember, markets often bottom when retail panic peaks.
Note: NFA & DYOR
Part 1 Ride The Big Moves Role of Options in Hedging and Speculation
Options serve two primary purposes—hedging and speculation.
Hedging: Investors use options to protect their portfolios from adverse price movements. For example, a fund manager expecting a market downturn might buy put options on an index to limit potential losses.
Speculation: Traders use options to bet on the direction of price movements with relatively low capital compared to buying stocks outright. For instance, buying a call option allows participation in a stock’s upside potential without investing the full stock price.
Thus, options balance the needs of both conservative and aggressive market participants.

What Are Cryptocurrencies? A Simplified Overview1. The Basic Definition: What Is a Cryptocurrency?
A cryptocurrency is a digital or virtual form of money that uses cryptography (a method of securing information) to ensure secure transactions. Unlike traditional currencies such as the rupee, dollar, or euro — which are issued and controlled by governments or central banks — cryptocurrencies operate on decentralized networks, usually based on blockchain technology.
This means no single authority, like a bank or government, controls cryptocurrency. Instead, users themselves verify and record transactions through computer networks spread across the globe.
In short: Cryptocurrency = Digital Money + Cryptography + Decentralization
2. The Birth of Cryptocurrency: A Revolution in Digital Money
The idea of digital money isn’t entirely new. Efforts to create online currencies started as early as the 1980s and 1990s. But these early systems failed because they depended on a central authority, which made them vulnerable to fraud and manipulation.
The real breakthrough came in 2009, when a mysterious individual (or group) under the name Satoshi Nakamoto introduced Bitcoin — the first successful decentralized cryptocurrency.
Bitcoin solved two major problems that earlier attempts couldn’t:
Double-spending problem – ensuring digital money couldn’t be copied or spent twice.
Trust problem – enabling users to transact without needing to trust a middleman or central authority.
The launch of Bitcoin marked the beginning of a new financial era — one where money could move freely and securely on the internet.
3. How Cryptocurrencies Work
At the heart of every cryptocurrency lies a technology called the blockchain.
Think of a blockchain as a public digital ledger — a kind of record book that’s accessible to everyone but can’t be changed or tampered with.
Here’s how it works step by step:
Transaction Creation:
When someone sends cryptocurrency to another person (say, sending Bitcoin to a friend), that transaction is broadcast to a network of computers.
Verification:
These computers (called nodes) verify the transaction details — ensuring the sender actually has enough funds and that there’s no duplication.
Block Formation:
Verified transactions are grouped together into a “block”.
Blockchain Addition:
Once verified, this block is added to the existing chain of previous transactions — forming a continuous and secure “blockchain”.
Immutability:
Once a block is added, it cannot be altered. This makes blockchain systems highly secure and transparent.
Every participant in the network can view the transactions, but nobody can modify them. This creates a trustless system, meaning people don’t need to trust each other — they only need to trust the system’s mathematics and cryptography.
4. Mining: The Backbone of Cryptocurrency Creation
Most cryptocurrencies (like Bitcoin) are “mined” rather than printed. Mining refers to the process of using powerful computers to solve complex mathematical problems that validate transactions and create new coins.
When miners solve these problems, they add new blocks to the blockchain.
As a reward for their effort and energy, they receive new cryptocurrency coins.
This process not only issues new coins into circulation but also keeps the network secure and decentralized.
However, mining requires significant computing power and electricity. As a result, it has raised environmental concerns, leading newer cryptocurrencies to adopt more energy-efficient methods such as Proof of Stake (PoS) instead of Proof of Work (PoW) used by Bitcoin.
5. Types of Cryptocurrencies
While Bitcoin was the pioneer, thousands of other cryptocurrencies have since emerged, each with unique purposes and features. Some popular examples include:
Bitcoin (BTC):
The original and most valuable cryptocurrency. Often referred to as “digital gold”.
Ethereum (ETH):
Introduced the concept of smart contracts — programmable digital agreements that execute automatically when conditions are met.
Ripple (XRP):
Designed to make international payments faster and cheaper, especially for banks and financial institutions.
Litecoin (LTC):
A lighter, faster version of Bitcoin, often used for smaller transactions.
Cardano (ADA) and Solana (SOL):
Focus on scalability and energy efficiency for decentralized applications (DApps).
Stablecoins (like USDT, USDC):
These are cryptocurrencies pegged to stable assets like the US dollar to reduce volatility.
Meme coins (like Dogecoin, Shiba Inu):
Created for fun or community engagement, though some gained massive popularity.
The cryptocurrency ecosystem continues to expand, with coins serving purposes from gaming and supply chain management to healthcare and finance.
6. Why Are Cryptocurrencies So Popular?
Several reasons explain why cryptocurrencies have gained such massive popularity worldwide:
Decentralization and Independence:
People are drawn to the idea of money that isn’t controlled by banks or governments.
High Return Potential:
Early investors in Bitcoin and other cryptocurrencies saw extraordinary gains, inspiring millions to invest.
Transparency and Security:
Blockchain records are public and cannot be altered, which increases trust.
Borderless Transactions:
You can send money across countries instantly, with minimal fees and no need for conversion.
Financial Inclusion:
Cryptocurrencies can provide banking access to people in remote areas who lack traditional financial infrastructure.
Technological Innovation:
Blockchain technology opened the door for smart contracts, NFTs, and decentralized finance (DeFi), reshaping industries.
7. Risks and Challenges of Cryptocurrencies
Despite their promise, cryptocurrencies also come with significant challenges and risks:
Volatility:
Prices of cryptocurrencies can fluctuate dramatically. Bitcoin, for example, can gain or lose thousands of dollars in a single day.
Regulatory Uncertainty:
Governments worldwide are still developing laws to regulate crypto trading, taxation, and consumer protection.
Security Risks:
While blockchains are secure, cryptocurrency exchanges and wallets can be hacked if users are careless.
Environmental Concerns:
Mining consumes large amounts of electricity, raising questions about sustainability.
Lack of Understanding:
Many people invest without fully understanding the technology, leading to poor financial decisions.
Scams and Fraud:
Fake coins, Ponzi schemes, and rug pulls have caused investors to lose billions globally.
These issues show that while crypto offers freedom and innovation, it also demands responsibility, education, and regulation.
8. The Role of Blockchain: The Foundation of Crypto
Blockchain is the real hero behind cryptocurrencies. It ensures transparency, security, and decentralization.
Each block in the blockchain contains:
A list of transactions
A timestamp
A unique code (hash)
A reference to the previous block
This interconnected system prevents tampering and creates a permanent record of all transactions.
Beyond cryptocurrencies, blockchain is now being adopted in industries like:
Banking (for fast settlements)
Supply Chain Management (to track goods)
Healthcare (for secure patient data)
Voting Systems (to prevent fraud)
Real Estate (for transparent ownership records)
This shows that blockchain’s potential goes far beyond digital money — it can revolutionize how trust and information are managed in society.
9. The Legal and Regulatory Landscape
Different countries view cryptocurrencies differently:
El Salvador became the first nation to adopt Bitcoin as legal tender in 2021.
India, the U.S., and the European Union allow crypto trading but are working on stricter rules for taxation and anti-money laundering.
Some countries like China have banned crypto transactions altogether.
In India, the government does not recognize crypto as legal tender but allows its trading and taxes it at 30% on profits, similar to gambling or speculative income. This reflects a cautious but open approach.
Over time, global regulation is expected to bring more clarity, investor protection, and institutional participation in the crypto market.
10. The Future of Cryptocurrencies
The future of cryptocurrencies is still being written. Some believe crypto will replace traditional banking systems, while others see it as a speculative bubble. However, one thing is certain — the underlying technology is here to stay.
Here are a few emerging trends shaping the future:
Central Bank Digital Currencies (CBDCs):
Many countries are launching their own digital versions of national currencies (like India’s Digital Rupee) to combine the benefits of crypto with government control.
Decentralized Finance (DeFi):
Platforms allowing people to lend, borrow, and trade without banks are gaining massive popularity.
Tokenization of Assets:
Real-world assets like real estate, gold, or art are being represented digitally through blockchain tokens.
Mainstream Adoption:
Companies like Tesla, PayPal, and Visa are integrating cryptocurrencies into their payment systems.
Regulated Crypto Ecosystems:
With better laws and security, institutional investors (like mutual funds and pension funds) are entering the market, bringing legitimacy and stability.
Despite challenges, crypto continues to evolve, pushing the boundaries of how we define money and value.
11. The Human Side: A Shift in Financial Power
Beyond technology, cryptocurrencies represent a philosophical and social shift.
For centuries, financial systems have been controlled by powerful intermediaries — banks, governments, and corporations. Crypto challenges this by empowering individuals directly.
It promotes:
Financial freedom
Transparency
Equal access
Innovation through collaboration
In this sense, cryptocurrencies are not just a new asset class — they symbolize a movement toward democratizing finance.
12. Conclusion: The Evolution of Money
Cryptocurrencies began as a simple idea — to create digital money independent of centralized control. In just over a decade, they have transformed into a global financial revolution influencing technology, policy, and economics.
They are more than an investment trend; they represent the next evolution of how humans exchange value, trust systems, and manage wealth. Yet, as with all powerful innovations, they require understanding, caution, and responsibility.
As the world continues to embrace digital transformation, cryptocurrencies will likely play an essential role — whether as alternative investments, technology enablers, or the foundation of the next-generation financial system.