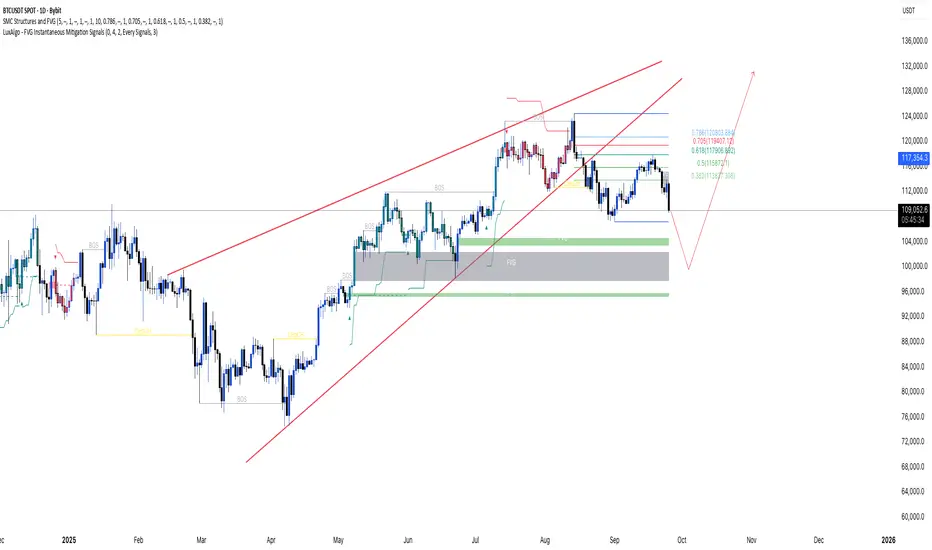
BTCUSDT Daily structure: liquidity run below 107k?Pair: BYBIT:BTCUSDT
Timeframes: 1D context, 4H execution
Type: Educational market study
Thesis
After printing a rising-wedge into ATH and breaking down, price is in a corrective leg within a higher-timeframe uptrend. I’m watching for a controlled pullback toward 107–106k A deeper flush could reach the D1 imbalance/demand around 101–104k, with a max-draw scenario toward 98K, If today’s daily close reclaims 111K, the near-term bounce path opens toward 115k, aligning with the 0.5–0.618 retracement cluster.
Market structure & SMC read
* Trend: HTF uptrend intact on D1/W1; local distribution after ATH.
* Pattern: Rising wedge into ATH, then breakdown and retest of the lower boundary.
* BOS/CHOCH: Most recent BOS occurred on the run to ATH; current move is corrective.
Supply/Demand:
Shallow demand: 106–107k.
Primary D1 demand/FVG: 101–104k.
* Liquidity: Resting liquidity sits below recent equal lows at 106–107k and deeper toward 98–100k. Overhead liquidity and confluence cluster around 113.9k / 115.8k / 117.9k / 119.4k / 120.8k (Fib 0.382→0.786).
Key levels
* Supports: 107.0k, 106.0k, 101–104k FVG, 98.0k.
* Reclaim gate:111k(daily close).
* Fib/targets: 0.382 -113.9k, 0.5 -115.8k, 0.618- 117.9k, 0.705-119.4k, 0.786 -120.8.
Scenarios
A) Base case: Dip then bounce
1. Sweep into 107–106k to clear local lows.
2. LTF **CHOCH/BOS** back above 107.5k with absorption tails.
3. Path: 111k reclaim → 113.9k** → 115.8k; stretch 117.9k.
B) Deeper flush: FVG mitigation
1. Failure to hold 106k on a D1 close opens 101–104k demand/FVG fill.
2. LTF confirmation from that block targets 109–111k first, then the Fib cluster.
3. 98k is the outer guardrail; a daily close below weakens the broader bullish case.
C) Immediate reclaim: Momentum continuation
* A daily close above 111k without tagging 106k first suggests strong demand. Look for follow-through toward **115.8k**, monitor reactions at 117.9k–120.8k.
Trigger criteria (educational, not signals)
* Price action: Liquidity sweep of 106–107k followed by LTF CHOCH/BOS back into structure.
* Volume:** Effort vs. result divergence on the dip or visible absorption at demand.
* Indicators (optional): RSI failure swing on LTF, session VWAPreclaim, MA(20/50) compression then expansion on the reversal impulse.
Risk framing (hypothetical)
* Define risk below the swept swing if engaging 106–107k; wider risk below 101k if waiting for the FVG fill.
* Initial R:R around 1:2 into 111k; scale at 113.9k, leave runner toward 115.8k.
Seasonal context
September often delivers corrective flows; Q4 has historically skewed bullish. This view aligns with a September pullback resolving into Q4 continuation, provided 98–101k remains protected on daily closes.
Chart notes
* Rising wedge into ATH, breakdown and retest
* D1 demand/FVG 101–104k and shallow demand 106–107k
* Fibonacci confluence 113.9k → 120.8k
Disclaimer : This is an educational market study, not financial advice. Do your own research and risk management.
Trade ideas

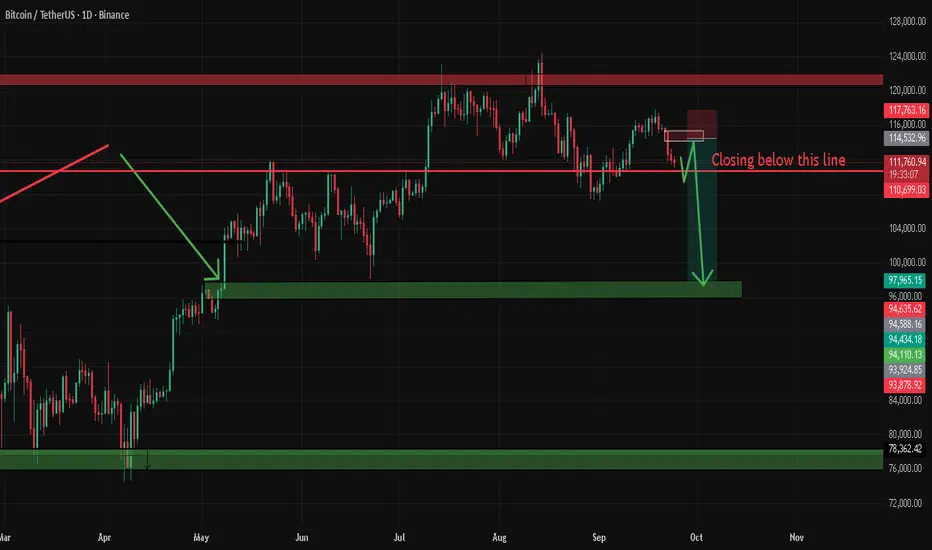
BTCUSDTBitcoin has formed an head and shoulders with 0.5-0.61 ribb rejection recently.
Look for shots only upto 97k

BTC LONG SETUPBTC/USDT – 1H Long Setup Analysis
🔹 Current Price: 111,653 USDT (Bitget Perpetual)
🔹 Trend: After a sharp drop from recent highs, BTC is showing signs of forming a base with a possible rebound setup.
⸻
Key Observations:
1. Support Zone:
• Strong support is visible around 110,744 – 110,747 USDT, marked by previous demand and horizontal structure.
• Below that, deeper support lies near 109,383 – 108,534 USDT.
2. Resistance Levels / Targets:
• TP1: ~115,078 – 115,980 USDT
• TP2: ~117,340 – 118,165 USDT
• Higher extension target: ~119,810 USDT
3. Trend Structure:
• Price broke a rising channel but has bounced back after a correction.
• Current pullback is retesting demand, indicating potential continuation to the upside if bulls defend the base.
4. Indicators:
• EMA 9 (blue) is currently under pressure, suggesting short-term weakness, but if reclaimed, momentum could shift bullish.
• Volume shows increased activity at recent lows, hinting at accumulation.
⸻
Long Trade Plan (Swing Bias):
✅ Entry Zone: Between 111,000 – 111,700 USDT (current price zone, near support)
✅ Stop-Loss: Below 110,744 USDT (to avoid fakeouts)
✅ Take Profit Targets:
• TP1 → 115,078 – 115,980 USDT
• TP2 → 117,340 – 118,165 USDT
• Extended TP → 119,810 USDT
📊 Risk-Reward Ratio: Favorable (approx. 1:3+ if targeting TP2).
⸻
Summary:
BTC is consolidating above a strong support base. If bulls hold the 111K–110.7K zone, upside targets remain valid towards 115K–118K. A break below 110.7K would invalidate this setup and could push price toward 109K or lower.

Part 8 Trading Master Class1. Core Option Trading Strategies
These are the foundational option strategies every trader must know. They are relatively simple, easy to implement, and help beginners understand how options behave in different market conditions.
1.1 Covered Call Strategy
What It Is:
A covered call involves owning the underlying stock and simultaneously selling (writing) a call option on the same stock.
How It Works:
Suppose you own 100 shares of TCS at ₹3,500 each. You sell a call option with a strike price of ₹3,700, receiving a premium of ₹50 per share.
If TCS rises above ₹3,700, you may have to sell your stock at ₹3,700, but you keep the premium.
If TCS stays below ₹3,700, you keep both the stock and the premium.
Best Used When:
You expect the stock to remain flat or rise slightly.
Advantages:
Generates regular income (option premiums).
Provides partial downside protection.
Risks:
Limits profit if the stock price rises sharply, because you must sell at the strike price.
1.2 Protective Put (Married Put)
What It Is:
A protective put involves owning the underlying stock and buying a put option to hedge against potential losses.
How It Works:
Imagine you own 100 shares of Infosys at ₹1,600. To protect yourself from a market downturn, you buy a put option at ₹1,550 by paying a premium of ₹30.
If Infosys drops to ₹1,400, you can still sell at ₹1,550 (limiting your losses).
If Infosys rises, your put option expires worthless, but your stock gains.
Best Used When:
You’re bullish long-term but worried about short-term downside risk.
Advantages:
Insurance against big losses.
Peace of mind for long-term investors.
Risks:
Premium cost reduces net profit.
1.3 Long Call
What It Is:
Buying a call option when you expect the stock price to rise.
How It Works:
Suppose Nifty is at 24,000. You buy a call option at a strike of 24,200 for a premium of ₹100.
If Nifty rises to 24,500, your option is worth 300 points (500 – 200), making a profit.
If Nifty stays below 24,200, your option expires worthless and you lose the premium.
Best Used When:
You’re bullish on the market/stock.
Advantages:
Limited risk (only the premium).
High profit potential if the stock rises sharply.
Risks:
Options can expire worthless.
Time decay works against you.
1.4 Long Put
What It Is:
Buying a put option when you expect the stock price to fall.
How It Works:
Say HDFC Bank is trading at ₹1,600. You buy a put option at strike ₹1,580 for a premium of ₹25.
If HDFC falls to ₹1,520, you profit from the difference.
If it stays above ₹1,580, you lose only the premium.
Best Used When:
You’re bearish on the stock/market.
Advantages:
Limited risk, big profit potential if the stock falls sharply.
Can be used as portfolio insurance.
Risks:
Options lose value quickly if the stock doesn’t move.
1.5 Cash-Secured Put
What It Is:
Selling a put option while holding enough cash to buy the stock if assigned.
How It Works:
Suppose you want to buy Reliance shares at ₹2,300, but it’s trading at ₹2,400. You sell a put option at ₹2,300 for a ₹40 premium.
If Reliance falls below ₹2,300, you must buy it at ₹2,300 (your target price), and you also keep the premium.
If Reliance stays above ₹2,300, you don’t buy it, but you still keep the premium.
Best Used When:
You’re bullish on a stock but want to buy it cheaper.
Advantages:
Generates income if the stock doesn’t fall.
Lets you buy stock at your desired entry price.
Risks:
Stock could fall far below strike price, leading to losses.
1.6 Collar Strategy
What It Is:
A collar combines owning stock, buying a protective put, and selling a covered call.
How It Works:
You hold Infosys stock at ₹1,600.
You buy a put at ₹1,550 (insurance).
You sell a call at ₹1,700 (income).
This creates a “collar” around your stock’s possible price range.
Best Used When:
You want protection but are willing to cap profits.
Advantages:
Reduces risk with limited cost.
Works well in uncertain markets.
Risks:
Limited upside profit.
Complex compared to basic strategies.

btc short entry waiting for closing as you can clearly see why i have marked demand and supply and pretty sure for a short trade once it closed below that red line
BTCUSDT Set to Explode: Strong Uptrend Ahead!Hello everyone, today we’ll analyze an exciting opportunity with BTCUSDT, evaluating its strong uptrend and the potential to reach new highs.
BTCUSDT is trading on a strong upward trendline , with support levels at 110,500 and a high target of 123,700. The chart shows a breakout from an important resistance zone, with the price also positioned above the Ichimoku cloud , reinforcing the bullish trend.
Capital inflows into Bitcoin ETFs and the Fed’s decision to cut interest rates have created a favorable environment for Bitcoin , making the possibility of reaching new highs even stronger.
With favorable technical signals and macroeconomic factors , BTCUSDT is likely to continue its strong upward movement. However, always check support levels to manage risk effectively.
Wishing you successful trading!
BTCUSDT Technical AnalysisBitcoin is currently moving inside a bullish ascending channel, which is aligned with its previous upward momentum. If the upper boundary of the channel breaks, we can consider this structure as a bullish flag breakout, signaling continuation to the upside.
The High Wave Cycle (HWC) trend remains bullish, and for now, every pullback is seen as a buying opportunity for long positions. I’m not looking for shorts at this stage unless we see a clear break of the channel’s lower boundary followed by consolidation, which would confirm a structural shift.
At the same time, as Bitcoin approaches the lower boundary of the channel, the RSI is testing its own support zone. If today’s daily candle closes with healthy volume, it would strengthen the case for long positions in the upcoming sessions.
🔥 Trading Plan
Focus on long positions while the bullish channel holds.
Watch channel resistance for breakout confirmation (bullish flag scenario).
In case of a break below channel support → shift focus to short setups.
RSI support + volume confirmation = potential strong long entry.
#Bitcoin #BTCUSDT #CryptoTrading #PriceAction #TechnicalAnalysis #TradingView #BullishTrend #CryptoSignals
Financial Market Types: An In-Depth Analysis1. Overview of Financial Markets
Financial markets can be broadly defined as venues where financial instruments are created, bought, and sold. They play a vital role in the economy by:
Facilitating Capital Formation: Allowing businesses to raise funds for investment through equity or debt.
Price Discovery: Determining the fair value of financial assets based on supply and demand.
Liquidity Provision: Enabling participants to buy or sell assets quickly with minimal price impact.
Risk Management: Allowing the transfer of financial risk through derivative instruments.
Efficient Resource Allocation: Channeling funds from savers to those with productive investment opportunities.
Financial markets are diverse and can be categorized based on the type of instruments traded, the trading mechanism, and the time horizon of the assets.
2. Classification of Financial Markets
Financial markets are typically classified into several types:
Capital Markets
Money Markets
Derivative Markets
Foreign Exchange Markets
Commodity Markets
Insurance and Pension Markets
Primary and Secondary Markets
Organized vs. Over-the-Counter (OTC) Markets
Each of these markets has distinct characteristics, participants, and functions.
2.1 Capital Markets
Capital markets are financial markets where long-term securities, such as stocks and bonds, are traded. They facilitate the raising of long-term funds for governments, corporations, and other institutions.
2.1.1 Equity Market (Stock Market)
Definition: A market where shares of publicly held companies are issued and traded.
Functions:
Provides a platform for companies to raise equity capital.
Allows investors to earn dividends and capital gains.
Examples: New York Stock Exchange (NYSE), National Stock Exchange of India (NSE), London Stock Exchange (LSE).
Participants: Retail investors, institutional investors, brokers, regulators.
2.1.2 Debt Market (Bond Market)
Definition: A market where debt securities such as government bonds, corporate bonds, and municipal bonds are traded.
Functions:
Helps governments and corporations borrow money at a fixed cost.
Provides investors with stable income through interest payments.
Types of Bonds:
Treasury Bonds
Corporate Bonds
Municipal Bonds
Participants: Governments, corporations, financial institutions, pension funds.
2.1.3 Features of Capital Markets
Long-term in nature (usually over one year)
Supports economic growth through capital formation
Includes both primary (new securities issuance) and secondary markets (existing securities trading)
2.2 Money Markets
The money market is a segment of the financial market where short-term debt instruments with maturities of less than one year are traded. It is crucial for maintaining liquidity in the financial system.
2.2.1 Instruments in Money Market
Treasury bills (T-bills)
Commercial papers (CPs)
Certificates of deposit (CDs)
Repurchase agreements (Repos)
2.2.2 Functions of Money Markets
Provides short-term funding for governments, banks, and corporations.
Helps control liquidity in the economy.
Serves as a tool for monetary policy implementation by central banks.
2.2.3 Participants
Commercial banks
Central banks
Corporations
Mutual funds
2.3 Derivative Markets
Derivative markets involve contracts whose value derives from an underlying asset, such as stocks, commodities, currencies, or interest rates.
2.3.1 Types of Derivatives
Futures: Agreements to buy or sell an asset at a predetermined price in the future.
Options: Contracts giving the right, but not the obligation, to buy or sell an asset.
Swaps: Agreements to exchange cash flows or financial instruments.
Forwards: Customized contracts to buy or sell an asset at a future date.
2.3.2 Functions of Derivative Markets
Risk hedging for investors and firms
Price discovery for underlying assets
Arbitrage opportunities to exploit market inefficiencies
Speculation for profit
2.3.3 Participants
Hedgers (businesses, farmers, exporters)
Speculators
Arbitrageurs
Brokers and clearinghouses
2.4 Foreign Exchange (Forex) Markets
The foreign exchange market is a global decentralized market for trading currencies. It is the largest financial market in the world by volume.
2.4.1 Features
Operates 24 hours across major financial centers
Highly liquid due to global participation
Involves currency pairs (e.g., USD/EUR, USD/JPY)
2.4.2 Functions
Facilitates international trade and investment
Enables currency hedging and speculation
Determines exchange rates through supply-demand mechanisms
2.4.3 Participants
Commercial banks
Central banks
Multinational corporations
Forex brokers
Hedge funds
2.5 Commodity Markets
Commodity markets are platforms for buying and selling raw materials and primary products. They can be physical (spot) or derivative-based (futures).
2.5.1 Types of Commodities
Agricultural: Wheat, rice, coffee, cotton
Energy: Crude oil, natural gas
Metals: Gold, silver, copper
2.5.2 Functions
Price discovery for commodities
Risk management through hedging
Investment opportunities for diversification
2.5.3 Participants
Farmers and producers
Consumers (manufacturers)
Speculators
Commodity exchanges (e.g., CME, MCX)
2.6 Insurance and Pension Markets
While not traditionally thought of as trading markets, insurance and pension funds mobilize long-term savings and provide risk management.
Insurance Markets: Provide protection against financial loss.
Pension Markets: Offer long-term retirement savings investment opportunities.
Participants: Insurance companies, pension funds, policyholders.
2.7 Primary vs. Secondary Markets
2.7.1 Primary Market
Deals with the issuance of new securities.
Companies raise fresh capital through Initial Public Offerings (IPOs) or debt issuance.
Example: A company issuing bonds for infrastructure development.
2.7.2 Secondary Market
Deals with the trading of already issued securities.
Provides liquidity to investors.
Examples: Stock exchanges, bond trading platforms.
2.8 Organized vs. Over-the-Counter (OTC) Markets
Organized Markets: Centralized exchanges with standardized contracts (e.g., NYSE, NSE, CME).
OTC Markets: Decentralized markets where trading is done directly between parties. Typically used for derivatives, forex, and certain debt instruments.
3. Participants in Financial Markets
Financial markets involve a wide range of participants, each with distinct roles:
Individual Investors: Retail traders who invest for personal financial goals.
Institutional Investors: Mutual funds, insurance companies, pension funds, and hedge funds.
Brokers and Dealers: Facilitate transactions and provide market liquidity.
Governments and Central Banks: Influence markets through policy and regulation.
Corporations: Raise capital and manage financial risks.
4. Functions of Financial Markets
Financial markets are crucial for economic development:
Efficient Allocation of Resources: Capital flows to projects with the highest potential.
Liquidity Creation: Investors can convert assets into cash quickly.
Price Discovery: Markets determine asset prices based on supply and demand.
Risk Sharing: Derivatives and insurance allow for hedging financial risk.
Economic Growth: By mobilizing savings and facilitating investments, financial markets drive growth.
5. Conclusion
Financial markets are a complex ecosystem of institutions, instruments, and participants that enable the smooth functioning of the economy. From money markets providing short-term liquidity to capital markets fueling long-term growth, each type of market plays a unique role. With the rise of global interconnectedness, technology, and financial innovation, understanding these markets is more critical than ever for investors, policymakers, and corporations. They are the backbone of economic development, ensuring efficient capital allocation, risk management, and price discovery across the world.
BTC/USDT Outlook – Volatility Rises After Sharp DeclineBTC/USDT Market Report
Bitcoin recently faced heavy selling pressure, pushing the market into a sharp decline. This drop reflects a shift in sentiment where earlier stability has been replaced by increased volatility and downside momentum.
Price action shows signs of exhaustion after the fall, suggesting the possibility of a short-term rebound attempt. However, broader behavior still reflects uncertainty, with buyers needing stronger participation to shift momentum back in their favor.
If downward pressure continues, deeper corrections could emerge before any meaningful recovery. In the near term, traders should expect sharp swings as the market tries to stabilize.

Part 1 Master Candlestick PatternIntroduction
Options trading has always attracted traders and investors because of its flexibility, leverage, and the ability to profit in both rising and falling markets. Unlike simple stock buying, where you purchase shares and wait for them to rise, options allow you to speculate, hedge, or even create income-generating strategies. But this flexibility comes at a cost: risk.
In fact, while options provide opportunities for huge rewards, they also carry risks that can wipe out capital quickly if not managed properly. Many new traders get lured by the promise of quick profits and ignore the hidden dangers. The truth is, every option trade is a balance between potential gain and potential loss — and understanding the nature of these risks is the first step to trading responsibly.
In this guide, we’ll explore all major types of risk in options trading — from market risk and time decay to volatility traps, liquidity issues, and even psychological mistakes.
1. Market Risk – The Most Obvious Enemy
Market risk is the possibility of losing money due to unfavorable price movements in the underlying asset. Since options derive their value from stocks, indices, currencies, or commodities, any sharp move against your position can create losses.
For call buyers: If the stock fails to rise above the strike price plus premium, you lose money.
For put buyers: If the stock doesn’t fall below the strike price minus premium, the option expires worthless.
For sellers (writers): The risk is even greater. A short call can lead to unlimited losses if the stock keeps rising, and a short put can cause heavy losses if the stock collapses.
👉 Example:
Suppose you buy a call option on Reliance Industries with a strike price of ₹3,000 at a premium of ₹50. If the stock stays around ₹2,950 at expiry, your entire premium (₹50 per share) is lost. Conversely, if you had sold that same call, and the stock shot up to ₹3,300, you’d lose ₹250 per share — far more than the premium you collected.
Lesson: Market risk is unavoidable. Every trade needs a pre-defined exit plan.
2. Leverage Risk – The Double-Edged Sword
Options provide huge leverage. You control a large notional value of stock by paying a small premium. But this magnifies both profits and losses.
A 5% move in the stock could mean a 50% change in the option’s premium.
A trader who overuses leverage can blow up their capital in just a few trades.
👉 Example:
With just ₹10,000, you buy out-of-the-money (OTM) Bank Nifty weekly options. If the market moves in your favor, you might double your money in a day. But if it goes the other way, you could lose everything — and very fast.
Lesson: Leverage is powerful, but without discipline, it’s deadly.
3. Time Decay Risk – The Silent Killer (Theta Risk)
Options are wasting assets. Every day that passes reduces their time value, especially as expiry nears. This is called Theta decay.
Option buyers suffer from time decay. Even if the stock doesn’t move, the option premium keeps falling.
Option sellers benefit from time decay, but only if the market stays within their expected range.
👉 Example:
You buy an at-the-money (ATM) Nifty option one week before expiry at ₹100. Even if Nifty stays flat, that option could drop to ₹40 by expiry simply because of time decay.
Lesson: If you are an option buyer, timing is everything. If you are a seller, time decay works in your favor, but risk still exists from sudden moves.
4. Volatility Risk – The Invisible Factor (Vega Risk)
Volatility is the heartbeat of options pricing. Higher volatility means higher premiums because there’s a greater chance of large price moves. But this creates Vega risk.
If you buy options during high volatility (like before elections, results, or big events), you may pay inflated premiums. Once the event passes and volatility drops, the option’s value can collapse, even if the stock moves as expected.
Sellers face the opposite problem. Selling options in low volatility periods is dangerous because any sudden jump in volatility can cause premiums to spike, leading to losses.
👉 Example:
Before Union Budget announcements, Nifty options trade at very high premiums. If you buy expecting a big move, but the budget turns out uneventful, volatility drops sharply, and the option loses value instantly.
Lesson: Never ignore implied volatility (IV) before entering an option trade.

Options Trading & Strategies1. Introduction to Options Trading
Options trading is a cornerstone of modern financial markets, offering traders and investors unique tools for hedging, speculation, and portfolio optimization. Unlike stocks, which represent ownership in a company, options are financial derivatives—contracts that derive their value from an underlying asset, such as a stock, index, commodity, or currency.
At its core, options trading allows participants to buy or sell the right—but not the obligation—to buy or sell an asset at a predetermined price on or before a specific date. This flexibility has made options an essential instrument for sophisticated investors looking to manage risk, enhance returns, or speculate on price movements.
1.1 Basic Terminology
Understanding options begins with grasping key terms:
Call Option: Gives the holder the right to buy the underlying asset at a specified price.
Put Option: Gives the holder the right to sell the underlying asset at a specified price.
Strike Price (Exercise Price): The predetermined price at which the option can be exercised.
Expiration Date: The last date the option can be exercised.
Premium: The price paid to purchase the option.
In-the-Money (ITM): A call option is ITM if the asset price is above the strike; a put is ITM if the asset price is below the strike.
Out-of-the-Money (OTM): Opposite of ITM; options have no intrinsic value but may hold time value.
At-the-Money (ATM): Strike price equals the current price of the underlying asset.
2. Why Trade Options?
Options are versatile instruments that serve multiple purposes:
Leverage: Options allow control over a larger position with a smaller capital outlay, magnifying potential gains—but also potential losses.
Hedging: Investors can protect portfolios from adverse price movements using options as insurance.
Speculation: Traders can bet on price directions, volatility, or even time decay to profit.
Income Generation: Through strategies like covered calls, investors can earn premium income on holdings.
Flexibility: Options strategies can be tailored to bullish, bearish, neutral, or volatile market conditions.
3. How Options Work
Options have two key components: intrinsic value and time value.
Intrinsic Value: The amount by which an option is ITM.
Example: A call option with a strike of ₹100 on a stock trading at ₹120 has ₹20 intrinsic value.
Time Value: The additional premium reflecting the probability of an option becoming profitable before expiration. Time value decreases as expiration approaches—a phenomenon called time decay.
3.1 The Role of Volatility
Volatility measures how much the underlying asset price fluctuates. Higher volatility increases the probability that an option will finish ITM, raising its premium. Traders often use the Implied Volatility (IV) metric to gauge market expectations and price options accordingly.
4. Basic Options Strategies
Options can be used in isolation or in combination to implement strategies. Basic strategies include:
4.1 Buying Calls
Objective: Profit from a rise in the underlying asset.
Risk: Limited to the premium paid.
Reward: Potentially unlimited.
Example: Buy a ₹100 call on a stock at ₹5 premium. If the stock rises to ₹120, profit = (120-100-5) = ₹15 per share.
4.2 Buying Puts
Objective: Profit from a decline in the underlying asset.
Risk: Limited to the premium.
Reward: Substantial, capped by zero price of the asset.
Example: Buy a ₹100 put for ₹5 premium. If the stock drops to ₹80, profit = (100-80-5) = ₹15 per share.
4.3 Covered Call
Objective: Generate income on stock holdings.
Mechanism: Sell a call against a long stock position.
Risk: Gains on stock capped at strike price; downside still exposed.
Example: Own a stock at ₹100; sell ₹110 call for ₹5 premium. Stock rises to ₹120: total profit = ₹10 (strike gain) + ₹5 (premium) = ₹15.
4.4 Protective Put
Objective: Hedge against potential stock decline.
Mechanism: Buy a put on a stock you own.
Risk: Premium paid for protection.
Reward: Unlimited on upside; downside limited by strike price of the put.
5. Advanced Options Strategies
Once comfortable with basic strategies, traders can explore combinations to optimize risk and reward.
5.1 Spreads
Spreads involve buying and selling options of the same type on the same underlying asset but with different strike prices or expirations.
5.1.1 Bull Call Spread
Buy a lower strike call, sell a higher strike call.
Limits both risk and reward.
Profitable when the underlying asset rises moderately.
5.1.2 Bear Put Spread
Buy a higher strike put, sell a lower strike put.
Profitable during moderate declines.
5.1.3 Calendar Spread
Buy and sell options with the same strike but different expirations.
Exploits differences in time decay.
5.2 Straddles and Strangles
These are volatility strategies, used when expecting large moves but uncertain direction.
Straddle: Buy call and put at the same strike price.
Strangle: Buy call and put at different strikes (ATM or slightly OTM).
Profit arises from large price movement either way.
5.3 Iron Condor
Combination of bear call spread and bull put spread.
Profitable when underlying trades in a narrow range.
Limited risk and reward.
5.4 Butterfly Spread
Combines multiple calls or puts at different strikes.
Limited risk and reward, typically used in low volatility expectations.
6. Risk Management in Options Trading
Options can amplify gains but also losses. Effective risk management is essential.
6.1 Position Sizing
Never risk more than a small percentage of capital on a single trade.
6.2 Stop-Loss and Exit Strategies
Use predetermined exit points.
For long options, consider exiting if premiums lose significant value due to time decay or adverse movement.
6.3 Diversification
Avoid concentrating all trades on a single underlying asset or strategy.
6.4 Greeks for Risk Control
Delta: Sensitivity to underlying price.
Gamma: Rate of change of delta.
Theta: Time decay effect.
Vega: Sensitivity to volatility changes.
Rho: Sensitivity to interest rates.
These metrics help traders understand how options react to market changes.
7. Options Trading in Different Markets
Options are traded in various markets:
7.1 Stock Options
Standardized on exchanges.
Used for hedging, income, and speculation.
7.2 Index Options
Based on indices like Nifty, S&P 500.
Cash-settled, avoiding delivery of the underlying.
7.3 Commodity Options
On gold, crude oil, agricultural products.
Useful for hedging and speculation in commodities markets.
7.4 Currency Options
Hedging foreign exchange risk.
Common in global trade and multinational operations.
8. Factors Influencing Option Prices
Option prices are influenced by several factors:
Underlying Asset Price: Directly affects ITM/OTM status.
Strike Price: Determines profitability threshold.
Time to Expiration: Longer time increases time value.
Volatility: Higher volatility raises premiums.
Interest Rates: Affect call and put prices slightly.
Dividends: For stocks, expected dividends reduce call option prices.
The most widely used pricing models include the Black-Scholes Model and Binomial Model, which incorporate these factors.
9. Common Mistakes in Options Trading
Ignoring Time Decay: Options lose value as expiration approaches.
Overleveraging: Using excessive contracts increases risk of total loss.
Poor Understanding of Greeks: Leads to unexpected losses.
Chasing Premiums: Selling high-premium options without understanding risk.
Neglecting Market Conditions: Not accounting for volatility or trend changes.
10. Psychological Aspects of Options Trading
Options trading is as much about psychology as strategy:
Patience: Avoid impulsive trades based on short-term market noise.
Discipline: Stick to a risk management plan.
Adaptability: Adjust strategies according to changing market conditions.
Emotional Control: Avoid fear-driven exits or greed-driven overtrading.
11. Options Trading Tools and Platforms
Modern trading platforms provide tools for analysis and execution:
Options Chain: Shows all available strikes, expirations, and premiums.
Volatility Charts: Track historical and implied volatility.
Greek Calculators: Evaluate option risk metrics.
Backtesting Software: Simulate strategies using historical data.
Popular platforms include Zerodha, Interactive Brokers, ThinkorSwim, and Upstox, offering both retail and professional-grade tools.
12. Practical Tips for Beginners
Start Small: Trade with a limited number of contracts.
Focus on One Strategy: Master one strategy before exploring complex ones.
Paper Trade: Practice virtually to understand dynamics without risking capital.
Stay Informed: Monitor market news, earnings, and economic indicators.
Maintain a Trading Journal: Record trades, rationale, and outcomes to improve over time.
13. Conclusion
Options trading offers tremendous potential for profits, hedging, and strategic positioning in financial markets. Its versatility allows traders to craft strategies for almost any market scenario—bullish, bearish, neutral, or volatile.
However, options are complex instruments, requiring a strong grasp of mechanics, pricing factors, and risk management. Beginners should approach cautiously, mastering fundamental strategies like long calls, puts, covered calls, and protective puts before exploring spreads, straddles, strangles, and more advanced combinations.
By combining technical analysis, sound risk management, and psychological discipline, traders can use options not just as speculative tools but as instruments to optimize portfolio performance and protect against adverse market movements.
In essence, options trading is a blend of art and science—where knowledge, patience, and strategic thinking can transform risk into opportunity.

Part 3 Learn Institutional Trading1. Introduction to Options Trading
Options trading is one of the most versatile and complex areas of financial markets. It offers traders and investors the ability to hedge, speculate, or generate income. Unlike stocks, which represent ownership in a company, options are financial contracts giving the buyer the right, but not the obligation, to buy or sell an underlying asset at a predetermined price within a specified time frame.
Options are derivatives, meaning their value derives from an underlying asset such as equities, indices, commodities, or currencies. They are widely used by institutional traders, retail investors, and hedgers to manage risk and leverage positions efficiently.
2. Types of Options
There are two primary types of options:
Call Options
Gives the holder the right to buy an underlying asset at a specified price (strike price) before or on the expiry date.
Used by traders who expect the price of the asset to rise.
Put Options
Gives the holder the right to sell an underlying asset at a specified price before or on expiry.
Used by traders who expect the price of the asset to fall.
Key Terms in Options Trading
Strike Price (Exercise Price): The predetermined price at which the asset can be bought or sold.
Expiry Date: The date by which the option must be exercised.
Premium: The cost of buying the option.
Intrinsic Value: The actual value if exercised immediately (difference between market price and strike price).
Time Value: Extra value reflecting the possibility of future price movement before expiry.
3. How Options Work
Options can be exercised in two styles:
American Style Options: Can be exercised anytime before expiry.
European Style Options: Can only be exercised on the expiry date.
Example:
You buy a call option for stock XYZ with a strike price of ₹1,000, expiring in 1 month.
Current market price is ₹1,050, and the premium paid is ₹50.
If the stock rises to ₹1,200, you can exercise the option and make a profit:
Profit = (Stock Price − Strike Price − Premium) = 1,200 − 1,000 − 50 = ₹150 per share.
4. Factors Influencing Option Prices
Option pricing is influenced by multiple factors:
Underlying Asset Price: The most direct influence; options gain value when the underlying asset moves favorably.
Strike Price: Determines the intrinsic value of the option.
Time to Expiry: More time generally means higher premiums because there is more chance for price movement.
Volatility: Higher volatility increases the likelihood of profitable movements, raising option premiums.
Interest Rates and Dividends: Affect option pricing for longer-term contracts.
The widely used Black-Scholes model calculates theoretical option prices, taking these variables into account.

Risk-Free Trading and Strategies1. Understanding Risk and the Risk-Free Concept
1.1 Definition of Risk in Trading
In trading, risk is defined as the probability of losing part or all of the invested capital due to market fluctuations. Market risks arise from several sources:
Price Risk: The chance that asset prices move against the trader’s position.
Interest Rate Risk: Fluctuations in interest rates affecting bond prices or currency valuations.
Liquidity Risk: Difficulty in executing a trade without impacting the asset’s price.
Counterparty Risk: The risk that the other party in a financial transaction may default.
1.2 The Risk-Free Rate
The risk-free rate is a foundational concept in finance. It represents the theoretical return an investor would receive from an investment with zero risk of financial loss. Government-issued securities, such as U.S. Treasury bills or Indian Government Bonds, are commonly used as proxies for risk-free assets because the probability of default is extremely low. All other investments are measured relative to this baseline using risk premiums, which compensate investors for taking additional risk.
1.3 The Myth of “Risk-Free Trading”
It is crucial to acknowledge that true risk-free trading does not exist in speculative markets. Even sophisticated strategies designed to minimize risk can fail due to unexpected market conditions, operational errors, or systemic shocks. However, financial markets offer near risk-free opportunities, often through arbitrage, hedging, or government-backed instruments.
2. Theoretical Foundations of Risk-Free Trading
2.1 Arbitrage Theory
Arbitrage is a cornerstone of risk-free trading. Arbitrage involves buying and selling the same asset simultaneously in different markets to profit from price discrepancies. Theoretically, arbitrage is considered “risk-free” because it exploits mispricing rather than market direction.
Example:
Suppose a stock trades at ₹100 on the National Stock Exchange (NSE) in India and $1.25 equivalent on an international exchange. A trader can:
Buy the cheaper stock in India.
Sell the same stock in the international market.
Lock in a risk-free profit equal to the price difference after accounting for transaction costs.
While arbitrage appears risk-free, practical execution involves risks, such as transaction delays, market volatility during execution, and high transaction costs.
2.2 Covered Interest Rate Parity
Covered Interest Rate Parity (CIRP) is a near risk-free strategy in the foreign exchange market. It exploits differences in interest rates between two countries while hedging currency risk through forward contracts.
How it Works:
Borrow funds in the currency with a lower interest rate.
Convert the borrowed funds into a higher interest rate currency.
Invest in a risk-free asset in the higher interest rate currency.
Use a forward contract to convert the proceeds back to the original currency at a predetermined rate.
This approach ensures a locked-in return with minimal exposure to currency fluctuations.
2.3 The Role of Hedging
Hedging is another critical element in risk-free trading. Hedging involves taking offsetting positions to reduce or neutralize market risk. Traders use derivatives like options, futures, and swaps to protect their portfolios from adverse price movements.
Common Hedging Strategies:
Protective Put: Buying a put option to limit downside on a stock holding.
Covered Call: Owning a stock while selling a call option to earn premium income while limiting upside.
Delta Neutral Strategy: Combining options and stock positions to minimize sensitivity to price changes.
Hedging reduces risk but does not entirely eliminate it. It is most effective in volatile markets where potential losses can be significant.
3. Practical Risk-Free Trading Strategies
Although no market strategy is entirely risk-free, several practical methods allow traders to approach near-zero risk levels.
3.1 Arbitrage Trading
Arbitrage remains the closest form of “risk-free trading.” Various types exist:
3.1.1 Stock Arbitrage
Exploits price discrepancies of the same stock across different exchanges.
Requires quick execution and sufficient capital.
3.1.2 Triangular Forex Arbitrage
Involves three currencies and takes advantage of discrepancies in cross-exchange rates.
For example, converting USD → EUR → GBP → USD to earn a risk-free profit.
3.1.3 Futures Arbitrage
Exploits the difference between spot and futures prices of the same asset.
Requires precise timing and understanding of carrying costs.
Pros: Low-risk, market-neutral.
Cons: Short-lived opportunities, requires technology and low transaction costs.
3.2 Hedged Trading with Derivatives
Options and futures provide tools for risk mitigation.
Protective Put Strategy:
Buy a put option for a stock already owned.
Limits maximum loss while allowing unlimited upside potential.
Covered Call Strategy:
Hold a stock and sell a call option.
Earn premium income, which offsets potential losses in small downturns.
Example:
Own 100 shares of a company at ₹1,000 each.
Sell a call option with a strike of ₹1,050 for ₹20 premium.
If stock rises above ₹1,050, you sell at ₹1,050 but keep ₹20 premium.
If stock falls, the premium offsets part of the loss.
3.3 Risk-Free Bonds and Government Securities
Investing in government securities is the most straightforward risk-free strategy. Examples include:
Treasury Bills (T-Bills): Short-term government debt with fixed returns.
Government Bonds: Longer-term instruments with predictable interest payments.
Fixed Deposits (FDs): Bank-backed deposits with guaranteed returns.
Pros: Extremely low risk and predictable returns.
Cons: Low returns compared to equities; susceptible to inflation risk.
3.4 Market-Neutral ETFs
Some ETFs employ long-short strategies to minimize market exposure.
Long-short ETFs: Buy undervalued stocks (long) and short overvalued stocks.
Market-neutral ETFs: Target returns independent of overall market movements.
These instruments provide a way for retail investors to engage in near-risk-free strategies without complex derivative setups.
3.5 Statistical Arbitrage
Statistical arbitrage uses historical correlations and mathematical models to trade pairs or baskets of securities.
How it Works:
Identify highly correlated assets.
Go long on underperforming and short on overperforming securities.
Profit as the spread converges.
This is a market-neutral strategy but requires sophisticated software, data analysis, and continuous monitoring.
4. Principles of Minimizing Risk
Even with strategies labeled “risk-free,” the following principles are essential:
Diversification: Spread capital across multiple assets to reduce exposure to a single market event.
Hedging: Protect positions using derivatives to offset adverse moves.
Position Sizing: Avoid over-leveraging, as even low-risk trades can become high-risk with excessive capital.
Liquidity Awareness: Trade only in liquid markets where positions can be exited quickly.
Cost Management: Transaction fees, spreads, and taxes can erode profits, converting low-risk strategies into potential losses.
5. Common Misconceptions
“Risk-free trading exists in all markets” → False. Only government-backed instruments are truly risk-free.
“High returns with zero risk is achievable” → Impossible; higher returns always involve higher risk.
“Hedging eliminates risk” → Hedging reduces risk but cannot remove systemic or operational risk.
6. Implementing Risk-Free Strategies in Real Markets
6.1 Tools and Platforms
Trading Platforms: NSE, BSE, Interactive Brokers, MetaTrader for forex arbitrage.
Derivatives Platforms: For options and futures hedging.
Data Analytics: High-speed software for identifying arbitrage opportunities.
6.2 Risk Monitoring
Set stop-loss orders even in hedged positions.
Use risk/reward analysis to evaluate each trade.
Monitor market conditions, interest rates, and geopolitical events that may affect “risk-free” assumptions.
6.3 Case Study: Arbitrage in Indian Markets
Scenario: Nifty futures trading at a premium to spot index.
Strategy:
Short Nifty futures.
Buy underlying stocks forming the index.
Lock in profit as futures and spot prices converge at expiry.
This is a classic cash-and-carry arbitrage, minimizing market risk while generating predictable returns.
7. Limitations of Risk-Free Trading
Capital Intensive: Arbitrage requires significant capital for small profits.
Execution Risk: Delays or errors can eliminate expected gains.
Regulatory Constraints: Some strategies may be restricted in certain markets.
Opportunity Scarcity: Risk-free opportunities are rare and often short-lived.
8. Conclusion
Risk-free trading is a concept grounded in finance theory but practically limited in speculative markets. True zero-risk investments are confined to government-backed securities, while near-risk-free strategies involve arbitrage, hedging, and market-neutral approaches. Traders aiming to minimize risk must combine strategic execution, diversification, and risk management tools to achieve consistent, low-risk returns.
While markets inherently carry uncertainty, understanding risk, leveraging arbitrage opportunities, and employing hedged strategies allows traders to approach the closest practical form of risk-free trading. In essence, the goal is not to eliminate risk entirely but to manage it intelligently, ensuring that potential losses are minimized while opportunities for gain remain accessible.
short term entry(Reliability on structure is low)short entry supply marked just wait how it reacts. at least 3% profit it works fine
BTC/USDT Analysis📊 BTC/USDT Analysis
Since yesterday, Bitcoin (BTC) has not shown any significant movement and continues to consolidate within its bullish ascending channel. The market structure remains intact, and our previous analysis is still valid.
The key trigger level to watch is 117,583.51. A confirmed breakout above this resistance would provide a strong long entry signal, opening the path for continuation towards higher resistances and potentially activating broader bullish momentum.
Until this breakout occurs, BTC is expected to remain within the channel, with downside supported by the channel’s lower trendline.
📌 Key Levels to Watch
Resistance/Trigger: 117,583.51
Support: Channel lower trendline & 107,820.57
🔥 Trading Bias:
Remain patient inside the channel. Bullish confirmation comes with a breakout above 117,583.51, aligning with the broader uptrend.
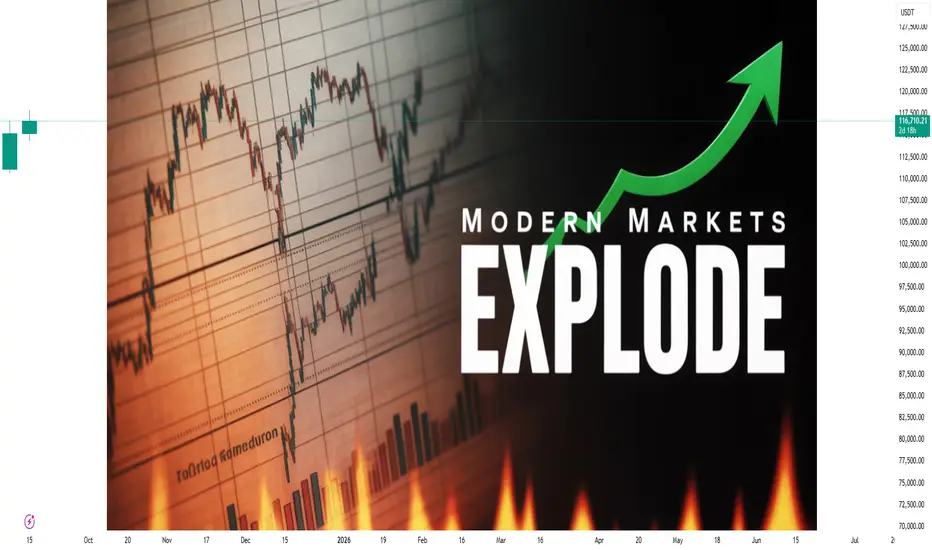
Sentiment-Driven Surges: Understanding Modern Market Explosions1. Market Sentiment: Definition and Importance
1.1 What is Market Sentiment?
Market sentiment refers to the overall attitude of investors toward a particular security or financial market. It represents the collective feelings, perceptions, and expectations of market participants about future price movements. Unlike fundamental analysis, which evaluates intrinsic value based on financial metrics, sentiment analysis focuses on how participants feel and act.
Market sentiment can be bullish (positive, expecting price increases) or bearish (negative, expecting price declines). It often drives momentum trades—buying when others buy, selling when others sell—creating self-reinforcing feedback loops.
1.2 Why Sentiment Matters
While fundamentals provide the baseline value, sentiment often dictates short-term market dynamics. Stocks with strong earnings may stagnate if investor sentiment is negative, while speculative assets can skyrocket without fundamental support, as seen in numerous “meme stock” rallies.
Key points:
Sentiment amplifies price volatility.
It can override fundamental signals in the short term.
It often creates market bubbles and flash crashes.
2. Drivers of Sentiment-Driven Surges
Several factors can trigger sentiment-driven market explosions. Understanding these drivers is essential for anticipating sudden price movements.
2.1 Social Media and Retail Trading Communities
In the digital era, platforms like Twitter, Reddit, Telegram, and Discord allow retail investors to coordinate actions rapidly. The 2021 GameStop saga is a prime example:
Retail traders organized online to push the stock price upward.
Short sellers were forced to cover positions, creating a short squeeze.
Price movement was largely independent of fundamentals.
Impact: Social media has transformed market psychology into a highly visible, amplifiable force. Viral narratives can trigger mass buying or selling within hours.
2.2 Algorithmic and High-Frequency Trading (HFT)
Algorithms react to market sentiment indicators, news, and price trends faster than humans can. Sentiment-based trading algorithms scan news feeds, tweets, and financial forums to predict market direction.
Positive sentiment triggers buying algorithms, increasing upward momentum.
Negative sentiment triggers selling algorithms, exacerbating declines.
Impact: HFT accelerates sentiment-driven surges, making them more extreme and less predictable.
2.3 Economic Data and Policy Announcements
Macroeconomic events, central bank policy changes, or earnings announcements can shape sentiment quickly.
Rate hikes: Markets may panic or rally based on perceived economic impact.
Inflation data: Surprising figures can trigger bullish or bearish sentiment.
Earnings surprises: Positive surprises can ignite rapid buying in stocks, sometimes overshooting intrinsic values.
2.4 Herding Behavior
Humans have an innate tendency to follow the crowd. Once a price starts moving, others often join in, creating momentum:
Fear of missing out (FOMO) amplifies upward surges.
Panic selling accelerates downward crashes.
Impact: Herding behavior often turns small sentiment shifts into large market movements.
3. Mechanisms Behind Market Explosions
Market surges do not occur in isolation. They are the result of interconnected feedback loops that magnify sentiment.
3.1 Momentum and Feedback Loops
When investors see prices rising, they buy more, driving prices higher—a self-reinforcing loop. Conversely, negative sentiment triggers rapid sell-offs. Feedback loops are amplified by:
Social media chatter
Trading algorithms
News coverage emphasizing price movements
3.2 Short Squeezes and Gamma Squeezes
Short positions are vulnerable during sentiment surges:
Short squeeze: Short sellers must buy back shares as prices rise, pushing prices further upward.
Gamma squeeze: Options market hedging by institutions forces more buying as underlying stock prices rise.
These mechanisms can make sentiment-driven surges explosive, often detached from fundamentals.
3.3 Liquidity and Market Depth
In low-liquidity conditions, small buy or sell orders can cause large price swings. Market sentiment can exploit these situations, leading to sharp, short-term surges.
Retail-driven markets often exhibit low liquidity, enhancing volatility.
Institutional players can manipulate perception to induce sentiment-driven movements.
4. Case Studies: Modern Market Explosions
4.1 GameStop (GME) – 2021
Coordinated retail buying triggered a massive short squeeze.
Price rose from $20 to over $400 in weeks.
Media coverage further fueled sentiment, creating global awareness.
Lesson: Social media combined with short vulnerabilities can cause extreme surges.
4.2 AMC Entertainment – 2021
Retail investors used sentiment-driven strategies to push stock prices up.
Options trading amplified the impact via gamma squeezes.
Fundamental financial health was largely irrelevant during the surge.
Lesson: Sentiment can dominate fundamentals, especially in low-liquidity assets.
4.3 Cryptocurrencies
Bitcoin and altcoins frequently experience sentiment-driven surges.
Tweets from influential figures (e.g., Elon Musk) can trigger massive price swings.
Speculative trading, FOMO, and global access make crypto highly sentiment-sensitive.
Lesson: Digital assets are extremely prone to narrative-driven price explosions.
5. Measuring Market Sentiment
To understand and anticipate surges, traders need reliable sentiment metrics.
5.1 Technical Indicators
Relative Strength Index (RSI): Measures overbought or oversold conditions.
Moving averages: Trends combined with sentiment data can indicate momentum.
Volume spikes: Often signal emerging sentiment-driven activity.
5.2 Social Media Analytics
Tweet volume and sentiment analysis: High positive mention frequency can indicate bullish momentum.
Reddit/Discord monitoring: Large posts and discussions can foreshadow retail-driven surges.
5.3 News and Media Sentiment
AI-powered sentiment analysis scans headlines and financial news.
Positive coverage often triggers short-term buying, negative coverage triggers selling.
5.4 Options Market Sentiment
High open interest and unusual options activity often precede price surges.
Call/put ratios indicate market expectations.
6. Trading Strategies Around Sentiment Surges
Traders can leverage sentiment-driven dynamics, but risk management is crucial.
6.1 Momentum Trading
Buy when sentiment is strongly bullish and prices are rising.
Use technical indicators for entry and exit points.
Watch volume and volatility for confirmation.
6.2 Contrarian Trading
Identify overextended sentiment-driven rallies.
Sell into extreme optimism or buy during panic.
Requires careful risk management and timing.
6.3 Event-Driven Sentiment Trades
Track scheduled events like earnings releases, policy announcements, or influencer posts.
Anticipate sentiment reactions and position accordingly.
6.4 Risk Management
Set stop-loss and take-profit levels to manage volatility.
Avoid over-leveraging during explosive surges.
Diversify exposure to minimize emotional decision-making.
7. Risks and Challenges
While sentiment-driven surges offer opportunities, they carry significant risks:
Volatility: Prices can reverse sharply, leading to losses.
Speculation vs. fundamentals: Trading purely on sentiment ignores intrinsic value.
Market manipulation: Pump-and-dump schemes exploit sentiment.
Psychological pressure: FOMO and panic can cloud judgment.
Traders must balance the allure of explosive gains with the discipline of risk control.
Conclusion
Sentiment-driven surges represent a paradigm shift in modern financial markets. While traditional fundamentals remain important, the rapid dissemination of information, social media influence, algorithmic trading, and psychological behaviors have created conditions where sentiment alone can trigger explosive market moves.
Understanding these surges requires a multi-dimensional approach—blending behavioral finance, technical analysis, social media monitoring, and risk management. For traders, recognizing sentiment signals, anticipating herding behavior, and using disciplined strategies can turn volatility into opportunity.
Ultimately, modern markets are no longer just about what a company is worth—they are about what investors feel it is worth, and sometimes, those feelings can move the market faster than any earnings report ever could.
btc Long ENtry ZOnei have mentioned the demand zone for the next wave of btc that would probably go and make newer higher high but to control my emotion i have clearly marked the supply before that moment comes. and my bank nifty futures entry failed which i have uploaded recently
(Bearish Or Short Entry). so please wait for the confirmation before stepping in otherwise you will keep hitting your stop losses. don't follow anyone blindly, follow the process or good qualities of that person rather than following person blindly.

On the Fear of FailureContemporary man suffers from a malaise that he often fails to express in words, stemming from the barrage of stimuli that overwhelm him daily and, in particular, from the crisis of traditional values that once provided clarity about the meaning of his existence.
This malaise is often fear, a preservation instinct whose evolutionary function is to prepare us for potential threats or to regulate behaviours that could harm the community, the cornerstone of our survival as a species.
Fear accompanies us at every moment: fear of failure, of disappointing our loved ones, of losing status, or even fear of fear itself.
In the world of investments, the inherent risk of facing uncertainty and the slim chances of success amplify the emotional burden of every decision. Thus, fear, originally protective, can become a paralysing or self-destructive force.
Manifestations of Fear in Investors
In the wild ecosystem of investments, fear can be classified into three main manifestations. The first is the fear that an idea or method will fail, leading investors to cling to flawed systems for too long or to delay the necessary testing before executing them. By nature, we avoid discomfort, and after investing time and energy in a project, facing a dead end feels profoundly unsettling.
The second is the fear of missing out on “the big opportunity,” particularly common among novice investors exposed to communities that showcase extraordinary results, often exaggerated or fabricated. This fear drives them to act recklessly, increasing the likelihood of costly mistakes.
The third, and most devastating, is the fear of being a failure, a malaise that can lead to anxiety, depression, and social isolation, while severely undermining performance.
A Way of Understanding is a Way of Feeling
The challenge in confronting paralysing impulses like fear lies in the fact that many proposed solutions, such as motivational speeches or rationalist approaches, end up reinforcing the same belief system that generates the discomfort. For instance, a motivational speech often has a fleeting effect, focusing on achieving success and developing positive ideas rather than embracing mistakes as a fundamental part of growth.
Paralysing fear can even limit the ability to assimilate constructive ideas or take positive actions. It is our belief system, the way we interpret reality, that either liberates or enslaves us and defines our capacity to succeed in any endeavour.
Most people today hold a flawed belief system, obsessed with outcomes and external validation, which makes them vulnerable to discomfort and distances them from authentic progress.
Conquest Through Failure
Just as a muscle strengthens by tearing its fibres to the point of exhaustion, love blossoms from sacrifice, and a skill is forged through time and dedication, both investments and life itself thrive on our exposure to mistakes for growth.
In trading, every loss or failed strategy is an opportunity to learn, adjust, and move forward, provided we transform our beliefs to see failure as the engine of progress and obstacles as stepping stones to virtue. Once we embrace this truth as the essence of our reality, we accept that disappointing others, being vulnerable to criticism, or being misunderstood is the inevitable price of growth—not only in investments but in every facet of our existence.
Every great discovery or talent has emerged from the struggle against failure, often confronting barriers imposed by institutions, social norms, or internal fears. Limitations such as age, lack of formal education, or excuses to justify failure often chain the common man to inaction.
Yet history shows us how Charles Darwin, Gregor Mendel, Michael Faraday, or Abraham Lincoln, without formal academic training, transformed the course of science, politics, and humanity. Others, like Charles Bukowski, Peter Mark Roget, or Maria Sibylla Merian, achieved their dreams at an advanced age, proving that time is not a barrier to reaching fulfilment.
The reality is that anyone, by overcoming obstacles in any field, can achieve excellence in a few years if they free themselves from limiting emotions and beliefs. Existence itself, whether by divine design or the vastness of the universe, endows us with opportunities: in one year, someone can overcome an addiction; in just two years, someone can maximise their physical potential; in less than five years, with effort and without fear of mistakes, almost any skill can be mastered. As long as we breathe, we hold in our hands the ability to positively transform our reality.
Conclusions
Although my usual focus is on the technical aspects of markets, on this occasion, I have sought to connect with the human side of the investors who read me, as I wish for them to understand that failing means fearing and retreating in the face of setbacks, while succeeding is failing fearlessly for a prolonged period until achieving virtue.
I am convinced that understanding mistakes and failure as inevitable and necessary parts of growth will not only strengthen their finances in the future but also make them freer and more confident individuals in all aspects of their lives.
Face every loss with gratitude, transforming mistakes into learning, and act with prudence and determination.

Part 2 Trading Master Class With ExpertsHow Option Trading Works
Let’s walk through a simple example.
Suppose NIFTY is trading at 20,000. You expect it to rise.
You buy a NIFTY 20,100 Call Option by paying a premium of ₹100.
If NIFTY goes up to 20,500, your call is worth 400 (20,500 – 20,100). Profit = 400 – 100 = 300 points.
If NIFTY stays below 20,100, your option expires worthless. Loss = Premium (₹100).
Here’s the beauty: as a buyer, your loss is limited to the premium paid, but profit potential is theoretically unlimited. For sellers (writers), it’s the reverse—limited profit (premium received) but unlimited risk.
Why People Trade Options
Options are not just for speculation. They serve multiple purposes:
Hedging: Investors use options to protect their portfolio against losses. For example, buying puts on NIFTY acts as insurance during market crashes.
Speculation: Traders take directional bets on stocks or indices with limited capital.
Income Generation: Sellers of options earn premium income regularly.
Arbitrage: Exploiting price differences in related instruments.
This versatility is what makes options attractive to both professionals and retail traders.
Risks in Option Trading
While options are powerful, they are also risky:
Time Decay (Theta): Options lose value as expiry approaches, especially if they are OTM.
Leverage Risk: Small market moves can lead to large percentage losses.
Complexity: Beginners may struggle with pricing models, strategies, and margin requirements.
Unlimited Loss for Sellers: Writing naked options can lead to huge losses if the market moves strongly against the position.
Thus, understanding risk management is critical before trading options seriously.
Option Pricing & The Greeks
Option prices are influenced by several factors. To understand them, traders use Option Greeks:
Delta: Measures how much the option price moves with a ₹1 move in the underlying asset.
Gamma: Measures how Delta changes with the underlying’s price.
Theta: Measures time decay. Shows how much value an option loses daily as expiry nears.
Vega: Measures sensitivity of option price to volatility changes.
Rho: Measures sensitivity to interest rate changes (less important in short-term trading).
The Greeks help traders design strategies, manage risks, and predict option price movements.

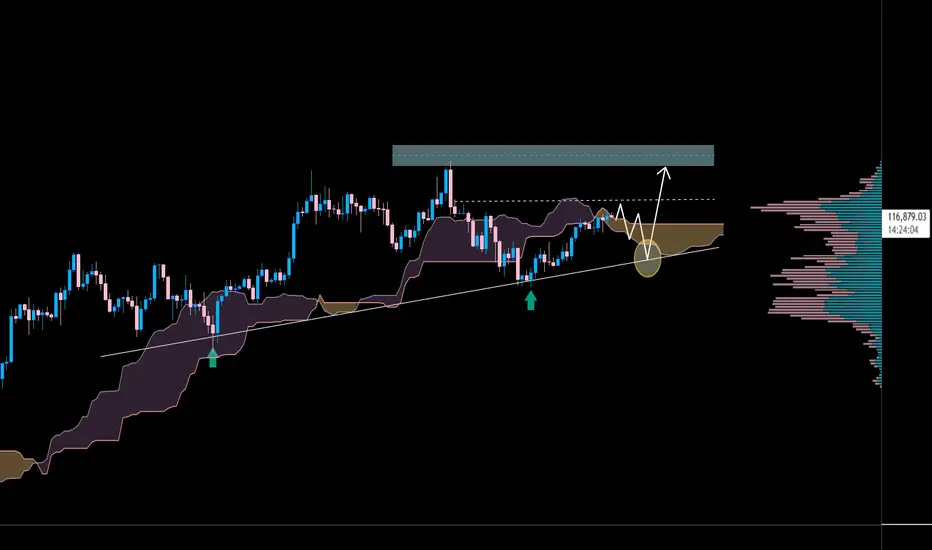
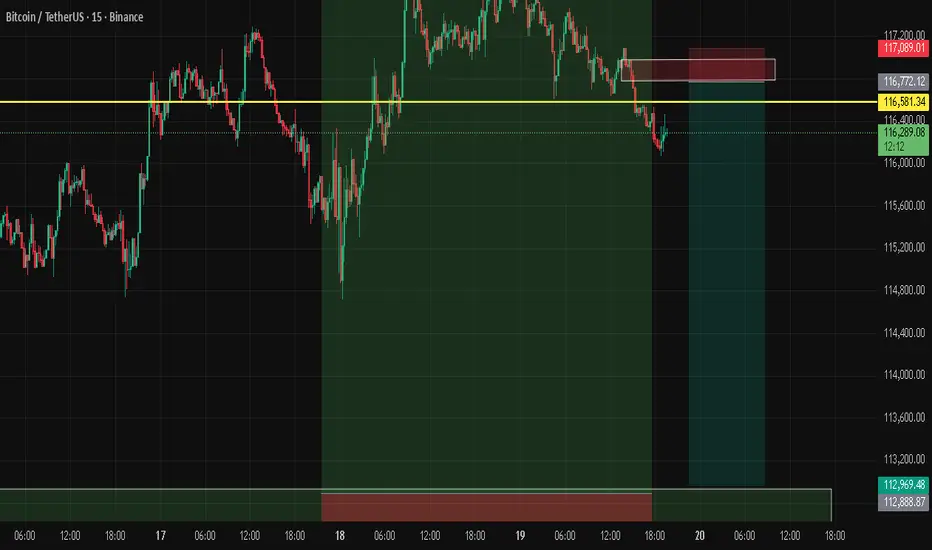
BTCUSDT Buy SetupPrice is currently consolidating above key support near 117,097 – 117,235. As long as this zone holds, I expect bullish continuation toward the next resistance levels.
📈 Entry: Current market price (CMP)
🎯 Target: 118,865 – 119,083
🛑 Stop Loss: 116,658 (below key support zone)

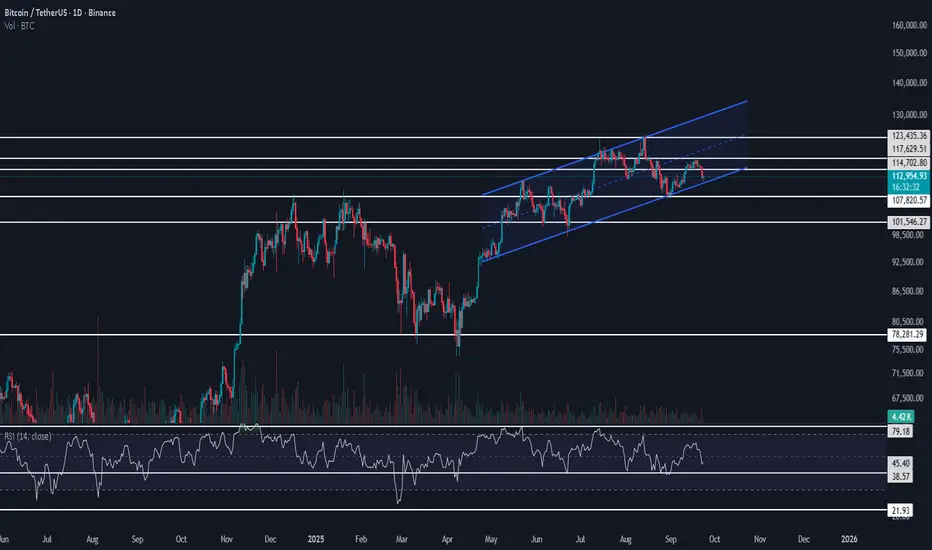
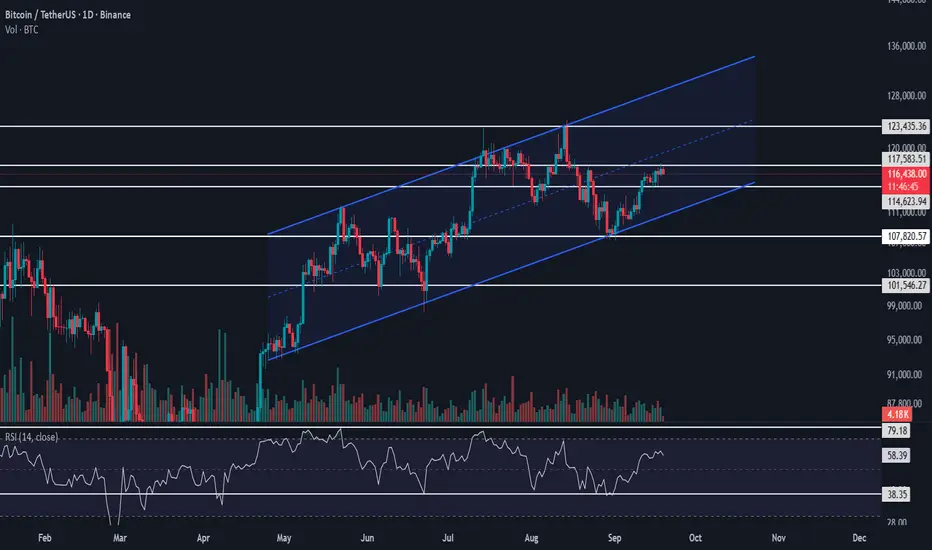
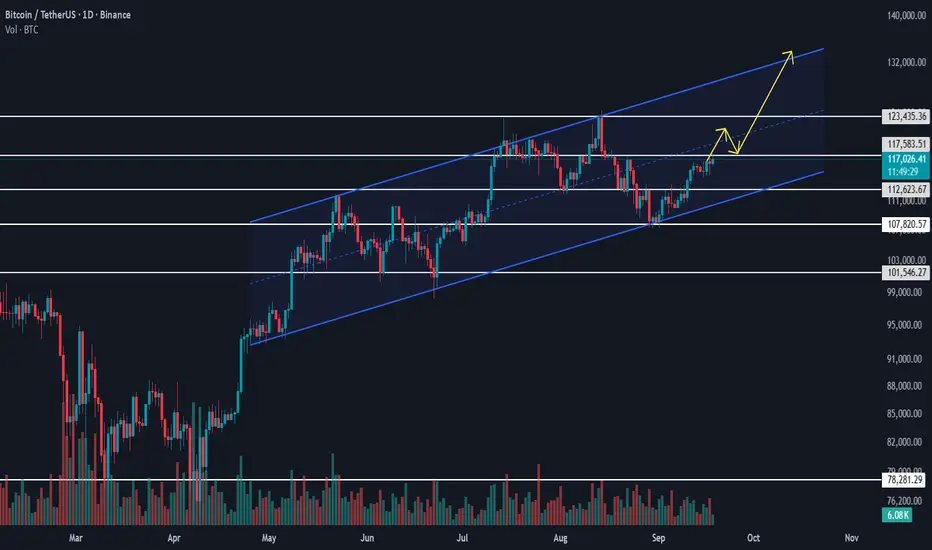
BTCUSDT Analysis – Channel Breakout in FocusBitcoin is currently moving inside an upward channel, where the $107,820.57 level acted as strong support. This level also aligned with the lower trendline of the channel, and price reacted well to it, triggering the latest bullish move.
At present, BTC is facing a critical resistance at $117,583.51, which serves as a potential long trigger. A breakout above this level could accelerate the upside momentum.
Given the expectation of a potential interest rate cut by the Federal Reserve, the crypto market could gain further bullish momentum.
Our main bullish confirmation remains a breakout of $123,435.36, which would validate the continuation of the macro bullish wave count. However, it is preferable to secure entry before price reaches that level in order to optimize risk-to-reward.
📌 Trading Plan: Watch $117,583.51 for a breakout entry. Manage risk properly as volatility is expected to rise with macroeconomic events
#Bitcoin #BTC #BTCUSDT #Crypto #CryptoTrading #TechnicalAnalysis #CryptoMarket #TradingView #Altcoins
Part 4 Institutional Trading Key Terms in Options Trading
Understanding options requires familiarity with several technical terms:
Strike Price: The predetermined price at which the underlying asset can be bought (call) or sold (put).
Expiration Date: The last date on which the option can be exercised. Options lose value after this date.
Premium: The price paid to purchase the option, influenced by intrinsic value and time value.
Intrinsic Value: The difference between the underlying asset’s price and the strike price if favorable to the option holder.
Time Value: The portion of the premium reflecting the probability of the option becoming profitable before expiration.
In-the-Money (ITM): A call is ITM if the underlying price > strike price; a put is ITM if the underlying price < strike price.
Out-of-the-Money (OTM): A call is OTM if the underlying price < strike price; a put is OTM if the underlying price > strike price.
At-the-Money (ATM): When the underlying price ≈ strike price.
How Options Trading Works
Options trading involves buying and selling contracts on exchanges like the National Stock Exchange (NSE) in India, or over-the-counter (OTC) markets globally. Each contract represents a fixed quantity of the underlying asset (e.g., 100 shares per contract in equity options).
The price of an option, called the option premium, is determined by multiple factors:
Underlying Price: Directly impacts call and put options differently. Calls gain value as the underlying price rises; puts gain as it falls.
Strike Price: The relationship of the strike to the current asset price defines intrinsic value.
Time to Expiration: More time increases the option’s potential to become profitable, adding to the premium.
Volatility: Higher expected price fluctuations increase the chance of profit, making options more expensive.
Interest Rates and Dividends: Slightly affect option pricing, especially for longer-term contracts.
Options traders use strategies to profit in various market conditions. They can combine calls and puts to create complex structures like spreads, straddles, strangles, and iron condors.
Popular Options Trading Strategies
Covered Call: Holding the underlying asset and selling a call option to earn premium. It generates income but limits upside potential.
Protective Put: Buying a put on a held asset to limit losses during downturns. Essentially an insurance policy.
Straddle: Buying a call and a put at the same strike price and expiry, betting on high volatility regardless of direction.
Strangle: Similar to a straddle but with different strike prices, cheaper but requires larger movements to profit.
Spreads: Simultaneously buying and selling options of the same type with different strikes or expiries to reduce risk or capitalize on specific movements. Examples include bull call spreads and bear put spreads.
These strategies allow traders to tailor risk/reward profiles, hedge portfolios, or speculate with leverage.
