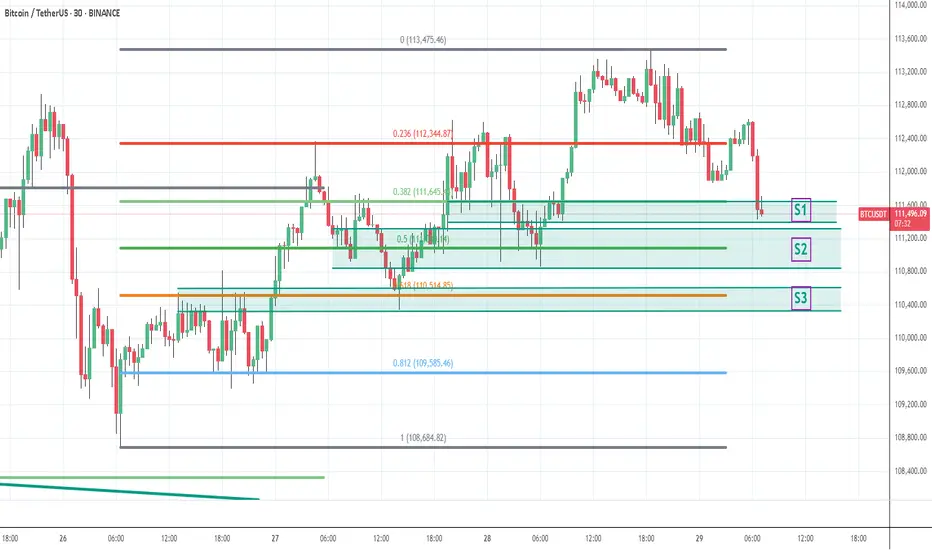
BTC - 29th Aug - collect more qty on every dipswe have monthly expiry and max pain at the top around 117K not sure exactly as it keeps changing some times. I expect any of the mentioned support levels to hold since it went up with demand followed by good data from US and positive equity... long BTC with required enough enough margins so no one can liquidate even during sleeping... weak hands loose btc to whales during dips... collect btc qty on dips... take care, cant predict the exact support levels big players thinking .... But every big players buy every dip when good volume seen for sure
Trade ideas
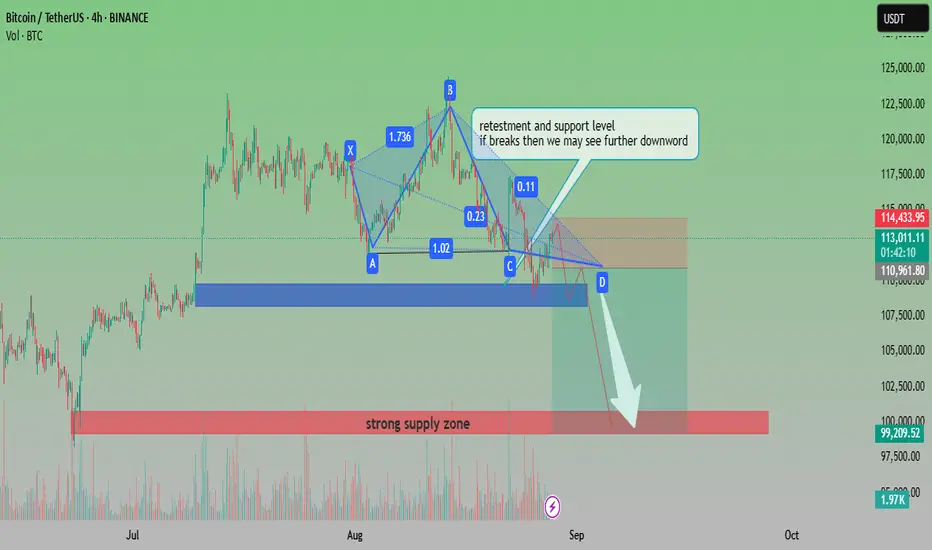
BTCUSDT Bearish Pattern with Key Support RetestAnalysis:
The chart shows Bitcoin (BTCUSDT) forming a harmonic pattern that signals potential bearish continuation. Price is currently retesting a critical support and resistance level around the 113,000–114,000 zone. If this level fails to hold, further downside movement is expected.
Pattern Formation: The harmonic structure (XABCD) suggests a bearish setup.
Support Zone: Around 110,900–111,000, a crucial level to watch.
Downside Target: If support breaks, the price could move toward the 99,000–100,000 strong supply zone.
Volume: A noticeable volume build-up supports potential continuation to the downside.
📉 Outlook: Bearish bias. A breakdown from current retest levels may accelerate selling pressure toward the 100k psychological zone.
Bitcoin Bear OutlookHas the Bitcoin bull run ended? From my outlook, I see a strong push to the downside, followed by a potential retracement back up that could form a head-and-shoulders pattern, adding more confluence to my bearish view.

BTCUSDT.P MEXC H1This BTC/USDT analysis dives into the order flow using Cumulative Volume Delta (CVD) to gauge the real strength behind recent price movements. CVD provides a crucial look "under the hood" by tracking the net difference between aggressive market buys and sells.
Currently, we're observing a potential divergence between price action and CVD. While the price may be showing one thing, the CVD indicates whether conviction from buyers or sellers supports the move. This discrepancy can often be a leading indicator for a potential reversal or trend exhaustion. Let me know your thoughts in the comments!

BTC 1H Long1. Current Price
BTC is trading around 110,879 USDT at the time of the chart.
2. Trendline
• An ascending trendline is drawn from the recent bottom, showing short-term bullish momentum.
• Price is testing support at this trendline.
3. Entry Zone
• Marked slightly above 110,500 USDT.
• Idea: enter long position as price holds above support & trendline.
4. DCA (Dollar-Cost Average) Zone
• Around 109,383.5 USDT.
• If price dips here, it’s a secondary buy zone to improve average entry.
5. Stop Loss (Invalidation)
• “1H Closing Below” ~108,534 USDT.
• If BTC closes below this level on 1H, the long setup is invalid.
6. Targets
• TP1 (Take Profit 1): 114,658 USDT
• TP2 (Take Profit 2): 115,980 USDT
• These are resistance levels where partial or full profits can be booked.
7. Risk-Reward Setup
• Entry around 110,500 → Stop below 108,534 → TP1 at 114,658, TP2 at 115,980.
• This gives a good Risk-to-Reward (RRR > 2) if the setup plays out.
8. EMA Levels
• Multiple EMAs (20/50/100/200) are shown.
• Price is still trading below the EMAs, meaning trend is bearish overall, but this setup is a counter-trend long scalp.
⸻
📌 Summary
• Bullish Scenario: If BTC holds above the entry and trendline, it can push toward 114,658 (TP1) and 115,980 (TP2).
• Bearish Scenario: If BTC breaks below 108,534 on 1H close, the long setup fails, and price may revisit lower supports.

long trade in bitcoinplanning for long at first zone but not aggressive then aggressive swing from the second zone and tp will be current daily lower high and very aggressive position on a weekly biased

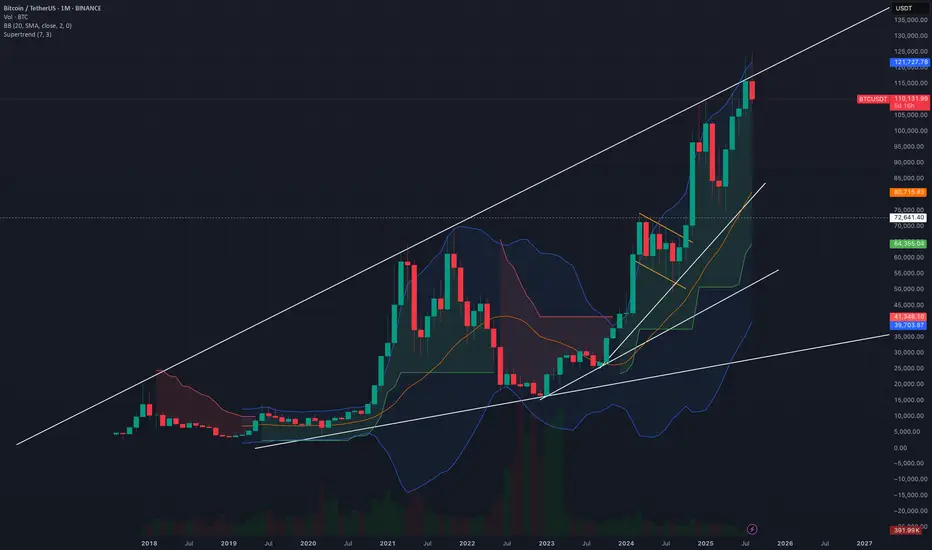
BitCoin? a bit down or big downBitcoin is loosing it fizz now and rally may be about to end.
as per chart reading i can see that it is on the resistance levels
and as now world economies are also settling it should be possible that crypto frenzy get no hype and for that Bitcoin may see a down pludge
Possibly for next 2-2.5 Years Bitcoin won't cross the recent highs and may be retesting 72K level or more downside.
Up move will only continue after breaking and closing above this trendline.
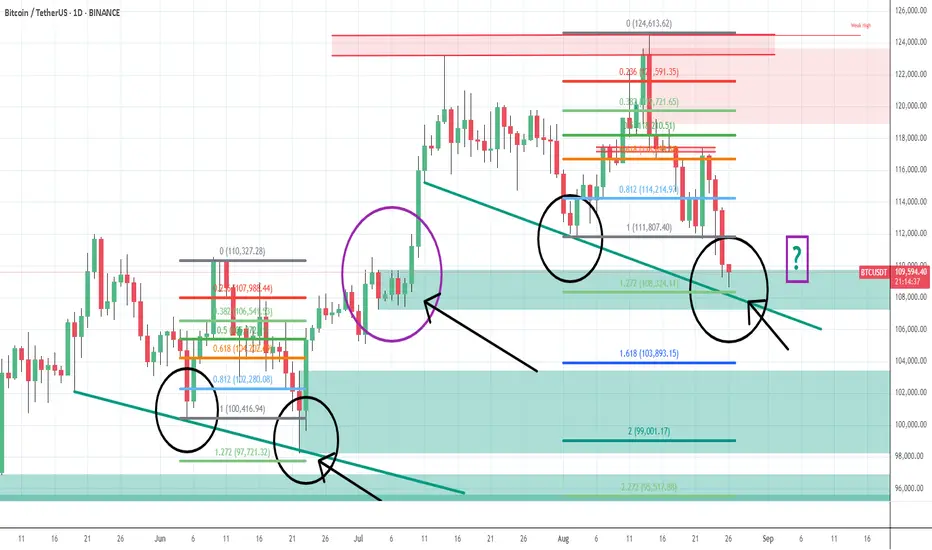
BTC - will bounce and move up only from today low - 26th AugBTC price has reached a crucial technical area from where price will most likely bounce and move up only and wont fall further much. explained in chart with fib levels and what happened in history
[SeoVereign] BITCOIN BEARISH Outlook – August 23, 2025I would like to share my perspective on the Bitcoin short position as of August 23.
The basis for this idea is twofold.
First,
the upward movement in the 118,684 ~ 117,435 range appears to be an impulse.
The reason is that wave 5 forms a 1.272-length ratio of wave 1.
Second,
if you look at the red trendline, you can see that the downside breakout has begun.
Therefore, I believe that adopting a bearish perspective is more reasonable.
The target average price for this position is 114,340.
I hope you achieve good results.
I will continue to track price movements and update this idea to monitor future trends as well.
Thank you.

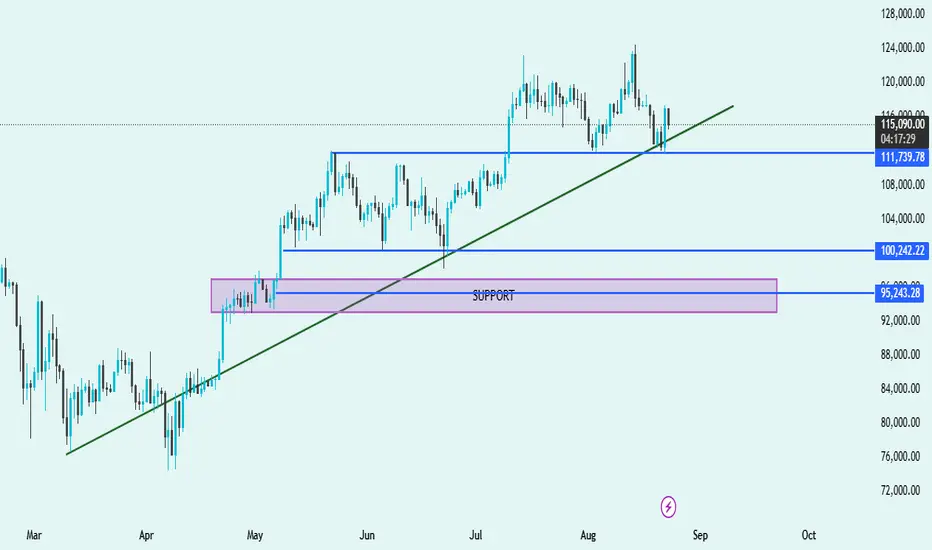
BTC/USDT Technical Analysis – Key Levels & Trend Outlook📊 BTC/USDT Technical Analysis – Key Levels & Trend Outlook 🚀📉
🔹 Trend Structure
Price is currently trading above the trendline, suggesting bulls are still in control, but momentum has weakened.
🔹 Support Zones
Immediate Support: 🔵 $111,739
Price recently tested this level and bounced, showing demand from buyers.
Key Mid-Support: 🔵 $100,242
Strong historical level where buyers stepped in multiple times.
Major Demand Zone: 🟪 $95,243 – $96,500
Highlighted purple support box; this is a critical accumulation zone where bulls are likely to defend strongly.
🔹 Resistance Levels
Near-term resistance: Around $120,000 – $124,000 (recent swing highs).
A breakout above this zone could fuel a new bullish rally.
🔹 Market Outlook
✅ Bullish Bias as long as price respects the green trendline and stays above $111,739.
⚠️ If the price breaks below $111,739 and the trendline, expect a deeper pullback toward $100,242 or even the major demand zone $95,243.
🚀 A breakout above $120K will signal strong continuation to new highs.
📌 Summary:
Trend: Uptrend ✅
Key Supports: $111,739 → $100,242 → $95,243
Resistance: $120,000 – $124,000
Bias: Bullish above $111K, cautious below 🔻
Bit Coin Sell tradeBit coin became bearish after giving break down of Golden Reversal level . we were expecting it to reverse from Golden Reversal to continue Bullish moment ,
Bit coin instead gave break down of Golden reversal and become bearsish from golden reversal 900 points done .. target 1 and target 2 are marked on the chart . by mistake i post very big sl .. the sl here is 115850

BTC/USDT – Support Bounce Long IdeaMarket is showing signs of holding at a key support zone after multiple tests.
Buyers are stepping in with rejection wicks, suggesting a potential bounce toward higher levels.
Watching for continuation momentum as long as this support remains protected.

Patience is the key of success This is a BTC/USDT (1H timeframe) chart with some key technical setups:
⸻
1. Downtrend Channel
• The price had been moving inside a falling channel (red parallel lines).
• Recently, BTC broke out of this channel to the upside, showing bullish strength.
⸻
2. Support & Resistance Levels
• Immediate Support Zone: Around 115,078 – 115,600 USDT (white horizontal lines).
• Immediate Resistance Zone: Around 118,165 – 119,810 USDT (orange & red lines).
• Major Resistance: 122,800 USDT.
• Major Support: 111,100 – 111,600 USDT.
⸻
3. Indicators
• EMAs (20/50/100/200) are plotted.
• Price recently bounced strongly from the lower support, pushing above short-term EMAs, which is often a bullish reversal signal.
⸻
4. Trade Setup (Highlighted Zone)
• The green zone = Long (buy) trade area.
• The red zone = Stop-loss zone.
• Entry is near 116,000 – 117,000.
• Target 1: Around 118,165.
• Target 2: Around 119,810.
• If momentum continues, extended target could be 122,800.
⸻
5. Volume
• Strong buying volume spike at the breakout, confirming bulls stepped in aggressively.
⸻
✅ Summary:
BTC just broke out of a falling channel with strong volume. As long as it stays above 115,000 support, bulls could push toward 118,000 – 120,000, and possibly 122,800. A breakdown below 115,000 would invalidate this setup and risk retesting 111,000 support.

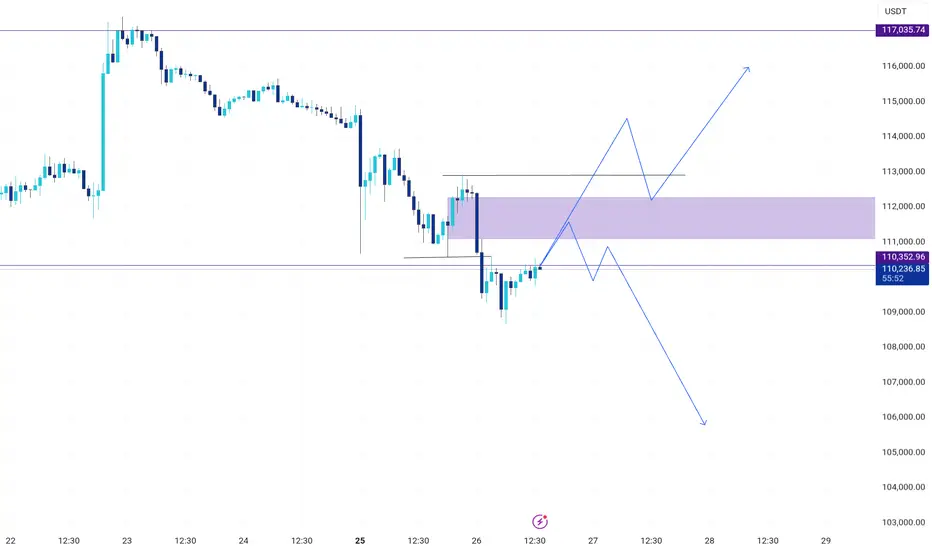
BTC: 22-Aug-2025I feel BTC should rise to the levels in the chart and then change of swing should happen. If this happens then we may see a downside as marked.

Buy BTC for 10K up move - Price Action confirmationLast few days multiple false news were spread in middle of correction.
Deliberate sell off by big players to trap the retailers etc etc
joined with US FOMC meetings etc only played down side which is
not technical.
I predict price tracing back to 124K asap.
Bitcoin is Digital Gold. At the same time keep long qty with liquidation level as
low as 105 or 100 or 95 K so no one can liquidate you....
Keep Booking profits and re enter at every dip.... rock it my friends

BTC: last summer update Hello,
Following my previous post, BTC is rallying.
The hypothesis of a premature end of this season flew away with the arrival of late Altcoin season.
As explained in the related analysis, the positive market sentiments is leading coin's prices to new ATH.
On the Big BTC, the drawdown on first days of august was due ti high liquidations in ETFs. The news and corporate's declared interest has speed up investor trust and attracted new player which pump the demand and so, the price.
The last target, from 2021 cycles were around 120-124K. I gotta say, taken ✅
The liquidity recovers brought BTC to the new levels.
What's now ?
looking at the bullish trend, the price may reach 125-130K in the short term. Sustained by the fibo's levels approach, the high volume of liquidation around 125k and the increasing OI.
The sentiment, which is known to be essential in a crypto analysis so far, and the fear&greed index, show high bullish momentum for the crypto king.
Moreover, BTC is the cryptocurrency with the lowest VIX index, around 3-1% in the past days, the first crypto after stablecoins. This proven what said since now.
Targets :
• 125-130K area for the last short term target
• Followed by 132K on a weekly based
Prioviuos target, so POI and POL left behind from the Short term cycles are :
• around 137K, from the April cycle
• around 142K, from June leg up
Lets see,
M

BTC Consolidating, Ready to Blast Towards 130K?BTC/USDT is still holding within its uptrend channel , with strong support around 112.3K and key resistance at 123K–125K. After hitting an all-time high near 124.5K, the price pulled back to 112–115K for consolidation, building a base for the next rally.
On the news side, the market is getting strong support as the US officially allows Bitcoin in 401(k) retirement plans and has set up a Strategic Bitcoin Reserve . At the same time, spot Bitcoin ETFs continue to attract massive inflows, pushing total assets above $150 billion in just 18 months. This shows rising institutional confidence, despite short-term corrections.
The preferred scenario now is to look for buy opportunities around 112–115K , targeting a rebound to 123–125K, and if that breaks, the next destination could be 130–135K.
On the flip side, a defensive strategy should be considered if BTC falls below 110K, as this is a crucial level for maintaining the medium-term uptrend.

Bitcoin is Bullish or Bearish - 20th Aug 2025First, In my previous charts mentioned take long with money management. I didnt expect this much of fall and i had to cut my longs to hold the rest. Technically no answer for this fall since its mad short selling and group games or big players selling to get liquidity before they buy. They are buying at every dips in very large qty. Exchanges buy sell as well to kill and eat others
Price is at previous tested proved support. Any analyst can only suggest buy this dip and to be 100% security allow price to test the support again and then buy based on reaction. Support and Resistance are tested and will hold or breakout as well right. In my view for Bitcoin every previous proved support should not break since whales buy and rise the price. Not sure who is that whales selling causing support to break. In news I didnt see or knowing how is that big player sold causing price to drop this much. Stay Safe, I am doing my best or suggesting what I am also doing. God Bless Bitcoin traders.

BTCUSDT: Holding Support, Waiting for a Breakout to 127,500Bitcoin continues to move within an uptrend structure, with the 112,200 USDT zone acting as a key support, aligning with the ascending trendline. The repeated rebounds from this level indicate that buying pressure remains steady.
On the upside, the 127,500 USDT zone stands as a strong resistance that must be broken to extend the bullish momentum. As the price approaches this area, traders should closely monitor the reaction to determine whether a breakout or a short-term pullback will occur.
Overall, the technical structure still favors the bulls. A sensible strategy is to accumulate during retracements around 112,200 – 114,000, and hold positions for a short-term target at 127,500. If this level is breached, the bullish wave will be further reinforced.

It's Time to get fully Bearish on Bitcoin for next 3 years.I think this bull cycle is over now and now its time to get bearish on Bitcoin till 2028.
My targets of bitcoin for next three years is 76000 dollar or possibly 56000 dollar is conditions get worse.

BTCUSDT: Continued Growth in the Short TermBTCUSDT is currently trading within a stable price range, with a clear uptrend channel forming. After bouncing off the strong support at 116,000 USD, BTCUSDT is likely to continue its bullish momentum, with the first target set at 123,000 USD.
The latest news from the cryptocurrency market shows a growing confidence in Bitcoin, driven by positive signals from major financial institutions. Recent price corrections have created good buying opportunities for investors. The global economic situation, particularly the weakening of the USD and increasing institutional adoption of Bitcoin, is driving BTC's value higher.
Trading Strategy:
Buy: Enter a buy position when the price approaches the 116,000 USD support level again or breaks above 117,000 USD.
Stop-loss: Set a stop-loss below the 116,000 USD support level to protect in case of a reversal.
With the current market structure and supportive factors from both news and technical analysis, the bullish trend of BTCUSDT is highly likely to continue in the near term.

BTC - 18th Aug Before US Open - Dump & Pump or Dump ?History was repeating exactly till half of 5th wave but market considered new ATH as possible profit booking and sold off instead of going in to parabolic up move. The exact place where it has to start the parabolic up move it got dumped. Either its due to CME close and few market players doing false move or its sure dump or lack of buying at these high price or ETH got importance instead of BTC. In this cycle ETH, SOL and XRP and few mother crypto pulling the liquidity and BTC missing those money. Need to wait and watch today and this week. Right now price is still at swing low from where it can move to new ATH to 127 and 130K.
