googl inc long entry but for long termmentioned this zone in 1 day time frame but showing you in 1 week, don't get confused
let's hope it comes to somewhere near it
Trade ideas

GOOG📊 NASDAQ:GOOG Weekly Chart | CMP: $180
🔺 Triangle breakout still pending
🕵️♂️ Watching closely near key levels
📈 Range:
▪️High: $206.56 (Feb 2025)
▪️Low: $140.36 (Apr 2025)
📉 Stop Loss: $150
🎯 Target: $300 in 12–18 months
Breakout confirmation could open strong upside potential.
#GOOG #Alphabet #Stocks #TechnicalAnalysis #Investing

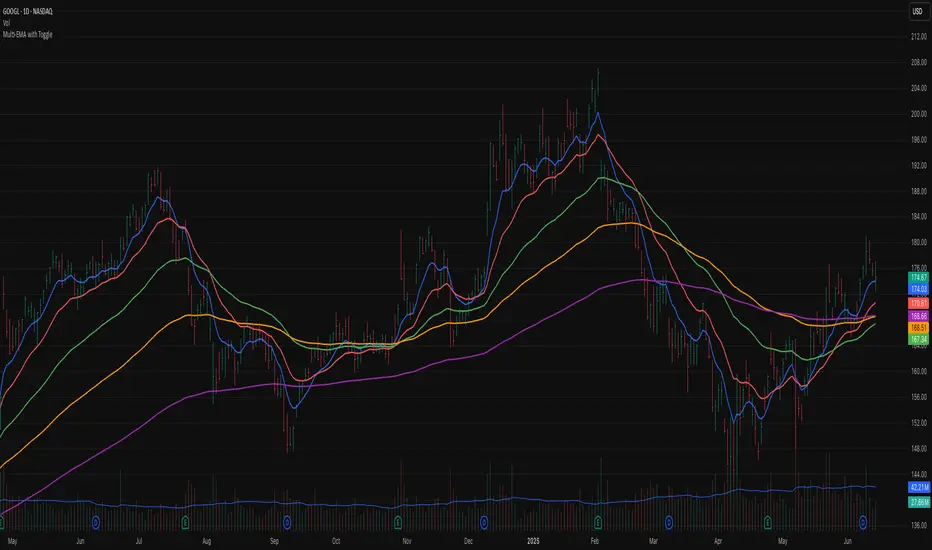
Multi-EMA Toggle Indicator A clean and versatile Exponential Moving Average (EMA) indicator featuring 5 fully customizable EMAs with individual toggle controls. Perfect for traders who want flexibility in their moving average analysis without cluttering their charts.
Key Features
✅ 5 Independent EMAs - Each with its own settings and controls
✅ Toggle On/Off - Show only the EMAs you need
✅ Customizable Periods - Set any period for each EMA
✅ Color Selection - Choose distinct colors for easy identification
✅ Clean Interface - Organized settings with grouped inputs
✅ Overlay Display - EMAs plot directly on your price chart
Default Settings
EMA 1: 9 periods (Blue)
EMA 2: 21 periods (Red)
EMA 3: 50 periods (Green)
EMA 4: 100 periods (Orange)
EMA 5: 200 periods (Purple)
Use Cases
Trend Analysis - Identify short, medium, and long-term trends
Support/Resistance - EMAs often act as dynamic support and resistance levels
Entry/Exit Signals - Monitor price crossovers with EMAs
Multi-Timeframe Analysis - Use different EMAs for different trading styles
Clean Charts - Toggle off unused EMAs to reduce visual clutter
How to Use
Add the indicator to your chart
Open settings (gear icon)
Customize each EMA's period, color, and visibility
Toggle EMAs on/off based on your analysis needs
Save your preferred setup as a template
Perfect For
Day traders needing quick trend identification
Swing traders tracking multiple timeframes
Position traders monitoring long-term trends
Anyone wanting a clean, customizable MA setup
GOOG: Don't Miss This Potential Reversal!GOOG Long Idea
Chart Analysis:
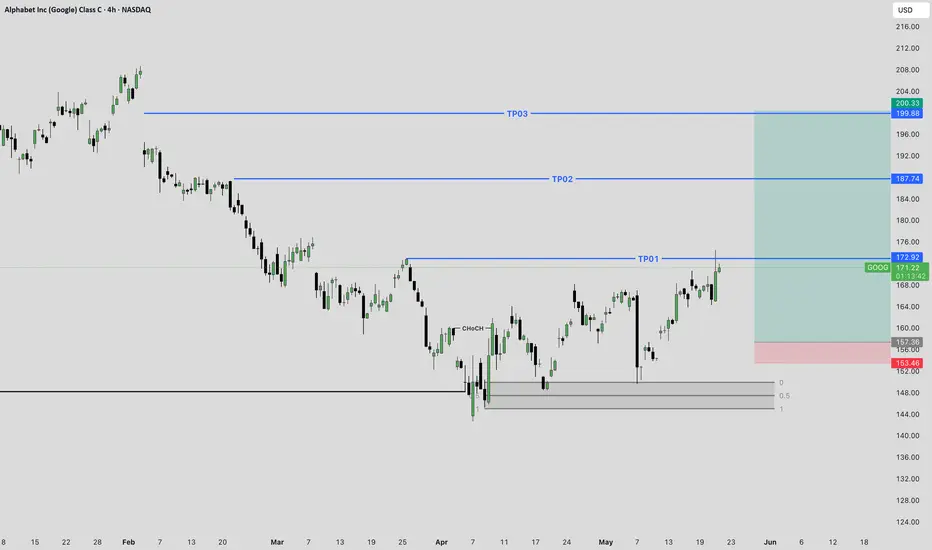
The chart shows Alphabet Inc. (GOOG) on a 4-hour timeframe. After a period of decline from its highs, GOOG appears to be finding support around the "Weekly Liquidity" level. There's also a recent bullish impulse from this area, breaking above some minor resistance. The chart identifies three potential "TP" (Take Profit) levels.
Trading Idea:
Entry: Look for a sustained move above the TP01 level ($172.92) or a clear retest and bounce from the current price area after confirming demand. Given the current price is $171.19, a move above TP01 would confirm further bullish momentum.
Stop Loss: Place a stop loss below the recent lows and the "Weekly Liquidity" zone. The chart suggests a stop loss around $153.48 or $152.00, below the 0.5 and 1 Fibonacci levels from the recent bounce.
Take Profit Targets:
TP01: $172.92 (already near or touched)
TP02: $187.74
TP03: $200.33 - $199.38 (a strong resistance zone)
Rationale:
Weekly Liquidity: The price has found support at a significant weekly liquidity level, suggesting potential for a reversal.
Bullish Structure: The recent price action from the weekly liquidity area shows signs of a bullish structure, with higher lows and a break of minor resistance.
Target Levels: The TP levels are strategically placed at previous resistance zones or significant price levels, offering clear profit targets.
Risk Management:
Risk-Reward: The potential risk-reward ratio for this trade appears favorable if targeting TP02 or TP03.
Position Sizing: Always use appropriate position sizing to manage risk effectively.
Monitor Price Action: Continuously monitor price action for any signs of weakness or reversal, especially around the TP levels.
Disclaimer: This is a trading idea based on the provided chart and should not be considered financial advice. Trading involves substantial risk, and you could lose money. Always conduct your own research and analysis before making any trading decisions.
Google: A compelling buy at the current priceHello,
As Warren Buffett famously said, "Be fearful when others are greedy, and greedy when others are fearful." This mindset is particularly relevant right now with Alphabet Inc.
Despite being a company whose products we use daily—and will likely rely on even more in the future—Alphabet's stock recently declined following comments from Apple’s Eddie Cue regarding a drop in Safari search traffic. This has sparked concerns about Google's dominance in search and its ad revenue streams. Analysts are also highlighting growing competition from AI-driven platforms such as OpenAI, Grok, and Perplexity, raising questions about the future growth of Google Search.
While the headlines may seem discouraging, we remain confident in Google’s enduring leadership in the search space, underpinned by its unmatched scale, infrastructure, and user base. We also believe the market continues to underestimate how far ahead Google truly is in artificial intelligence.
In our view, this dip represents a strategic buying opportunity for long-term investors. Below is our in-depth analysis of Alphabet and why we believe it remains a strong investment.
Alphabet, Inc is a holding company, which engages in the business of acquisition and operation of different companies. Google Services includes products and services such as ads, Android, Chrome, devices, Google Maps, Google Play, Search, and YouTube. Google Services generates revenues primarily from advertising; fees received for consumer subscription-based products such as YouTube TV, YouTube Music and Premium, and NFL Sunday Ticket, as well as Google One; the sale of apps and in-app purchases and devices.
KEY NOTES FROM THE Q1 2025 EARNINGS CALL
Revenue up to $ 90.23 Billion (Q1 2024: $ 80.54 Billion)
Operating income for quarter one 2025 at $ 30.61 Billion (Q1 2024: $ 25.47 Billion)
Net income for quarter one 2025 at $ 34.54 Billion (Q1 2024: $ 23.66 Billion)
Diluted Earnings per share closed at $ 2.81 as at 31st March 2025 (2024: $ 1.89). Alphabet’s Board of Directors declared a quarterly cash dividend of $0.21 representing a 5% increase from the previous quarterly dividend of $0.20.
Cash and cash equivalents remained flat as of the end of March 31 2025 at $ 23.26 Billion (2024: $ 23.47 Billion)
Google advertising continues to do the heavy lifting for the alphabet business contributing $ 66.89 Billion of the total $90.23 Billion. Google Services includes products and services such as ads, Android, Chrome, devices, Google Maps, Google Play, Search, and YouTube. Of this amount, the breakdown is as below
Google search & other: $ 50.70 Billion
Youtube ads: $ 8.93 Billion
Google Network: $ 7.26 Billion
Other services offered by the platforms contributed revenues as below
Google subscriptions, platforms & devices: $ 10.38 Billion
Google cloud: $ 12.26 Billion
Other bets: $ 450 million. Other Bets is a combination of multiple operating segments that are not individually material.
Hedging gains: $ 260 million
The company announced a share buyback program of up to $70 billion of its class A and class C shares. The buy backs will be executed through open market purchases or through privately negotiated transactions.
Business Opportunities/Strengths
Alphabet’s advertising business is firmly embedded in digital advertising budgets, allowing it to capitalize on the ongoing growth in digital ad spending.
The significant cash flows from advertising enable Alphabet to reinvest in growth areas like Google Cloud, AI-enhanced search, and innovative ventures such as Waymo. (Waymo is Alphabet's autonomous driving technology subsidiary, focused on developing self-driving cars and related technologies.)
With a strong foothold in the public cloud market, Alphabet has a substantial opportunity as a major provider for enterprises transitioning to digital platforms.
Risks to consider
Although Alphabet is working to diversify, text-based advertising remains its primary revenue source, presenting a concentration risk.
Ongoing investments in emerging, sometimes unproven technologies through its Other Bets segment continue to strain cash flows.
Increasing regulatory scrutiny of Alphabet's search dominance worldwide could lead to significant market disruptions through structural reforms.
Recommendation
We view Alphabet as a solid business with diverse solutions ranging from advertising, cloud business and driverless cars as well. While we acknowledge that the antitrust cases have continued to make headlines, we encourage investors to remain invested and focused on the business’s strengths. The business has unique products that will have the ability to remain leaders for a very long period of time. Android is the operating system for the majority of the world’s smartphones with more than two-thirds of all smartphones in the world running it. Virtually all smartphones, other than those manufactured by Apple, run on Android. We see this remaining as a google strength for a very long time. The Google Play Store’s unmatched ecosystem creates significant barriers for competing operating systems, limiting their access to critical applications. The recent correction on US technology companies provides us with a solid buying price for some of these great companies. Alphabet alone corrected by about 31% and has since bounced back.
We see the current price as a great entry price for long term investors based on both technical and fundamental analysis with a target price of $ 203.

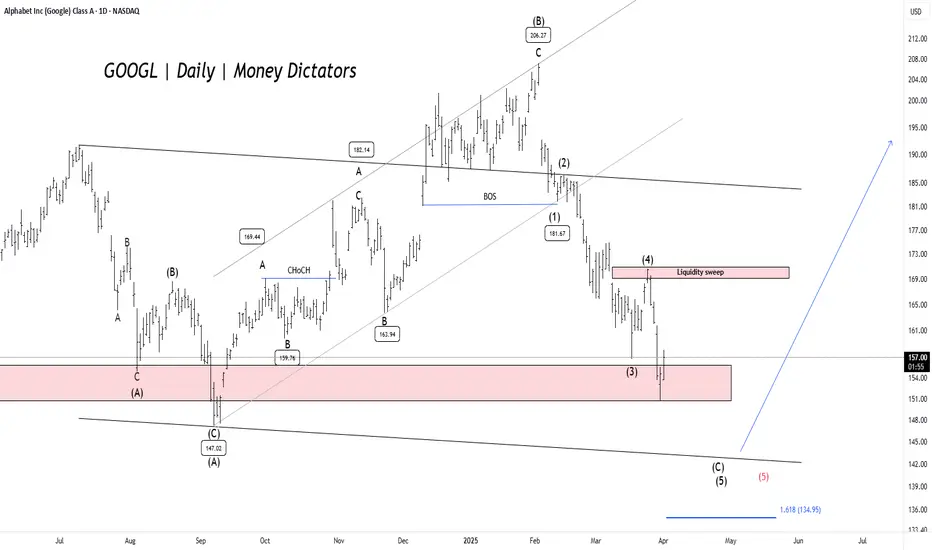
GOOGL - Elliott Wave Final ShowdownGOOGL has dropped over 27.28% , reaching a minor profit-booking zone. The $150 level serves as a key demand zone, where a potential price reversal could occur. The formation is either expanded flat or a running flat on the daily timeframe chart.
Confirmation is best observed near the lower trendline of the parallel channel. If bearish momentum persists, prices may decline further to the $142-$140 range before a strong rebound. Once the correction ends, the upside targets are $168, $180, and $195.
A new low will form if the previous low is breached. Further research will be uploaded soon.
GOOGLE - SWING TRADE IS GOING TO HAPPENGOOGLE - SWING TRADE IS GOING TO HAPPEN
Entry would be around 146 and SL is 130 for the target all time high.
Disclaimer: This is just for educational purpose.

Google Head And Sholder - Easy target 186 in coming monthGoogle has been making reverse head and shoulder pattern in the last 3-4 months once it breaks 169$ mark it will easily reach 186$ within no time.

GOOGL looks like it found a support. 2025 bullishGOOGL is showing a nice reversal hammer candle. Looks good considering it completely recovered the monthly MA4.
Very strong indicator for continuation
NFA - bullish

I believe GOOGL will be $260 around June2025This chart looks bullish if ES and SPY continue to chug steadily higher.
I said last year that we were entering a 3-4 year bull market, but most still worried about the "impending crash" - which never happened.
Japan wasn't even really a crash either and we recovered all that in weeks.
So that being said, NASDAQ:META NASDAQ:TSLA NASDAQ:NVDA and Our GOOGL should all basically double from here.
That is all my opinion. I'm great at determining direction with precision and am able to find the most ideal contracts for my trading style. My Tradingview posts are transparent to offer my thought process live and in the moment. Examples of excellent predictions include XAU/USD, CVNA, SMH, and many more over hundreds of % in both stock shares and in options I traded. This is just me.
Not Financial Advice

Goog is awlays good investment idea .On weekly chart it still in upstreand and it looks good for long term for next immedate target of 202/227 then its need to review

GOOGLE SETUP TRADE WIH 1:5 RISK REWARDGOOGLE SETUP TRADE WIH 1:5 RISK REWARD
A good BUYING setup detected on GOOG
It's showing a BULL MOVE due to these reason
1. It's following THE 30 M trendline here
2. It's ready to break the neckline
3. it forming a accending triangle pattern over here
Just grab out will your own risk
4. also in day chat its showing its trying to break the trendline
it will consolidate here but after breakout the upcoming move will be OSM
With a small amount
Stay connected
Stay happy

GOOGSince Oct 2021 GOOG has been sideways and bearish
however after making low in Aug 2022 it's been sideways earlier and now it may try to move up
this is not going to be easy but bulls may take it up
expecting 122-125 in this move

Google Working on Most trusted Pattern Google Working on move Most trusted Pattern N Pattern Still Target Open


Google Long term target 200+Few months back it hits it lower support level of 88 and broken out of long term resistance level.
Now the long term targets are 150 - 175 - 190 - 210
View is for next 2-3 years.

Alphabet Inc (Google) Class C Daily Candle AnalysisAlphabet Inc (Google) Class C
daily candle looks price can up till 111 with the stop loss of 112.8 for the target of 92
which is the best place to take short position
as mkt in a clear short direction

Buy buy Look at this chart.
Hellos guys. Good evening. It is at its support zone as of now it is trying for long term buying. Go with flow at your own risk.
Thank you❤

Google Cup & Handle Pattern Google has formed Cup Handle Pattern on daily timeframe chart. This is bullish pattern, we can take swing trade here.
Entry:
We can go Long after close of bullish candle above the resistance zone as marked on chart.
Target:
Usually for Cup & Handle Pattern target is equal to the depth of cup, we are going to keep the target near the next resistance zone.
Stoploss:
We can keep the stoploss below the resistance zone.

Google Important Levels for Next weekwe can expect a positive move in Google stock next week. The next resistance level is at 112, which means that the stock price may face some resistance when reaching this level.
If the stock price is unable to sustain the 100.5 level, the immediate support level is at 90. This means that if the price falls below 100.5, there may be some buying interest at the 90 level, which could potentially prevent the stock from falling further.

Google ready for above 100 , cup and handle Google ready for above 100 , cup and handle chart pattern is being generating

Google - Beautiful BreakoutTech stocks seem to have bottomed..
FB jumped..Microsoft jumped..Google breaks above the 200EMA + breaks above the channel with a gapup..this is super bullish for me..
I think its time to get a little aggressive in the markets in general if these breakouts can hold..
Watch for tech to atleast have a good bear market rally if nothing else.
If you trade google its a long with a stoploss below 102.

GOOGL on crucial levelGoogle is trading near crucial support of 85. It is crucial because of the history of the chart. Price bounced and rebounded more than 8 times from the same level on. It is also trading at a lowest price to earning ratio of 17.5 with a net margin of 20%.
In summary, price says fundamentals have more room to correct. Fundamentals say the worst is almost over. So it is a good time to deeply study the company and chart.
All figures are just rough estimates.
