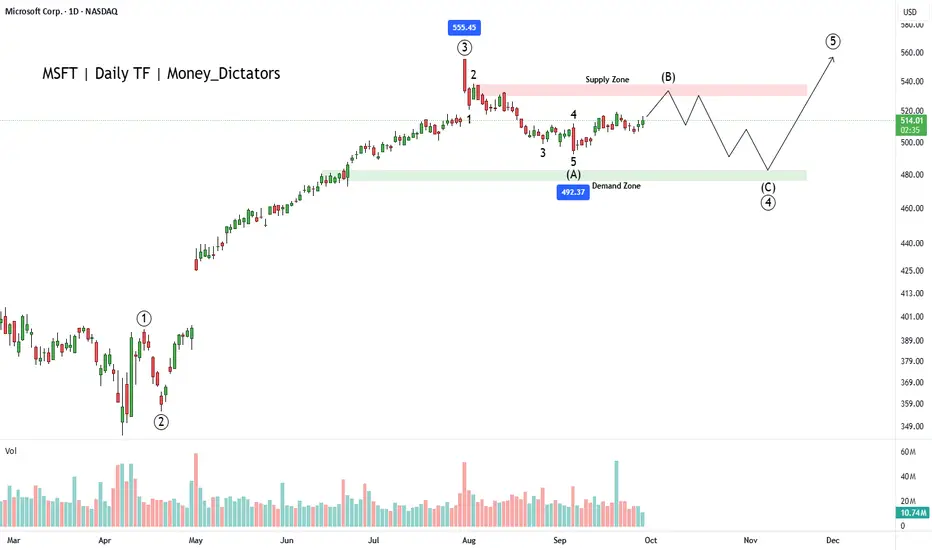
MSFT will hit 625-630MSFT is almost completed correction in 4th wave, and is eying for 625-630 run in coming months.
At the moment base seem to have created, any daily close above 520 will be bullish !
Microsoft Corp.
No trades
Next report date
—
Report period
—
EPS estimate
—
Revenue estimate
—
16.05 USD
101.83 B USD
281.72 B USD
7.32 B
About Microsoft Corp.
Sector
Industry
CEO
Satya Nadella
Website
Headquarters
Redmond
Founded
1975
IPO date
Mar 13, 1986
Identifiers
3
ISIN US5949181045
Microsoft Corp engages in the development and support of software, services, devices, and solutions. It operates through the following business segments: Productivity and Business Processes; Intelligent Cloud; and More Personal Computing. The Productivity and Business Processes segment comprises products and services in the portfolio of productivity, communication, and information services of the company spanning a variety of devices and platform. The Intelligent Cloud segment refers to the public, private, and hybrid serve products and cloud services of the company which can power modern business. The More Personal Computing segment encompasses products and services geared towards the interests of end users, developers, and IT professionals across all devices. The firm also offers operating systems; cross-device productivity applications; server applications; business solution applications; desktop and server management tools; software development tools; video games; personal computers, tablets; gaming and entertainment consoles; other intelligent devices; and related accessories. The company was founded by Paul Gardner Allen and William Henry Gates III in 1975 and is headquartered in Redmond, WA.
Related stocks

Why MSFT Could Be a Smart Pick in 2025?MSFT has bullish signals from the multiple moving averages, RSI and volume analysis. However, wave principle asks evidence from the buyers. The wave count suggests that the corrective wave (B) is ongoing, and bears will control the final wave of the primary wave 3.
Wave C will start falling nearby
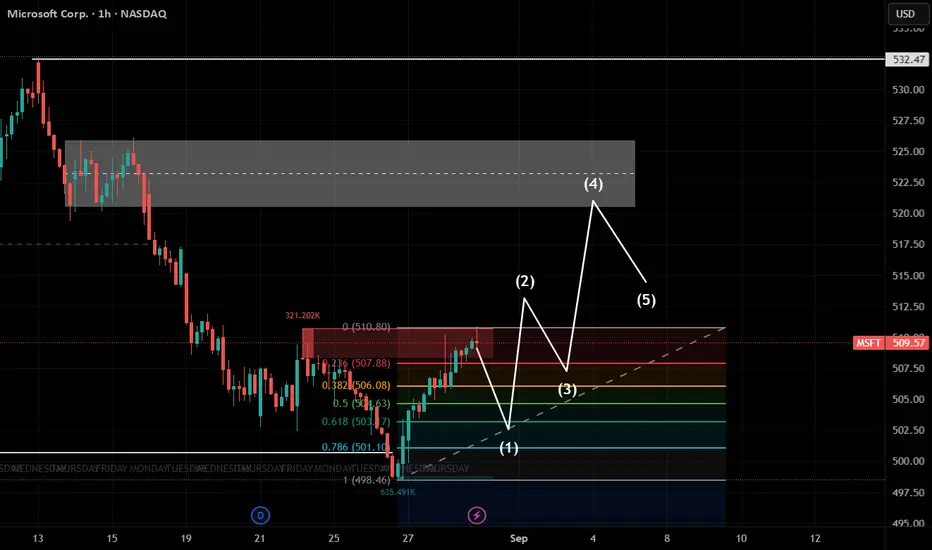
microsoft stock updatemicrosoft stock grab previous liquidity 501$. stock in demand zone aera.to take long position wait for retracement area and take. premium(resistance)area is 520$ to 532$
1st target = 520$
2nd target = 532 $
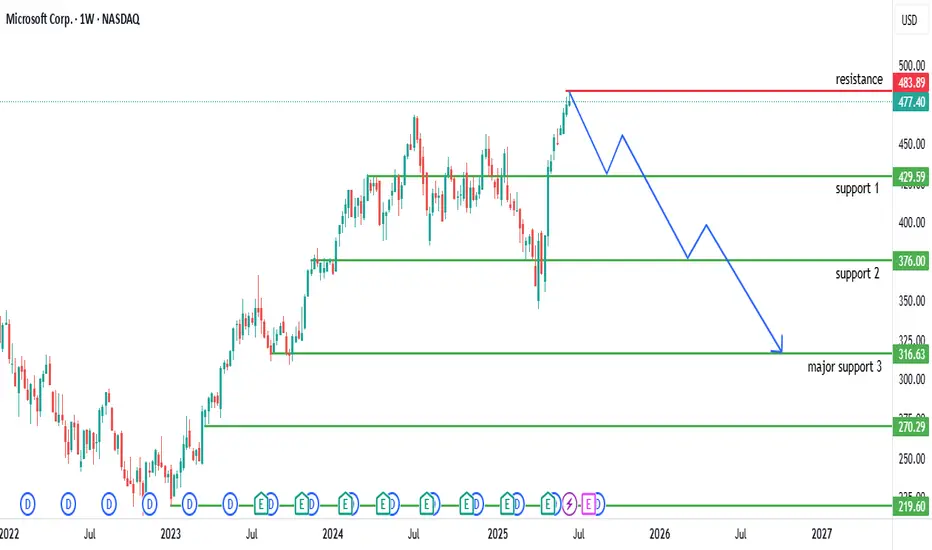
Analysis of Microsoft Corp. (MSFT) Weekly ChartHistorical Trend: The chart illustrates Microsoft Corp.'s stock price on a weekly timeframe from 2022 to mid-2025. The stock showed a steady upward trend from 2022 to early 2025, reflecting strong growth driven by its dominance in software and cloud computing.
Key Levels:
Resistance: The $483.8
Market bubbles are for real !MSFT vs CAT returns after the peak of 2000’s, The Dot Com Bubble! CAT has outperformed to the date. For a rough idea MSFT has given 800% vs CAT has given 1500% since 2000’s.
This does not mean the same will happen in the next 25 years. This ratio chart of MSFT/CAT shows that market bubbles are for

MSFT Support on Weekly MA20, $515 Price TargetMSFT hasn't missed an earnings since before 2024.
Weekly chart looks strong. On the 1 hour you can see they went low for a last liquidity grab.
ER tonight if positive reaction can make the stock go to 480-500
This feels all around bullish to me and they are also to announce partnership progress


Microsoft (MSFT) Trade Setup: Swing TradeCurrent Price: $431.97
Risk-Reward Setup: Risk $10 to potentially gain $40.
Entry Point:
The price is currently hovering at $431.97. This level seems to be consolidating after a recent upward move, likely providing a decent entry point if the market remains bullish.
Stop Loss:
Stop Loss

Breakout stock-Microsoft corporationStock has been analyzed based on my trendline analysis. Please note that levels given are for training and educational purpose only. Please do consult your financial advisor before investing in the stock

Microsoft CorporationIf the technicals of this stock are really respected by the market, there is easily 10% safe upside for this stock.It came down because of the Japanese Interest rates increase, but that is already factored into the market. Even the first support level is very well respected by the stock
Let's see if

See all ideas
Summarizing what the indicators are suggesting.
Neutral
SellBuy
Strong sellStrong buy
Strong sellSellNeutralBuyStrong buy
Neutral
SellBuy
Strong sellStrong buy
Strong sellSellNeutralBuyStrong buy
Neutral
SellBuy
Strong sellStrong buy
Strong sellSellNeutralBuyStrong buy
An aggregate view of professional's ratings.
Neutral
SellBuy
Strong sellStrong buy
Strong sellSellNeutralBuyStrong buy
Neutral
SellBuy
Strong sellStrong buy
Strong sellSellNeutralBuyStrong buy
Neutral
SellBuy
Strong sellStrong buy
Strong sellSellNeutralBuyStrong buy
Displays a symbol's price movements over previous years to identify recurring trends.
ATVI5026499
Activision Blizzard, Inc. 2.5% 15-SEP-2050Yield to maturity
6.34%
Maturity date
Sep 15, 2050
ATVI4499883
Activision Blizzard, Inc. 4.5% 15-JUN-2047Yield to maturity
6.31%
Maturity date
Jun 15, 2047
See all MSFT bonds
Frequently Asked Questions
The current price of MSFT is 429.00 USD — it has decreased by −0.23% in the past 24 hours. Watch Microsoft Corp. stock price performance more closely on the chart.
Depending on the exchange, the stock ticker may vary. For instance, on BVL exchange Microsoft Corp. stocks are traded under the ticker MSFT.
MSFT stock has fallen by −7.28% compared to the previous week, the month change is a −11.93% fall, over the last year Microsoft Corp. has showed a −0.58% decrease.
We've gathered analysts' opinions on Microsoft Corp. future price: according to them, MSFT price has a max estimate of 730.00 USD and a min estimate of 450.00 USD. Watch MSFT chart and read a more detailed Microsoft Corp. stock forecast: see what analysts think of Microsoft Corp. and suggest that you do with its stocks.
MSFT reached its all-time high on Oct 28, 2025 with the price of 550.00 USD, and its all-time low was 43.68 USD and was reached on Jul 30, 2014. View more price dynamics on MSFT chart.
See other stocks reaching their highest and lowest prices.
See other stocks reaching their highest and lowest prices.
MSFT stock is 1.79% volatile and has beta coefficient of 0.97. Track Microsoft Corp. stock price on the chart and check out the list of the most volatile stocks — is Microsoft Corp. there?
Today Microsoft Corp. has the market capitalization of 3.20 T, it has increased by 8.21% over the last week.
Yes, you can track Microsoft Corp. financials in yearly and quarterly reports right on TradingView.
Microsoft Corp. is going to release the next earnings report on Apr 28, 2026. Keep track of upcoming events with our Earnings Calendar.
MSFT earnings for the last quarter are 4.14 USD per share, whereas the estimation was 3.91 USD resulting in a 6.00% surprise. The estimated earnings for the next quarter are 4.03 USD per share. See more details about Microsoft Corp. earnings.
Microsoft Corp. revenue for the last quarter amounts to 81.27 B USD, despite the estimated figure of 80.31 B USD. In the next quarter, revenue is expected to reach 81.30 B USD.
MSFT net income for the last quarter is 38.46 B USD, while the quarter before that showed 27.75 B USD of net income which accounts for 38.60% change. Track more Microsoft Corp. financial stats to get the full picture.
Yes, MSFT dividends are paid quarterly. The last dividend per share was 0.91 USD. As of today, Dividend Yield (TTM)% is 0.79%. Tracking Microsoft Corp. dividends might help you take more informed decisions.
Microsoft Corp. dividend yield was 0.67% in 2025, and payout ratio reached 24.34%. The year before the numbers were 0.67% and 25.42% correspondingly. See high-dividend stocks and find more opportunities for your portfolio.
As of Feb 1, 2026, the company has 228 K employees. See our rating of the largest employees — is Microsoft Corp. on this list?
EBITDA measures a company's operating performance, its growth signifies an improvement in the efficiency of a company. Microsoft Corp. EBITDA is 184.76 B USD, and current EBITDA margin is 57.74%. See more stats in Microsoft Corp. financial statements.
Like other stocks, MSFT shares are traded on stock exchanges, e.g. Nasdaq, Nyse, Euronext, and the easiest way to buy them is through an online stock broker. To do this, you need to open an account and follow a broker's procedures, then start trading. You can trade Microsoft Corp. stock right from TradingView charts — choose your broker and connect to your account.
Investing in stocks requires a comprehensive research: you should carefully study all the available data, e.g. company's financials, related news, and its technical analysis. So Microsoft Corp. technincal analysis shows the sell today, and its 1 week rating is sell. Since market conditions are prone to changes, it's worth looking a bit further into the future — according to the 1 month rating Microsoft Corp. stock shows the sell signal. See more of Microsoft Corp. technicals for a more comprehensive analysis.
If you're still not sure, try looking for inspiration in our curated watchlists.
If you're still not sure, try looking for inspiration in our curated watchlists.