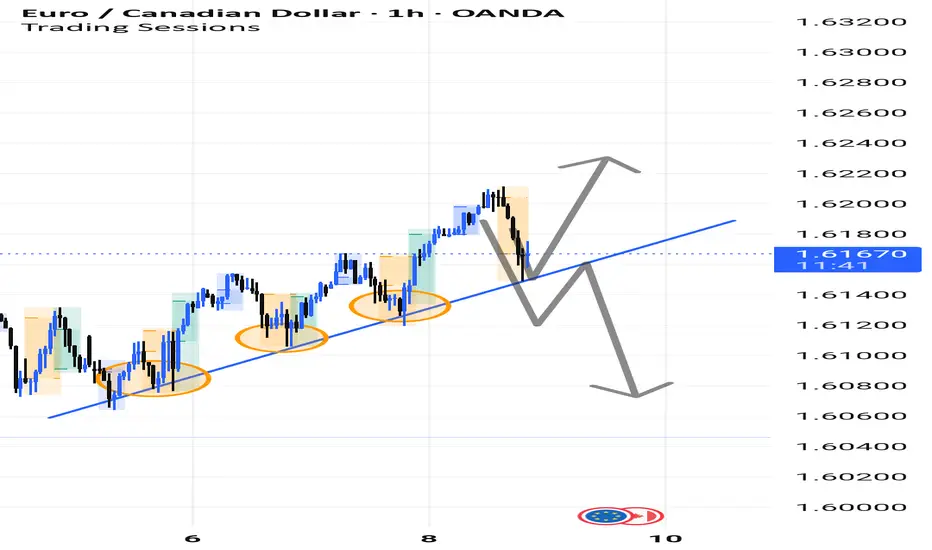
Market is following Trend line.As you can see EURCAD is following trend line if market break trend line we can sell and if give candelstick conformation in same direction we can take trade according to trend.
Plan your trade accordingly.
Canadian Dollar/Euro
No trades
What traders are saying
EURCAD Elliot Wave_LongI’m anticipating an upside move in EURCAD around the 1.62200 level. It’s a low-risk, high-reward setup. Please do your own research before making any trading decisions.

EURCAD - CONTINUATION TRADEThe pair is in a clear uptrend, consistently forming higher highs and higher lows. I’m waiting for a healthy pullback into the demand zone, where I’ll look for confirmation to enter long position. Setup remains solid as long as structure is maintained. If in any case price drop below the demand zone, that will indicate shift in a structure.
EURCAD - APPROACHES KEY LIQUIDITY ZONESymbol - EURCAD
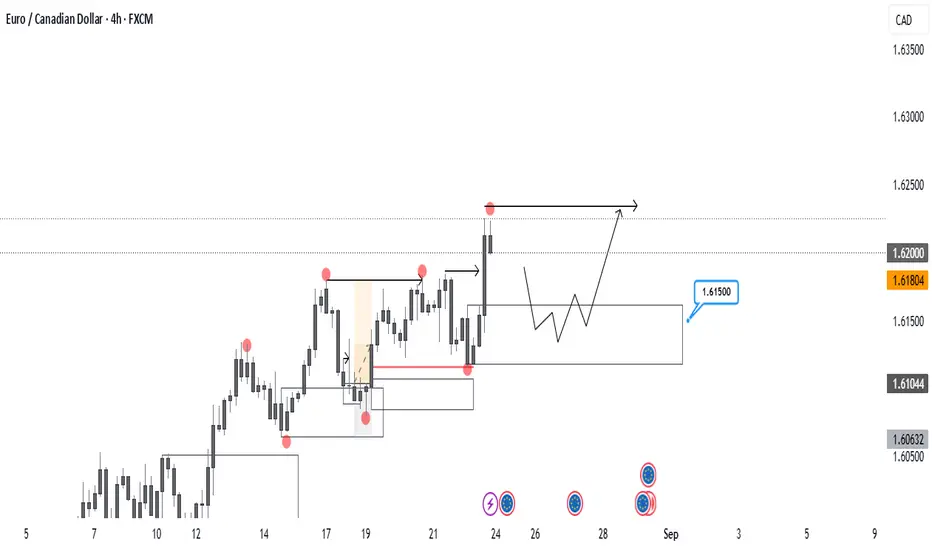
EURCAD is currently undergoing a correction towards a key liquidity zone within the context of a broader and well established bullish trend. The question remains - will the bulls step in around the 1.6175 area?
EURCAD is retracing toward a strong support zone near 1.6175, contributing to short-term weakness in the pair. Despite this correction, the overall trend remains bullish, and a reaction from buyers in this region appears likely.
A false breakout above resistance has triggered the ongoing pullback. However, price action remains confined within the established trading range between 1.6400 & 1.6173. The market now appears to be gravitating toward support for a potential retest, and this zone could serve as a foundation for renewed upward movement.
Resistance levels: 1.6330, 1.6400
Support levels: 1.6175, 1.6030
A liquidity pool just below the 1.6200 - 1.6170 area may shift momentum in favor of buyers. Given that the broader structure remains bullish, this presents a potential advantage for long positions. A false breakdown of support, coupled with a lack of downside momentum, could act as a catalyst for renewed growth.

EURCAD MULTI TIME FRAME ANALYSISHello traders , here is the full multi time frame analysis for this pair, let me know in the comment section below if you have any questions , the entry will be taken only if all rules of the strategies will be satisfied. wait for more price action to develop before taking any position. I suggest you keep this pair on your watchlist and see if the rules of your strategy are satisfied.
🧠💡 Share your unique analysis, thoughts, and ideas in the comments section below. I'm excited to hear your perspective on this pair .
💭🔍 Don't hesitate to comment if you have any questions or queries regarding this analysis.

EUR/CAD entrycanadian dollar is weak against eur currency so take buy entry
stoploss 1.61800
tp 1.63503

EURCAD MULTI TIME FRAME ANALYSISHello traders , here is the full multi time frame analysis for this pair, let me know in the comment section below if you have any questions , the entry will be taken only if all rules of the strategies will be satisfied. wait for more price action to develop before taking any position. I suggest you keep this pair on your watchlist and see if the rules of your strategy are satisfied.
🧠💡 Share your unique analysis, thoughts, and ideas in the comments section below. I'm excited to hear your perspective on this pair .
💭🔍 Don't hesitate to comment if you have any questions or queries regarding this analysis.

EURCAD BUYSPrice flipped the 4H structure on EURCAD, making a new higher high and shifting bullish. I’m watching for a retrace back down into the demand zone around 1.58500 that caused the flip.
Looking for buyers to come in here again and push the price higher. Will wait for some confirmation on the 15-minute chart before entering.

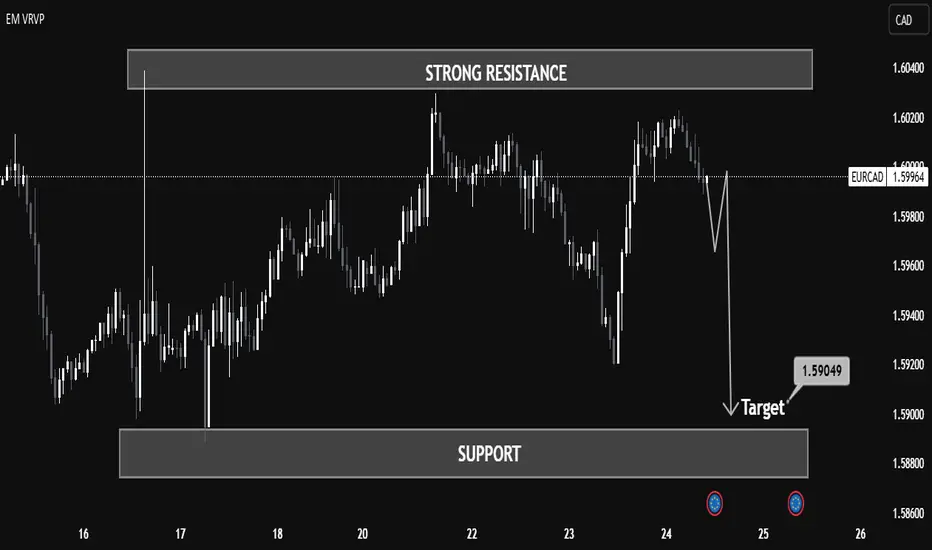
EURCAD Technical Analysis – Bearish Reversal from Resistance 📉 EURCAD Technical Analysis – Bearish Reversal from Resistance Zone
(Timeframe: Intraday – as of July 24, 2025)
🔍 Market Context
The EURCAD pair has recently tested a strong resistance zone around the 1.60200 – 1.60400 level, where it faced clear rejection, forming a sharp bearish move.
🔸 Key Technical Zones
Resistance Area: 1.60200 – 1.60400
A well-established zone that has previously rejected price. Price was unable to sustain above this level, confirming supply pressure.
Support Area: 1.58600 – 1.58800
This is a previously tested demand zone, which now acts as a key target and potential bounce area if the bearish move continues.
Target Level Marked: 1.59049
A mid-point level just above the support zone, possibly an early TP (Take Profit) area for short sellers.
🔄 Price Action
Price formed a lower high just below the resistance, indicating weakening bullish momentum.
The recent strong bearish candle confirms momentum shift to the downside.
A bearish continuation pattern appears likely, especially with the forecast path suggesting a pullback followed by a drop toward 1.59049.
📊 Volume Profile (VRVP)
Low volume acceptance between 1.59400 – 1.59000 supports the idea of fast price movement through this region — called a volume gap.
Strong volume concentration near support, indicating that buyers may become active near 1.58800 again.
🔧 Conclusion
The EURCAD pair has shown clear rejection from a major resistance zone, and the chart suggests a bearish continuation targeting the 1.59049 level and possibly lower into the support zone.
Traders may look for confirmation such as:
Pullback retest of 1.59800–1.59900
Bearish engulfing or continuation candle
Failure to break above recent highs
Risk management is crucial — invalidation would occur on a strong close above 1.60400.
📚 Educational Title Suggestion
"Resistance Rejection & Momentum Shift: EURCAD Bearish Setup Breakdown"
Jul 18: EUR/CAD Daily ViewEUR/CAD is trading in Monthly curve EQ. If we see a uptrend in Daily/4Hour we can plan a Long trades till Daily Supply. We are in a low of Daily Demand we should be anticipating strong upside move for few days.
Todays Plan:
Look for good 1H/4H setup for the upside.

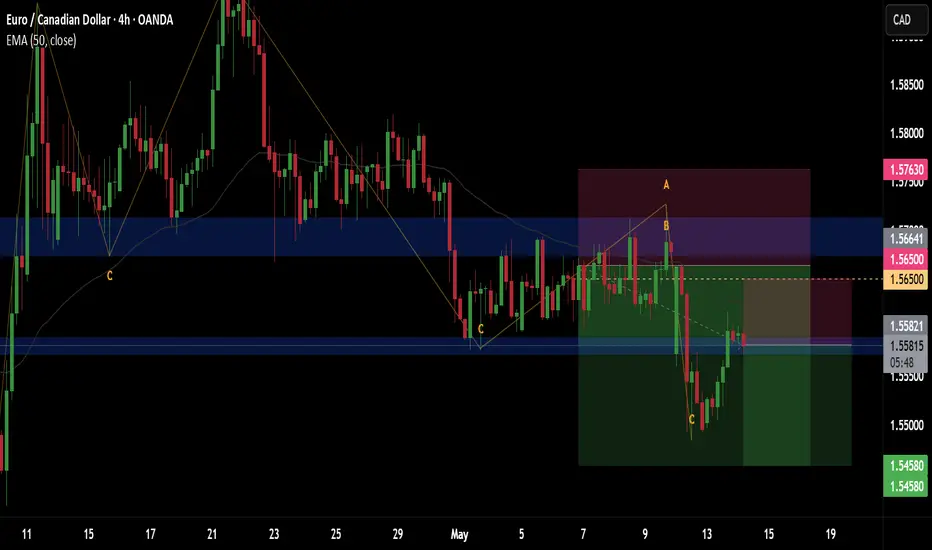
EUR/CAD Bearish Setup – Supply Zone Reversal Trade Plan"Trend:
⬆️ Uptrend (past) → 🔄 CHoCH (Change of Character) → ⬇️ Potential Downtrend
1. Pattern Formed:
📐 Rising Wedge → Bearish Reversal Pattern
➡️ Price broke structure at the bottom = CHoCH ⚠️
2. Supply Zone:
🟧 Supply Zone = 1.56580 - 1.56602
🔄 Price may pull back here before dropping
📍This is your ENTRY ZONE
3. Trade Setup:
🔵 Entry Point:
* 1.56580 (Inside Supply Zone)
❌ Stop Loss:
* 1.57176
* Just above swing high & supply zone 🛑
✅ Take Profit Target:
* 1.54370
* Strong previous support zone 💰
4. Indicators:
📉 EMA (47) = Acting as resistance
* Price is currently below EMA ➡️ Bearish signal
TRADE PLAN OVERVIEW:
* 🎯 Entry: 1.56580
* ⛔ Stop Loss: 1.57176
* 💸 Take Profit: 1.54370
* ⚖️ Risk/Reward Ratio: 1:3 (Great!)
Summary:
* Wait for rejection or bearish candle in supply zone
* Enter short
* Ride it down to the target
* Manage risk smartly ✅

EUR/CAD FLAG$POLEThe "flag and pole pattern" in technical analysis is a continuation pattern that signals a potential continuation of an existing trend. It's characterized by a sharp price movement (the "pole") followed by a period of consolidation within a defined range (the "flag"). A breakout from this range, in the same direction as the original movement, suggests the trend will likely continue

Sell Trade - EUR/CADGreetings to everyone!
Place a second sell trade on EUR/CAD. If you had executed the first trade with me earlier and it’s still active so trail your stop-loss to 1.56500.
The Second Trade is as following :-
My Entry: 1.55821
My Stoploss: 1.56500
My Target: 1.54580
Remember Again :-
* Move your SL to breakeven once the trade reaches 1:1.4 R.
* Aim for a minimum reward of 1:1.5 R.
* Don't risk more than 3% of your total margin.
Let's execute this trade smartly! 🚀
💬 About Me:
I am a professional trader with over four years of experience in the markets. I focus on swing trading using the 4H timeframe, mainly in the forex space. The trades I share here are the actual positions I’m executing. I post them as a small gesture to give back to the trading community that’s been a big part of my journey. Cheers! 🙏
Sell Trade - EUR/CADGreetings to everyone!
Place a sell trade on EUR/CAD and check out my chart for the ideal entry, stop-loss & target placement.
Remember :-
* Move your SL to breakeven once the trade reaches 1:1.4 R.
* Aim for a minimum reward of 1:1.5 R.
* Don't risk more than 3% of your total margin.
Let's execute this trade smartly! 🚀
💬 About Me:
I am a professional trader with over four years of experience in the markets. I focus on swing trading using the 4H timeframe, mainly in the forex space. The trades I share here are the actual positions I’m executing. I post them as a small gesture to give back to the trading community that’s been a big part of my journey.
Cheers! 🙏

Trade in EUR/CAD 11 April FridayPrice did a liquidity sweep of the New York Kill Zone, as well as the London session low. It tapped into a key market structure fractal point on the 1-hour timeframe and simultaneously filled an imbalance on the 4-hour chart. Higher timeframes were also aligned with a bullish bias, which supported the directional conviction. Based on this confluence, a long position was taken.

EUR / CAD Sellobserving bearish OB
multiple rejections from OB
stoploss and targets mentioned in the chart

EUR/CAD Bullish Momentum: Targeting 1.51+ !?📌 Key Observations:
1. Support Rejection ✅: The price has bounced off the support zone (highlighted in red), which was a critical level for a bullish continuation. This level is now acting as a launchpad for further upside.
2. Bullish Momentum 📈: The market structure suggests a strong uptrend, with recent bullish candles breaking through resistance.
3. Next Target 🎯: The green resistance zone at 1.51+ is the main target for buyers. The blue arrow indicates a potential move towards this level.
4. EMA 200 📉 (Red Line @ 1.48721): The price has successfully traded above the 200-day EMA, reinforcing bullish sentiment.
5. RSI (14) at 58.89 📊: The RSI is approaching the 60 level, showing bullish strength, but not yet overbought (above 70), meaning there’s still room for an upward move.
🔎 Potential Scenarios:
If the price breaks 1.51, we could see a further push towards new highs. 🚀
If the price rejects from 1.51, a retracement to 1.50 or lower might happen before another attempt upwards. 🔄
🎯 Conclusion: The market is currently bullish, with a high probability of hitting the next resistance zone. Watch for confirmation near 1.51—a breakout could mean further gains, while rejection could signal a pullback.

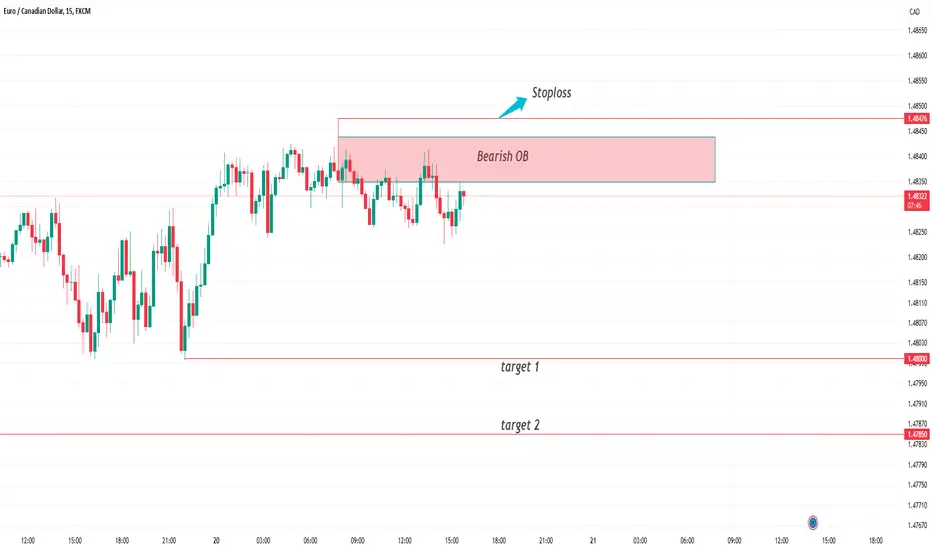
EURCAD short term -SELLI am expecting EURCAD to fall with with upcoming news this week, our level are given below
SL level : 1.4832
TP level : 1.4757
use 1 % rule only
updates will be done regular regarding this trade.

EUR CAD HEAD AND SHOULDER + CROSSING RESISTANCE LONGI have been waiting for this entry for a while now and finally we break through the resistance.
Wait for the retest turning resistance into support and look for Long entry after confirmation
Not Financial advice

EURCAD MULTI TIME FRAME ANALYSISHello traders , here is the full multi time frame analysis for this pair, let me know in the comment section below if you have any questions , the entry will be taken only if all rules of the strategies will be satisfied. wait for more price action to develop before taking any position. I suggest you keep this pair on your watchlist and see if the rules of your strategy are satisfied.
🧠💡 Share your unique analysis, thoughts, and ideas in the comments section below. I'm excited to hear your perspective on this pair .
💭🔍 Don't hesitate to comment if you have any questions or queries regarding this analysis.

EURCAD SHOWING A GOOD UP MOVE WITH 1:10 RISK REWARD EURCAD SHOWING A GOOD UP MOVE WITH 1:10 RISK REWARD
DUE TO THESE REASON
A. its following a rectangle pattern that stocked the market
which preventing the market to move any one direction now it trying to break the strong resistant lable
B. after the break of this rectangle it will boost the market potential for break
C. also its resisting from a strong neckline the neckline also got weeker ald the price is ready to break in the outer region
all of these reason are indicating the same thing its ready for breakout BREAKOUT trading are follws good risk reward
please dont use more than one percentage of your capitalfollow risk reward and tradeing rules
that will help you to to become a bettertrader
thank you

EURCAD 12.8 - XIt's a fresh new week ahead of us! Hello, traders. Let's start by analyzing EUR/CAD.
As you can see, the target for sells from the previous week was reached. So, here's what I'm focusing on now: Ideally, I'd like to see some signs of strength, which is what I’m watching for on smaller timeframes. Buys remain valid until the break of the low. If the price goes lower, the Point of Interest (POI) will be adjusted.
I will only post new analyses for some setups, as I’ve mainly updated ideas with comments on the existing ones.
