Do TSLA can go go aroung 65 05 84 ?Fibo trend and one unfilled gap shown TSLA might go 85 to 65 range . Please have look in chart
TSLA trade ideas

Will Tesla Keep Up the Winning Streak with the Upcoming EarningsNASDAQ:TSLA A behemoth in the electric vehicle and clean energy sector that has always kept investors and market analysts on their toes with its stock price movements.
Tesla had a tough time in 2022, seeing its stock price drop from $400 to almost $100. But things turned around this year. The stock price bounced back big time, going up by 200% from $100 to $300. Now, it's moving within a tight range, forming what's called a symmetrical pattern. This means the stock price is holding steady for now, not making any big jumps up or down.
Investors are now eyeing the company’s earnings report coming out in two days. Tesla has been on a roll, meeting its earnings targets for the last 10 quarters. If Tesla hits its earnings target again this time, the stock price could break out of its current range and climb higher.

Anticipating Tesla to reach 320 within Wave V.Anticipating Tesla to reach 320 within Wave V.
In Elliott Wave Theory, the concept of "Wave V" represents the final major move in a five-wave sequence. It is usually the wave that follows after Wave IV, and it often leads to the end of a significant trend. In the case of Tesla stock (TSLA), anticipate it to reach 320 within Wave V.

Tesla in rangeTesla is in range of 216-240. but overall its weak.
Above 240, it can attempt to 262
and below 216, it can test 194/167

Tesla buy😎 246 stop 242 tgt 250..256Strong bullish from here
246 to 256....
My view upside
Education purpose only

TESLA buy above only 268.50 stop 264 target 272 ..276tesla buy above only strong 268.50 stop 264
target1 272
target2 276++
my view only
educational purpose

Tesla Nearing its bottom - AccumulateTesla formed a Head and Shoulder pattern on charts and have fallen from 222 to 140 already.
Its nearing the bottom and currently at first support level. The support levels are marked on the charts. $118 is strong support if it continues to fall further.
Recommendation is to start accumulating the shares in small quantity from now.


Elliott Wave Analysis of Tesla Bullish Perspective with CautionsHello Friends
Here we had shared study of Elliott wave analysis for Tesla A bullish perspective with cautions,
In the world of Elliott Wave theory, let's take a closer look at Tesla's chart. Here's what we found.
On an intermediate degree, we've witnessed the completion of two waves, elegantly labeled as "Wave (1)" and "Wave (2)." Currently, the spotlight is on "Wave (3)," which tends to bring about significant market changes.
Within Wave (3), we've ventured a step further by identifying "minor wave 1" of Wave (3). This delves into even greater detail, allowing us to see the inner workings of market dynamics.
Zooming in even closer, we've navigated the world of "minute" degrees within "minor wave 1." This revealing sub-waves (i), (ii), (iii), and (iv), setting the stage for what's next - the anticipated "sub-wave (v).
But that's not all. A promising development has occurred. Tesla has broken above the 0-B resistance trendline, signaling a potential shift in momentum and strengthening the case for a bullish scenario.
In summary, the Elliott Wave analysis suggests a bullish outlook for Tesla, with the breakout above the 0-B resistance trendline serving as a confirmation. Long positions are an option, with target levels set at 400 and 500, and potentially more. However, caution is warranted, with an invalidation level set at 101.81. If Tesla's price were to drop below this level, it could indicate a different scenario - a potential double correction as double (a)-(b)-(c) which we can label as "W-X-Y" within "Wave (2).
As always, no analysis is infallible, and surprises can still occur in the market. Risk management remains crucial. We'll eagerly await your further instructions to continue exploring Tesla's potential.
I am not sebi registered analyst. My studies are for educational purpose only. Please Consult your financial advisor before trading or investing. I am not responsible for any kinds of your profits and your losses.
Thanks
RK💕
Most investors treat trading as a hobby because they have a full-time job doing something else.
However, If you treat trading like a business, it will pay you like a business.
If you treat like a hobby, hobbies don't pay, they cost you...!
Disclaimer and Risk Warning.
The analysis and discussion provided on in.tradingview.com is intended for educational purposes only and should not be relied upon for trading decisions. RK_Charts is not an investment adviser and the information provided here should not be taken as professional investment advice. Before buying or selling any investments, securities, or precious metals, it is recommended that you conduct your own due diligence. RK_Charts does not share in your profits and will not take responsibility for any losses you may incur. So Please Consult your financial advisor before trading or investing.


Can it’s time to buy Tesla??Its at Support side to came at 220$. I think it’s go up by & touch again @ 280$ again by it’s next Resistance l. Is purely on my technical chart basis plz support for analysis


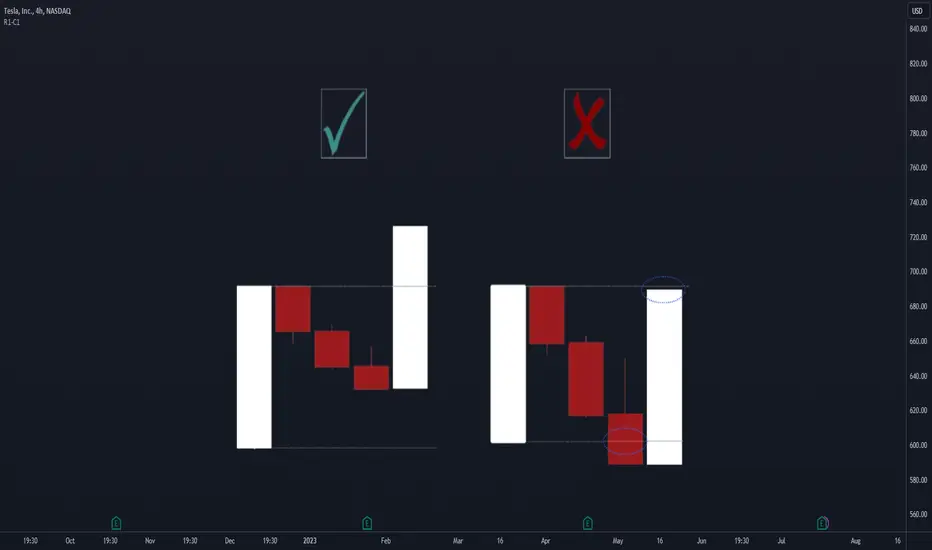
Candlestick pattern: Bullish Triple FormationThe 'Bullish Triple Formation' is a pattern in which two large bullish candles appear, separated by three small bearish candles. These three bearish candles make new lows and are contained within the body of the first large bullish candle. This pattern occurs in an uptrend and is interpreted as a correction of the trend after an upward impulse, indicating a potential continuation of the bullish movement thereafter.
It's important to note that this pattern may have variations, as instead of three candles correcting the first large bullish candle, there can be two or more than three.
The reliability of this pattern is high; however, it is still a single signal that should be accompanied by others to increase the probability of success in our analysis.

Tesla FallTesla has formed a double top and probablity of target 266 on the cards. Trade with Stop loss

TSLA WAVE COUNTS#TSLA forming a good impulsive structure on a weekly timeframe from its low of 2010.
Where are we now?
We are in the 5th wave of parent wave (3) which must cross the level of previous high for
the counts to remain valid holding the level of 152.10.
We can see a target of 1.5X to 3X from here.
Trade at your own risk.
Regards.

TSLATSLA is in parallel channel and given BO above rectangle box
it has potential to touch upper edge of the channel

TSLATSLA back in Stage 2
Stage 2A :
- above all mas
- crossing resistance
- double bottom
- increasing volume

TSLA - Big Target BREAKING 200 EMAAny body wants Nasdaq Inv, Here my Strategy may give good risk free return.
Technical View on TSLA on Big upside Potential

Tesla long termTesla is going up before new to have pull back aroun 180 then you can buy option contracts for 2025

Buy Tesla For potential gains.Hi Guys whole corrective structure looks complete in Tesla. I'm expecting price to touch new highs by breaking previous highs. Also i have mentioned the same in my previous ideas that i'm attaching below.

Tesla next target 196$Looks like Tesla might test 196$ in the coming days based on support and resistance

