Gold Trading Strategy for 19th September 2025📊 Gold Intraday Trading Plan
🟢 Buy Setup (Long Trade)
✅ Condition: Enter only if price closes above the high of the 15-minute candle at $3686.
🎯 Targets:
1st Target → $3696
2nd Target → $3709
3rd Target → $3720
📌 Stop-Loss (SL): Place a safe SL below $3678 (just under the breakout candle’s low).
🔴 Sell Setup (Short Trade)
✅ Condition: Enter only if price closes below the low of the 1-hour candle at $3663.
🎯 Targets:
1st Target → $3653
2nd Target → $3643
3rd Target → $3633
📌 Stop-Loss (SL): Place a safe SL above $3670 (just above the breakdown candle’s high).
📘 Notes
⚖️ Wait for candle close confirmation (don’t enter early).
🕒 Use 15-minute chart for Buy setup & 1-hour chart for Sell setup.
💵 Risk small (1–2% of capital). Never risk full money on one trade.
📉 Always place Stop-Loss before entering a trade.
📊 Trail your SL to lock profits once the first target is hit.
⚠️ Disclaimer:
This is only for educational purposes. 📚 Trading involves high risk. 💸 Do your own research before investing. I am not a financial advisor.
CFDGOLD trade ideas
Gold Stuck in 3620–3655 Range – All Eyes on Fed DecisionGold is still consolidating between 3620–3625 support and 3650–3655 resistance, respecting this week’s pivot level around 3632. As highlighted in the weekly outlook, this week’s trading action is likely to remain muted until the FOMC rate decision and press conference on Wednesday.
Until then, we can expect price to stay range-bound, with quick scalps working better than trend trades.
Once the Fed outcome is out, we should see a clearer short-term direction.
A higher-timeframe close above 3655 could open the door for a move toward 3675+ and potentially new highs.
On the flip side, a break below 3620 could trigger a deeper pullback, but so far there’s no sign of reversal pressure bulls remain firmly in control on higher timeframes.

XAUUSD GOLD ANALYSIS ON (11/09/2025)#XAUUSD UPDATEDE
Current price - 3636
If price stay below 3660, then next target 3600,3680 and above that 3700
Plan;If price break 3640-3648 area, and stay below 3640, we will place sell order in gold with target of 3600 and 3580 & stop loss should be placed at 3660

Gold 1H – Retail Sales Impact Before FedOn the 1H chart, Gold is holding near 3,682 after showing a clear Break of Structure. Liquidity is now seen both above the premium resistance at 3,700 and below the Fair Value Gap demand around 3,669–3,667. With U.S. Retail Sales data due at 19:30 IST today, intraday volatility is expected, but overall positioning is still cautious ahead of the Federal Reserve’s interest rate decision later this week. Traders can look for liquidity sweeps towards premium levels before retracements into demand zones.
________________________________________
📌 Key Structure & Liquidity Zones (1H):
• 🔴 SELL ZONE 3,700 – 3,698 (SL 3,707): Premium resistance likely to trigger rejection towards 3,690 → 3,680 → 3,670.
• 🟢 FVG BUY ZONE 3,669 – 3,667 (SL 3,660): Fair Value Gap demand zone for retracements, targeting 3,680 → 3,690 → 3,700+.
• 🟢 BUY SUPPORT 3,641 – 3,639 (SL 3,632): Deep discount support, targeting 3,655 → 3,670 → 3,685+.
________________________________________
📊 Trading Ideas (Scenario-Based):
🔺 Buy Setup – FVG Reclaim (3,669–3,667)
• Entry: 3,669 – 3,667
• Stop Loss: 3,660
• Targets:
TP1: 3,680
TP2: 3,690
TP3: 3,700+
👉 Look for a liquidity sweep into the FVG zone before New York session begins.
🔺 Buy Setup – Discount Sweep (3,641–3,639)
• Entry: 3,641 – 3,639
• Stop Loss: 3,632
• Targets:
TP1: 3,655
TP2: 3,670
TP3: 3,685+
👉 A good risk-to-reward opportunity if price sweeps stops below structure before Retail Sales release.
🔻 Sell Setup – Premium Liquidity Run (3,700–3,698)
• Entry: 3,700 – 3,698
• Stop Loss: 3,707
• Targets:
TP1: 3,690
TP2: 3,680
TP3: 3,670
👉 Expect engineered stop-runs into premium supply before fading lower.
________________________________________
🔑 Strategy Note
While Retail Sales data may bring short-term price swings, market attention is focused on the Fed. Smart Money is likely to trap both sides of liquidity: fading premium near 3,700–3,698 while accumulating buys at 3,669–3,667 and 3,641–3,639. Trade with smaller positions and confirm with H1 closes before entries.

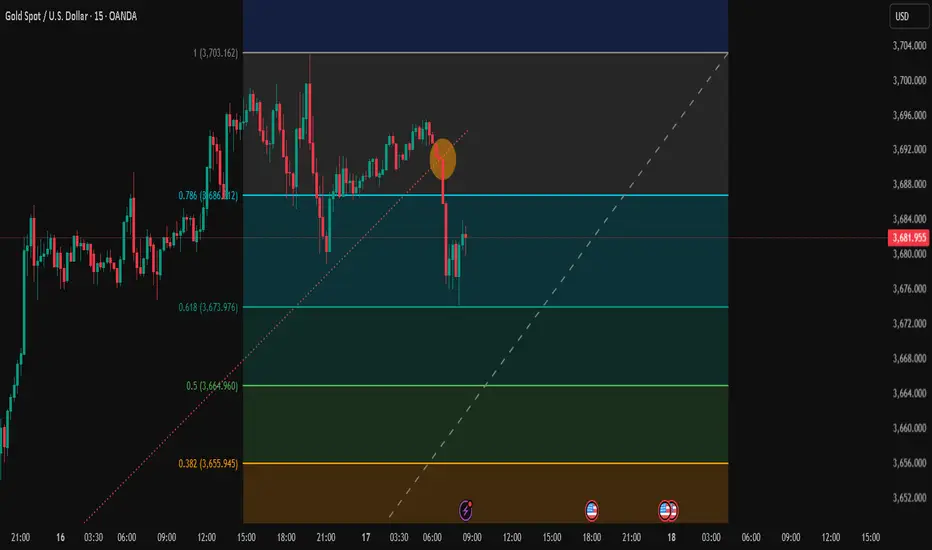
Trading Analysis for Gold Spot / U.S. Dollar (15-Minute Chart)Sell XAU/USD now at 3688.00 level and take a stop loss of 3703.00 and the targets will be as follows.
Entry range 3691.00 to 3687.00
Take Profit 1 = 3673.00
Take Profit 2 = 3665.00
Take Profit 3 = 3655.00
Take Profit 4 = 3645.00
Stock Loss 3703.00
Based on the provided 15-minute chart for Gold Spot / U.S. Dollar (XAU/USD), published by NaviPips on TradingView.com on June 30, 2025, at 17:53 UTC, here’s a suggested trading setup for a buy position:
Current Price and Trend: The current price is 3,241.875, with a slight increase of +0.250 (+0.01%). The chart shows a recent downtrend that appears to be stabilizing near the current level, suggesting a potential reversal point.
Buy Entry: Enter a buy position at 3,312.875 (current price), as it aligns with a support zone where the price has found a base, indicated by the horizontal dashed line and recent consolidation.
Stop Loss: Place a stop loss at 3,295.250, below the recent low, to protect against further downside. This level is approximately 10.625 points below the entry, defining the risk.
Take Profit Levels:
Take Profit 1: 3,317.875, a conservative target about 20.000 points above the entry, aligning with a minor resistance zone.
Take Profit 2: 3,324.750, a mid-range target approximately 31.875 points above the entry.
Take Profit 3: 3,332.500, a deeper target about 45.625 points above the entry, indicating a potential trend reversal.
Price Action: The chart indicates a downtrend with a possible bottoming pattern near the current level. The support zone and upward candlestick suggest a buy opportunity if the price holds.
Risk-Reward Ratio: The distance to the stop loss (10.625 points) compared to the take profit levels (20.000 to 45.625 points) offers a favorable risk-reward ratio, ranging from approximately 1:1.9 to 1:4.3.
Conclusion
Enter a buy at 3,241.875, with a stop loss at 3,295.250 and take profit levels at 3,317.875, 3,324.750, and 3,332.500. Monitor the price action for confirmation of an upward move, and be cautious of a potential continued downtrend if the price breaks below the stop loss level. (Note: I assume "take profot" was a typo for "take profit" and have corrected it accordingly.)
Gold 4H Outlook – Buy the Dip or Fade the Drop?On the 4H timeframe, Gold is consolidating just below 3,600 after a strong bullish rally. The current structure shows price pausing near premium levels, with liquidity building both above 3,600 and below 3,530. This indicates engineered sweeps are likely before the next major move.
📌 Key Structure & Liquidity Zones (4H):
🔼 Buy Zone 3,572 – 3,574 (SL 3,565): Fresh demand zone at intraday discount; potential continuation level.
🔽 Sell Scalp Zone 3,530 – 3,526 (SL 3,537): Short-term supply/pivot area; scalp opportunity if rejection happens.
📍 Liquidity Magnet 3,603 – 3,605: Upside imbalance area likely to get filled.
📊 Trading Ideas (Scenario-Based):
🔺 Buy Setup – Demand Zone Reaction
Entry: 3,572 – 3,574
Stop Loss: 3,565
Take Profits:
TP1: 3,585
TP2: 3,595
TP3: 3,605
👉 Demand block in line with bullish order flow. Watch for a liquidity sweep and rejection to fuel trend continuation.
🔻 Sell Scalp Setup – Short-Term Reaction
Entry: 3,530 – 3,528
Stop Loss: 3,537
Take Profits:
TP1: 3,520
TP2: 3,510
TP3: 3,500
👉 Intraday supply/pivot area. Best suited for quick scalp trades against the trend, targeting downside liquidity.
🔑 Strategy Note
Overall bias stays bullish, but intraday shorts can work for scalping purposes. The cleaner setup is to buy from 3,572–3,574 for continuation towards 3,600+. Smart money may attempt a liquidity sweep at 3,530 before pushing higher.

XAUUSD SHOWING A GOOD DOWN MOVE WITH 1:10 RISK REWARD CPI UPDATEXAUUSD SHOWING A GOOD DOWN MOVE WITH 1:10 RISK REWARD DUE TO THESE REASON
A. its following a rectangle pattern that stocked the marketwhich preventing the market to move any one direction now it trying to break the strong resistant lable
B. after the break of this rectangle it will boost the market potential for breakC. also its resisting from a strong neckline the neckline also got weeker ald the price is ready to break in the outer region
all of these reason are indicating the same thing its ready for breakout BREAKOUT trading are follws good risk reward
please dont use more than one percentage of your capitalfollow risk reward and tradeing rules that will help you to to become a bettertrader
thank you

Trading Analysis for Gold Spot / U.S. Dollar (15-Minute Chart)Entery = 3649.00
Stock Loss = 3657.00
Take profit 1 = 3643.00
Take profit 2 = 3639.00
Take profit 3 = 3634.00
Take profit 4 = 3628.00
Based on the provided 15-minute chart for Gold Spot / U.S. Dollar (XAU/USD), published by NaviPips on TradingView.com on June 30, 2025, at 17:53 UTC, here’s a suggested trading setup for a buy position:
Current Price and Trend: The current price is 3,241.875, with a slight increase of +0.250 (+0.01%). The chart shows a recent downtrend that appears to be stabilizing near the current level, suggesting a potential reversal point.
Buy Entry: Enter a buy position at 3,312.875 (current price), as it aligns with a support zone where the price has found a base, indicated by the horizontal dashed line and recent consolidation.
Stop Loss: Place a stop loss at 3,295.250, below the recent low, to protect against further downside. This level is approximately 10.625 points below the entry, defining the risk.
Take Profit Levels:
Take Profit 1: 3,317.875, a conservative target about 20.000 points above the entry, aligning with a minor resistance zone.
Take Profit 2: 3,324.750, a mid-range target approximately 31.875 points above the entry.
Take Profit 3: 3,332.500, a deeper target about 45.625 points above the entry, indicating a potential trend reversal.
Price Action: The chart indicates a downtrend with a possible bottoming pattern near the current level. The support zone and upward candlestick suggest a buy opportunity if the price holds.
Risk-Reward Ratio: The distance to the stop loss (10.625 points) compared to the take profit levels (20.000 to 45.625 points) offers a favorable risk-reward ratio, ranging from approximately 1:1.9 to 1:4.3.
Conclusion
Enter a buy at 3,241.875, with a stop loss at 3,295.250 and take profit levels at 3,317.875, 3,324.750, and 3,332.500. Monitor the price action for confirmation of an upward move, and be cautious of a potential continued downtrend if the price breaks below the stop loss level. (Note: I assume "take profot" was a typo for "take profit" and have corrected it accordingly.)
Gold Trading Strategy | September 16-17✅ From the 4-hour chart: Gold formed a high near 3703 and then pulled back, currently trading around 3688. The MA5 and MA10 are turning down, and the price has fallen back below the MA5, showing that short-term bullish momentum has weakened. The MA20 (around 3661) serves as a key support.
The upper Bollinger Band near 3705 is showing strong resistance, and the price has returned to oscillate around the mid-band, indicating that upward momentum is capped. The 4-hour chart suggests weakening bullish momentum, with a potential for consolidation and pullback.
✅ From the 1-hour chart: The MA5 and MA10 are turning downward, creating short-term pressure on the price, while the MA20 around 3687 is providing support.
Gold has broken below the middle Bollinger Band and is oscillating near the lower band, reflecting short-term weakness and the possibility of further testing support. The KDJ has formed a bearish crossover, and the MACD histogram has turned from red to green, showing that short-term bearish momentum is strengthening and there is risk of further downside.
🔴 Resistance levels: 3700–3705 / 3715–3730
🟢 Support levels: 3675–3665 / 3660–3655
📊 Trading Strategy Reference
🔻 Short Setup
● Entry: Sell in batches if gold rebounds to 3695–3700
● Target 1: 3680–3675
● Target 2: If broken, look further toward 3665
🔺 Long Setup
● Entry: Buy in batches if gold pulls back and stabilizes around 3670–3675
● Target 1: 3690–3695
● Target 2: If broken, look further toward 3700
🔥Trading Reminder: Trading strategies are time-sensitive, and market conditions can change rapidly. Please adjust your trading plan based on real-time market conditions. If you have any questions , feel free to contact me🤝

GOLD ANALYSIS IN 30MINHELLO,
there is high probability for gold to reach the 3713$ in few HOURS,
thanks

GOLD LONG IDEA AT BOTTOM 1400PIPS IN NONFARM
BUY GOLD 3314 +900PIPS
BUY GOLD 3344 +500PIPS
📊 Today’s Non-Farm Payrolls (NFP) – USD
Average Hourly Earnings m/m:
✅ 0.3% (same as forecast and previous).
→ Wage growth is steady, no extra inflation pressure.
Non-Farm Employment Change:
❌ Actual: 22K vs Forecast: 75K vs Previous: 79K
→ Job creation has fallen sharply, showing slowdown in the US economy.
Unemployment Rate:
✅ Actual: 4.3% (as expected, higher than 4.2% previous).
→ Labour market conditions are getting weaker, unemployment rising.
🔎 Market Impact
US Dollar (USD):
Weak NFP data is negative for the dollar.
Higher unemployment increases chances of the Fed cutting rates earlier.
Gold (XAU/USD):
Positive for gold: Weak USD supports higher gold prices.
If the Fed turns dovish, safe-haven demand for gold will strengthen.
Gold may gain strong momentum on expectations of rate cuts.
Equities:
Wage inflation is stable, so no fresh inflation worries.
Equity markets may take it positively as Fed could soften policy.
📌 Key Takeaway
NFP weak → Bearish USD
Gold bullish, upside momentum possible
EUR, GBP likely to gain on USD weakness
Equities may stay supported

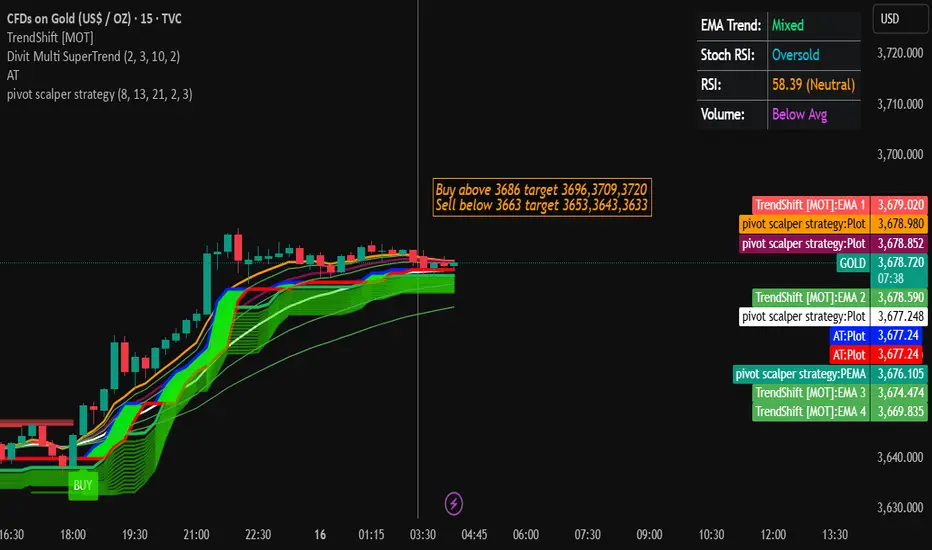
XAUUSD/GOLD 1H BUY PROJECTION 16.09.25XAUUSD/Gold 1H Buy Projection (16.09.25). Here’s a breakdown of the key points from your analysis:
🔹 Chart Analysis
Support & Resistance
Support S1: Around 3678 zone.
Minor Resistance Breaked: Price broke above the 3680 resistance area.
Resistance R1 (ATH): Around 3692 – 3696 area.
Entry & Stoploss
Current price: 3683.63
Stoploss: Below 3676 level.
Risk Zone (Red Area): Price should not break below this zone for the buy setup to remain valid.
Target Levels
Target Price 1: ~3688
Target Price 2: ~3692–3696
Indicators
Stochastic Oscillator (top indicator):
Showing a bullish crossover (green line crossing above red), suggesting upward momentum.
RSI (bottom indicator):
Turning upward from 64.47, showing renewed buying pressure.
🔹 Projection
The setup is bullish with expected upward movement from 3683 → 3692 → 3696+.
The chart suggests a possible pullback and continuation before reaching higher targets.
As long as 3680 support holds, momentum favors the upside.

High-Frequency Trading (HFT)1. Introduction to High-Frequency Trading
High-Frequency Trading, commonly known as HFT, is one of the most fascinating and controversial developments in modern financial markets. It refers to the use of advanced algorithms, ultra-fast computers, and high-speed data networks to execute thousands of trades in fractions of a second. Unlike traditional traders who might hold a stock for days, weeks, or months, HFT firms often hold positions for mere milliseconds to seconds before closing them.
The goal is simple yet complex: exploit tiny price inefficiencies across markets repeatedly, so that the small profits from each trade accumulate into large gains. HFT thrives on speed, volume, and precision.
In the 21st century, HFT has transformed how global markets function. Estimates suggest that 50–60% of equity trading volume in the US and nearly 40% in Europe is driven by HFT. It has created a financial arms race where firms spend millions to shave microseconds off trade execution time.
But while some argue HFT improves liquidity and efficiency, others see it as an unfair advantage that destabilizes markets. To understand this debate, we must first trace how HFT evolved.
2. Historical Evolution of HFT
a) Early Trading Days
Before computers, trading was conducted by human brokers shouting orders on exchange floors. Trades took minutes, sometimes hours, to process. Speed wasn’t the focus; information and relationships were.
b) Rise of Electronic Trading (1970s–1990s)
The introduction of NASDAQ in 1971, the first electronic stock exchange, was the seed for automated trading.
By the late 1980s, program trading became popular: computer systems executed pre-defined buy/sell orders.
Regulatory changes like SEC’s Regulation ATS (1998) enabled Alternative Trading Systems (ATS), such as electronic communication networks (ECNs).
c) Birth of High-Frequency Trading (2000s)
With the spread of broadband internet and decimalization (2001) of stock quotes (moving from 1/16th to 1 cent spreads), markets became tighter and more suitable for HFT.
By mid-2000s, firms like Citadel, Jump Trading, and Renaissance Technologies began developing advanced algorithms.
In 2005, Regulation NMS in the US required brokers to offer clients the best available prices, which fueled arbitrage-based HFT.
d) The HFT Boom (2007–2010)
Ultra-low latency networks allowed HFT firms to trade in microseconds.
During this period, HFT profits peaked at $5 billion annually in the US.
e) Modern Era (2010–Present)
Post the 2010 Flash Crash, regulators imposed stricter monitoring.
Now, HFT is more competitive, with shrinking spreads and lower profitability. Only the largest firms with cutting-edge infrastructure dominate.
3. Core Principles and Mechanics of HFT
At its core, HFT relies on three fundamental pillars:
Speed – Faster data processing and trade execution than competitors.
Volume – Executing thousands to millions of trades daily.
Automation – Fully algorithm-driven, with minimal human intervention.
How HFT Works Step by Step:
Market Data Collection – Systems capture live market feeds from multiple exchanges.
Signal Processing – Algorithms identify potential opportunities (like arbitrage or momentum).
Order Placement – Orders are executed within microseconds.
Risk Control – Automated systems constantly monitor exposure.
Order Cancellation – A hallmark of HFT is rapid order cancellation; more than 90% of orders are canceled before execution.
In short, HFT is about being faster and smarter than everyone else in spotting and exploiting price inefficiencies.
4. Technology & Infrastructure Behind HFT
HFT is as much about technology as finance.
Colocation: HFT firms place their servers next to exchange servers to minimize latency.
Microwave & Laser Networks: Some firms use microwave towers or laser beams (instead of fiber optic cables) to send signals faster between cities like Chicago and New York.
Custom Hardware: Use of Field-Programmable Gate Arrays (FPGAs) and specialized chips for ultra-fast execution.
Algorithms: Written in low-level programming languages (C++, Java, Python) optimized for speed.
Data Feeds: Direct market data feeds from exchanges, often costing millions annually.
Without such infrastructure, competing in HFT is impossible.
5. Types of HFT Strategies
HFT isn’t a single strategy—it’s a family of approaches.
a) Market Making
Continuously posting buy and sell quotes.
Profit from the bid-ask spread.
Provides liquidity but withdraws during stress, creating volatility.
b) Arbitrage Strategies
Statistical Arbitrage: Exploiting short-term mispricings between correlated assets.
Index Arbitrage: Spotting mismatches between index futures and constituent stocks.
Cross-Exchange Arbitrage: Exploiting price differences across exchanges.
c) Momentum Ignition
Algorithms try to trigger price moves by quickly buying/selling and then profiting from the resulting momentum.
d) Event Arbitrage
Trading news or events (earnings releases, economic data) milliseconds after release.
e) Latency Arbitrage
Profiting from speed advantage when market data is updated at different times across venues.
f) Quote Stuffing (controversial)
Sending massive orders to overload competitors’ systems, then exploiting the delay.
6. Benefits of HFT
Despite criticisms, HFT provides several market benefits:
Liquidity Provision – Ensures continuous buy/sell availability.
Tighter Spreads – Reduced transaction costs for investors.
Market Efficiency – Prices reflect information faster.
Arbitrage Reductions – Eliminates mispricings across markets.
Automation & Innovation – Pushes markets toward modernization.
7. Risks, Criticisms, and Controversies
HFT has a darker side.
Market Volatility – Sudden liquidity withdrawals can trigger flash crashes.
Unfair Advantage – Retail and institutional investors can’t compete on speed.
Order Spoofing & Manipulation – Some HFT tactics border on illegal.
Systemic Risk – Reliance on algorithms may cause chain reactions.
Resource Arms Race – Billions spent on infrastructure only benefit a few.
The 2010 Flash Crash
On May 6, 2010, the Dow Jones plunged nearly 1,000 points in minutes, partly due to HFT feedback loops. Although the market recovered quickly, it exposed the fragility of algorithm-driven markets.
8. Regulation & Global Perspectives
Regulators worldwide are struggling to balance innovation with fairness.
US: SEC and CFTC monitor HFT. Rules like Reg NMS and circuit breakers have been introduced.
Europe: MiFID II (2018) tightened reporting, increased transparency, and mandated testing of algorithms.
India: SEBI regulates algo trading; discussions about limiting co-location privileges exist.
China: More restrictive, cautious approach.
Overall, regulators want to prevent manipulation while preserving liquidity benefits.
Conclusion
High-Frequency Trading is both a marvel of technology and a challenge for market fairness. It epitomizes the arms race between human ingenuity and machine speed. While HFT undoubtedly improves liquidity and market efficiency, it also introduces systemic risks that cannot be ignored.
As markets evolve, so will HFT—pushed forward by AI, quantum computing, and global competition. For traders, investors, and policymakers, understanding HFT isn’t just about finance—it’s about the intersection of technology, economics, and ethics in the digital age of markets.
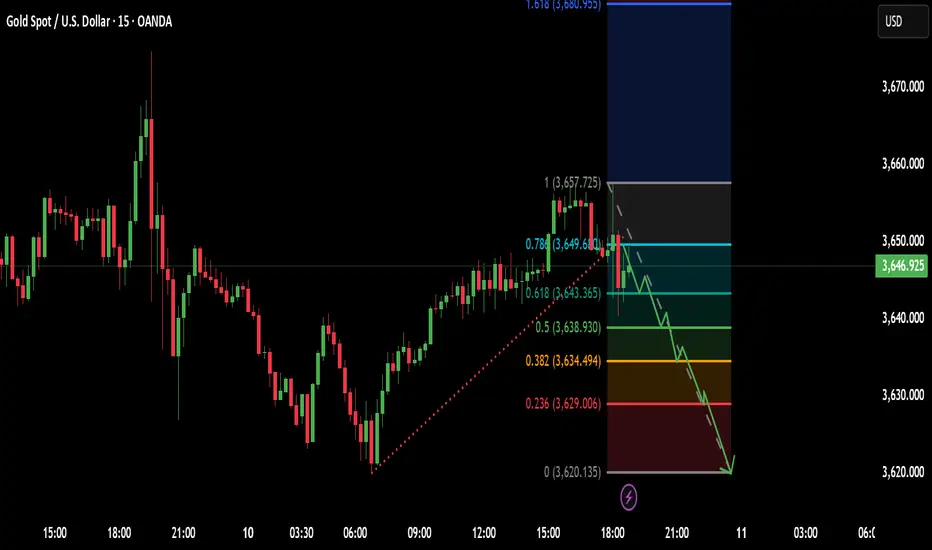
XAUUSD/GOLD 1H SELL PROJECTION 15.09.25XAUUSD/Gold 1H Sell Projection (15.09.25). Here’s a structured breakdown of what the chart indicates:
🔎 Chart Analysis
Entry Zone: Around 3646 – 3647 (confluence of trendline + 0.618 Fibonacci retracement = "Golden Ratio").
Stop Loss: Around 3653.16 (above trendline & key resistance).
Take Profit Targets:
TP1 (Support S1): Around 3639 – 3640
TP2 (Support S2): Around 3630 – 3631
🧭 Trade Idea (Sell Bias)
Reasoning:
Price has rejected the descending trendline resistance.
Confluence with Fibonacci 0.618 retracement level (3647).
Bearish projection towards support zones.
📌 Summary
Setup: Short/Sell
Entry Zone: 3646 – 3647
Stop Loss: 3653
Target 1: 3640
Target 2: 3630

XAUUSD – Pennant Pattern Waiting for ConfirmationXAUUSD – Pennant Pattern Waiting for Confirmation
Hello Traders,
Gold started the week with a strong bounce of nearly 20 dollars after testing the ascending trendline. This move further confirms the Pennant Flag formation that is currently in play. The key now is to wait for a clear breakout from this structure to position trades effectively.
Bullish Scenario
A break above the upper trendline, with confirmation ideally above 3657, would signal continuation of the uptrend.
Best entry: around 3650, targeting 3680 in the short term.
Bearish Scenario
The 3627 level is critical. A breakdown below this zone, along with a close under nearby support, would validate the bearish case.
Traders can either enter directly on the break or wait for a retest around 3630 for a cleaner entry.
Downside targets could extend to 356x or even lower.
Medium-Term Buy Setup
The 3560 – 3564 zone remains an attractive area, aligning with an FVG and strong volume accumulation.
This is a medium-term buying opportunity, with stop-loss placed below 3544.
Requires larger account size (above $1000) due to wider stop distance, but offers higher reward potential while aligning with the broader bullish trend.
This is my outlook for gold today. Traders can take it as a reference and align it with their own setups.
If you trade gold regularly, you can follow me here and join my community to receive updates quickly when the price action changes.
👉 Wishing everyone a profitable and disciplined trading week with Gold.

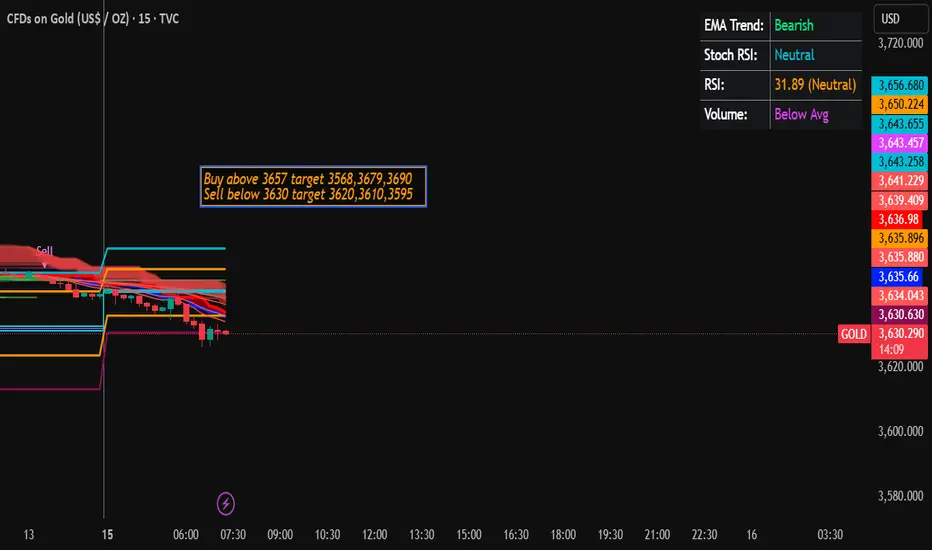
Gold Trading Strategy for 15th September 2025📊 Gold Trading Plan
🟢 Buy Setup (Long Trade)
✅ Condition: Enter a Buy trade if the 1-hour candle closes above 3657.
🎯 Targets:
First Target → 3668
Second Target → 3679
Third Target → 3690
🔒 Stop Loss: Always place a stop loss below the breakout candle’s low to manage risk.
🔴 Sell Setup (Short Trade)
✅ Condition: Enter a Sell trade if the 1-hour candle closes below 3630.
🎯 Targets:
First Target → 3620
Second Target → 3610
Third Target → 3595
🔒 Stop Loss: Always place a stop loss above the breakdown candle’s high to limit losses.
📅 Timeframe → Use the 1-hour chart only.
🕐 Wait for Candle Close → Do not enter in the middle of the candle; wait for the candle to finish.
📈 Confirmation → A close above/below the levels means the price has settled, not just touched it.
💰 Risk Management → Trade with only 1–2% of your capital per trade.
⚖️ Targets → Book partial profits at the first target, then trail stop loss for higher targets.
⚠️ Disclaimer
📌 This analysis is for educational purposes only. It is not financial advice. Trading in gold or any financial market involves high risk, and past performance does not guarantee future results. Always do your own research (DYOR) and consult with a financial advisor before making investment decisions.
Futures and Options (F&O) Trading:1. The Origins of Derivatives and F&O Trading
Derivatives are not new inventions. Their history can be traced back centuries:
Ancient Mesopotamia (2000 BC): Farmers and merchants used contracts to lock in prices of crops to avoid uncertainties.
Japan (17th century): The Dojima Rice Exchange in Osaka became one of the first organized futures markets.
Chicago Board of Trade (1848): The U.S. developed standardized futures contracts for agricultural commodities.
Over time, derivatives expanded beyond commodities into financial assets such as stocks, indices, and currencies. India entered the derivatives market in 2000, when the National Stock Exchange (NSE) introduced index futures on the Nifty 50. Soon after, single-stock futures and options followed. Today, India is one of the largest F&O markets in the world by trading volume.
2. Understanding the Basics of F&O
2.1 What are Futures?
A futures contract is a legal agreement to buy or sell an asset at a predetermined price on a specified future date.
Key points:
Futures are standardized contracts traded on exchanges.
They require margin money (a fraction of the total value) instead of full payment upfront.
Settlement can be in cash or delivery (depending on the market).
Futures are used both for hedging (risk management) and speculation (profit opportunities).
Example:
If a trader expects Reliance stock (currently ₹2,500) to rise, they may buy a futures contract at ₹2,520 expiring in one month. If Reliance rises to ₹2,700, the trader profits ₹180 per share without owning the stock.
2.2 What are Options?
An option is a contract that gives the buyer the right (but not the obligation) to buy or sell an asset at a predetermined price before or on expiry.
Call Option: Right to buy the asset.
Put Option: Right to sell the asset.
The buyer pays a premium to the seller (also called the option writer).
Example:
Nifty is at 20,000. A trader buys a 20,100 Call Option for a premium of ₹100. If Nifty rises to 20,400, the call is worth ₹300, giving a net profit of ₹200. If Nifty falls, the trader loses only the premium (₹100).
2.3 Futures vs. Options
Aspect Futures Options
Obligation Both parties obligated Buyer has right, not obligation
Upfront cost Margin (5–15% of contract) Premium (non-refundable)
Risk Unlimited Limited to premium (for buyer)
Popularity Hedging, arbitrage, speculation Speculation, hedging, income strategies
3. Structure of F&O Trading in India
3.1 Market Segments
Index Derivatives: Nifty 50, Bank Nifty, Sensex.
Stock Derivatives: Futures and options on large-cap and liquid stocks.
Currency Derivatives: USD/INR, EUR/INR, GBP/INR, JPY/INR.
Commodity Derivatives: Gold, silver, crude oil, agricultural products (on MCX/NCDEX).
3.2 Contract Specifications
Lot Size: Minimum quantity per contract (e.g., 25 shares for Reliance).
Expiry Date: Typically last Thursday of every month.
Margin Requirements: Initial margin, mark-to-market margin.
Settlement: Cash settlement is common in India for stock futures/options.
4. The Purpose of F&O Trading
Hedging: Protects against adverse price movements.
Example: An airline hedges fuel cost via crude oil futures.
Speculation: Traders bet on price direction for profit.
Example: Buying Nifty calls expecting a rally.
Arbitrage: Exploiting price differences between cash and derivative markets.
Example: Buying stock in cash market and selling futures at higher price.
Leverage: Allows trading larger positions with limited capital.
5. Advantages of F&O Trading
Risk Management: Ideal tool for hedging.
Leverage: High return potential with limited capital.
Liquidity: High volumes, especially in index derivatives.
Diverse Strategies: Flexibility to design risk-return profiles.
Price Discovery: Derivatives reflect collective market expectations.
6. Risks and Challenges
Leverage Risk: Amplifies both profits and losses.
Complexity: Requires advanced knowledge of pricing, strategies, and Greeks.
Time Decay (for options): Premium erodes as expiry approaches.
Volatility Risk: Sudden swings can wipe out capital.
Emotional Discipline: Traders often fail due to fear and greed.
7. Option Greeks – The Core of Options Trading
Options pricing is influenced by several factors called the Greeks:
Delta: Sensitivity to price changes in the underlying.
Gamma: Rate of change of delta.
Theta: Time decay of option premium.
Vega: Sensitivity to volatility.
Rho: Sensitivity to interest rates.
A successful options trader must understand and apply these Greeks in strategy building.
8. Popular Strategies in F&O Trading
8.1 Futures Strategies
Long Futures: Buy futures when expecting rise.
Short Futures: Sell futures when expecting fall.
Spread Trading: Buy one futures contract, sell another.
8.2 Options Strategies
Covered Call: Hold stock + sell call for income.
Protective Put: Buy put to hedge stock position.
Straddle: Buy call + put at same strike for volatility.
Strangle: Buy out-of-money call + put for cheaper volatility play.
Iron Condor: Sell OTM call and put, buy further OTM options to limit risk.
Conclusion
F&O trading is both an art and a science. It blends mathematics, psychology, and market dynamics into one of the most exciting areas of modern finance. For some, it is a tool of risk management; for others, it is a vehicle for wealth creation.
While futures and options provide unmatched flexibility, their leverage and complexity make them double-edged swords. Success requires education, discipline, strategy, and risk management.
In India and worldwide, F&O markets will continue to evolve, powered by technology, globalization, and growing investor participation. For traders and investors willing to learn, adapt, and respect risk, F&O trading can be an incredibly powerful journey.

Gold oscillation adjustment pattern: 3320-3360Gold oscillation adjustment pattern: 3320-3360
Next, the focus of the gold market will mainly focus on the Fed's upcoming interest rate resolution, and its interest rate cut and guidance on future policies will become key catalysts for the gold price trend in the short term.
Fundamental analysis:
1: The market generally expects the Federal Reserve to cut interest rates by 25 basis points at its meeting on September 17-18 (the probability is as high as more than 90%). The current market pricing reflects the expectation of a cumulative interest rate cut of 70 basis points this year (that is, it may also include interest rate cuts in October and December).
2: Lax labor market: The number of initial unemployment claims in the United States rose sharply last week, recording its worst performance in the past four years, strengthening the need for the Federal Reserve to cut interest rates.
3: Inflation stickiness: In August, the US CPI increased by 2.9% year-on-year and 0.4% month-on-month (0.3% exceeded expectations). This shows that inflationary pressure still exists, but the data is basically in line with expectations, and the market is more concerned about the downside risks of the employment market.
4: Geopolitical risks: The continued tension in the Middle East and the uncertainty in many places around the world continue to provide safe-haven support for gold.
5: Trend of central bank gold purchases: Many central banks around the world (such as the People's Bank of China and the Central Bank of Poland) continue to increase their holdings of gold reserves and relax import and export rules, which provides support for gold prices in the long-term structural sense.
6: "Super Economic Week": A number of major economic events and data were released this week, including US retail sales data in August ("terror data"), housing start data, and interest rate decisions from Canada, the United Kingdom and the Bank of Japan, which may exacerbate market volatility.
Technical analysis:
Macro support: US$3587-3600
Macro resistance: $3675, after breaking through, it looks at $3700 and $3758
4-hour level
Short-term support: US$3620-3630
Short-term resistance: $3660-3675
As shown in the figure: High sideways oscillation consolidation range: (3620-3660)
Short-term core range: US$3637-3650
The direction is waiting to break.
Operational strategies and suggestions
Aggressive long positions: Consider focusing on supporting the region to stabilize at US$3630-3620 and moving forward with a light position and a target of US$3658-3675, with a stop loss below 3610.
Stable long positions: If the gold price pulls back to the US$3587-3600 area and gets support, you can consider layout long positions, with the same target as above, and the stop loss is set below 3570.
Aggressive short positions: After the current resistance is under pressure in the US$3660-3674 area, try short positions with a light position, the target is US$3630-3620, and the stop loss is set above 3675.
Safe short positions: If the gold price rebounds to near the integer mark of $3,700, you can consider trying shorts, and the target is to look at a pullback of $100-150, and the stop loss is set above 3,710.

XAUUSD | FED leaning toward 50bps cut? | Buy strategy at support🟡 XAU/USD – 12/09 | Captain Vincent ⚓
🔎 Captain’s Log – Market Context
The probability of a FED -50bps cut next week has risen to 10.9% (from 8%), while a -25bps scenario is almost certain.
US jobless claims rose sharply → reflecting a weakening labor market, reinforcing expectations of FED easing.
Tonight (21:00): release of Consumer Sentiment & 1Y–5Y Inflation Outlook (University of Michigan) – data that could further impact the Dollar.
⏩ Captain’s Summary: Dollar weakness + falling bond yields = Gold remains supported to rise. However, short-term pullbacks may appear before breaking higher levels.
📈 Captain’s Chart – Technical Analysis
Storm Breaker (Resistance / Sell Zone):
Weak High: 3675 – 3677 (psychological barrier)
Peak Zone: 3676 – 3680 (high test, short-term reversal risk)
Golden Harbor (Support / Buy Zone):
FVG: 3603 – 3601
Deep Harbor: 3621 – 3623
Price Structure:
On H1, Gold has repeatedly formed BoS and Equal High (EqH) around 3645 – 3650.
An FVG appears → sign that price may need to fill the liquidity gap before continuing.
Priority scenario: Pullback to 3636 or deeper 3621, then rebound towards 3675 – 3680.
If 3680 breaks successfully → opens the way for new ATH above 3700.
🎯 Captain’s Map – Trading Plan
✅ Buy (trend-follow priority)
Buy FVG: 3601 – 3603 | SL: 3591 | TP: 3605 – 3610 – 3615 – 3620 – 36xx
Buy Zone: 3621 – 3623 | SL: 3612 | TP: 3640 – 3655 – 3665 – 3675 – 368x
⚡ Sell (short-term scalp at resistance)
Sell Zone: 3675 – 3680 | SL: 3684 | TP: 3665 – 3655 – 3645 – 36xx
⚓ Captain’s Note
“The dovish wind from the FED continues to push the golden sails forward. Golden Harbor 🏝️ (3636 – 3621) is the safe docking zone for sailors to gather strength before the new voyage. Storm Breaker 🌊 (3675 – 3680) may create big waves for short Quick Boarding 🚤 , but the main course is still heading North. If the 3680 wave breaks, the golden ship will extend its journey to new peaks above 3700.”

Trading Analysis for Gold Spot / U.S. Dollar (15-Minute Chart)Sorry I am late in giving the signal but I will say that manipulation in XAU/USD is at extreme level. Keep portfolio at least $1000.
Take buy position in XAU/USD as much as possible.
Not more than $3630.00.
Target 1 3353.00
Target 2 3358.00
Target 3 3365.00
Target 4 3372.00
SL 3630.00
Based on the provided 15-minute chart for Gold Spot / U.S. Dollar (XAU/USD), published by NaviPips on TradingView.com on June 30, 2025, at 17:53 UTC, here’s a suggested trading setup for a buy position:
Current Price and Trend: The current price is 3,241.875, with a slight increase of +0.250 (+0.01%). The chart shows a recent downtrend that appears to be stabilizing near the current level, suggesting a potential reversal point.
Buy Entry: Enter a buy position at 3,312.875 (current price), as it aligns with a support zone where the price has found a base, indicated by the horizontal dashed line and recent consolidation.
Stop Loss: Place a stop loss at 3,295.250, below the recent low, to protect against further downside. This level is approximately 10.625 points below the entry, defining the risk.
Take Profit Levels:
Take Profit 1: 3,317.875, a conservative target about 20.000 points above the entry, aligning with a minor resistance zone.
Take Profit 2: 3,324.750, a mid-range target approximately 31.875 points above the entry.
Take Profit 3: 3,332.500, a deeper target about 45.625 points above the entry, indicating a potential trend reversal.
Price Action: The chart indicates a downtrend with a possible bottoming pattern near the current level. The support zone and upward candlestick suggest a buy opportunity if the price holds.
Risk-Reward Ratio: The distance to the stop loss (10.625 points) compared to the take profit levels (20.000 to 45.625 points) offers a favorable risk-reward ratio, ranging from approximately 1:1.9 to 1:4.3.
Conclusion
Enter a buy at 3,241.875, with a stop loss at 3,295.250 and take profit levels at 3,317.875, 3,324.750, and 3,332.500. Monitor the price action for confirmation of an upward move, and be cautious of a potential continued downtrend if the price breaks below the stop loss level. (Note: I assume "take profot" was a typo for "take profit" and have corrected it accordingly.)

XAUUSD – Breakout Confirmed & Macro Outlook📊 Market Context & Macro View
Gold (XAUUSD) has broken out above its short-term descending trendline, signalling renewed bullish momentum after several sessions of consolidation. This breakout aligns with traders pricing in slower US inflation and growing confidence that the Federal Reserve may pause or ease monetary policy in the coming months.
🔹 Macro Drivers Supporting Gold:
Soft US CPI & PPI → Cooling inflation strengthens expectations for stable or lower rates.
Steady Treasury yields and a weaker USD continue to fuel gold’s upside.
Geopolitical tensions and central bank accumulation remain long-term bullish factors.
⚠ Risk: Liquidity sweeps remain possible before the Fed meeting—watch for fakeouts or sharp reversals.
🔑 Key Technical Levels (H1)
Immediate Resistance: 3,654.17 (React Zone FIB)
OBS Sell Zone: 3,664.52
Upper Liquidity Target: 3,679.31
Major Sell Liquidity: 3,709.85
Supports / Buy Liquidity Zones:
• 3,637.91 – Breakout Retest
• 3,631.63 – CP Support
• 3,622.41 – Deeper Liquidity Layer
• 3,584.78 – END Liquidity BUY ZONE
📈 Scenario & Outlook
London Session: Possible retest at 3,638–3,632 for liquidity collection before the next leg higher.
A clean break through 3,654 → 3,664 could spark strong buying toward 3,679–3,709.
Losing 3,622 would expose 3,584 as the next major support.
📌 Trading Plan
🔵 BUY ZONE 1: 3,635 – 3,633
SL: 3,629
TP: 3,640 → 3,645 → 3,650 → 3,660 → 3,670 → ???
🔵 BUY ZONE 2: 3,621 – 3,619
SL: 3,615
TP: 3,625 → 3,630 → 3,635 → 3,640 → 3,650 → 3,660 → ???
🔴 SELL ZONE: 3,708 – 3,710
SL: 3,715
TP: 3,704 → 3,700 → 3,695 → 3,690 → 3,680 → ???
🔴 SELL SCALP: 3,679 – 3,681
SL: 3,685
TP: 3,675 → 3,670 → 3,665 → 3,660 → ???
✅ Summary
Gold is maintaining its breakout, supported by softer US inflation and a weaker USD. While liquidity sweeps may occur, the overall trend remains bullish above 3,622.
👉 Follow MMFLOW TRADING for real-time updates, liquidity plays, and BIGWIN setups as gold reacts to key macro drivers and price zones.

“Gold Shines Bright | Bullish Momentum Targeting $3,700🔎 Technical Analysis – XAU/USD (1H Chart)
Trend: Strong bullish trend confirmed, with price making higher highs and higher lows.
Buy Zone: Around 3,590 – 3,600 USD, where buyers stepped in aggressively.
Short-Term Target 🎯: 3,650 – 3,700 USD (already highlighted on chart).
Key Support Levels:
3,561 USD (near-term support)
3,490 USD (major support, bullish structure invalidation if broken)
📌 Outlook: As long as price holds above the buy zone, momentum favors bulls with potential continuation toward 3,700+ USD.
🌍 Fundamental Drivers for Gold Bullishness ✨
Federal Reserve Rate Cuts Expectations 🏦⬇️ – If the Fed signals easing or holds a dovish stance, real yields fall → Gold strengthens.
Weakening US Dollar (DXY) 💵📉 – A softer dollar makes gold more attractive to global investors.
Geopolitical Risks 🌍⚠️ – Rising global tensions increase demand for safe-haven assets like gold.
Central Bank Demand 🏦🔒 – Many central banks are adding gold reserves to hedge against currency risks.
Inflation Hedge 📊🔥 – Gold remains attractive when inflationary pressures stay elevated.

XAUUSD – Will Gold Continue to Print New ATH ?XAUUSD – Will Gold Continue to Print New ATHs?
Hello Traders,
The Asian session today shows that buying interest in gold remains strong. A confirmed break above 3658 would mark a key resistance level and signal that gold could extend its bullish trend further.
Technical Outlook
The Fibonacci 2.618 extension has already produced a reaction, but in my view, liquidity in that area has not been fully absorbed. This leaves room for one more push to complete that liquidity sweep before a corrective move.
As today is Friday, there is also the possibility of a pullback to balance order flow and for the market to close the weekly candle at a lower level.
On the downside, a clear break below 3613 support would confirm a stronger bearish outlook for today’s session.
Trading Strategy
Sell Zone: Around 3688 (Fibonacci 2.618), with a suggested stop-loss of about 6 dollars.
Buy Zone: Around 3558, with a suggested stop-loss of about 8 dollars. This zone could offer potential for a deeper upside move.
Alternative Scenario: If price breaks and closes below 3613, immediate short positions can be considered as bearish momentum takes control.
This is my trading plan for gold today. Use it as a reference and feel free to share your own perspective in the comments.
