Nifty - Weekly review Feb 9 to Feb 13According to the daily chart, the price is near the trend direction deciding zone 25690 - 25720. The lower time frame chart shows that the price is getting ready to move up.
Buy above 25740 with the stop loss of 25680 for the targets 25780, 25820, 25860, 25920, 25980, 26040, 26120 and 26200.
Sell b
"Black Swan Event" on Red MondayDear all,
This finding will blow away your mind,
for Ellioticians, Gann & Astro learners it will open your ways of finding and it will give you clear picture,
1. how market is moving in ABC waves in every degree like minutes, hours , days, weeks & months.
2. How Wave C shorter created Tops and rev
Nifty - Expiry day analysis Feb 3Today, the price took support at the 24700 zone and moved towards the 25150 zone. Budget day movement has created a big range and knowing the important levels can help to make better trading decisions.
24520, 24700, 24900, 25150 and 25300 zones are important to see more strength from bulls/bears.
Bu
Stocks Breaking Out with VolumeA resistance level is a price area where a stock usually struggles to move higher. Many traders sell there, so the price keeps getting pushed down. You can think of it like a ceiling that the stock keeps hitting but cannot cross.
A breakout of resistance happens when the price finally moves abov
Macroeconomic Indicators & Central Bank Policies1. What Are Macroeconomic Indicators?
Macroeconomic indicators are statistical data points that reflect the overall health and direction of an economy. Governments, central banks, and market participants use these indicators to assess economic performance, identify risks, and make policy or investm
What is Trap of the Gap fill theory ?I make educational and conceptual based videos in the field of trading . In this video I have revised the previous concepts and not removing any of them to showcase the power of them and add a new one every other video to build something stronger for you all .
No bias, No forecasting, pure price a
Visualization of a Inverted Head and Shoulders ( Reality ) In this video I talk about general trends of the markets only - no bias - no directional indication - nothing - simply sharing how to create a setup / strategy building and concepts that I learned while becoming a full time trader - Giving back my experience .
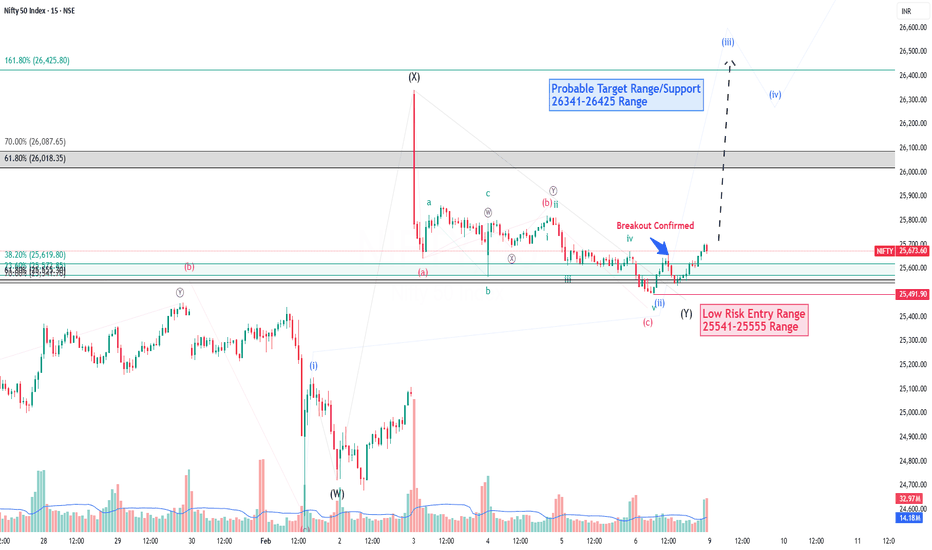
Nifty Analysis for Feb 09, 2026Wrap up:-
Nifty is now consolidating in a small range. After analysing Internal pattern of Nifty, it appears that wave 2 of 5 is completed at 25491 and wave 3 is in progress and is expected to be completed in the range of 26341-26425 after breaking of resistance 26018-26087.
What I’m Watching fo
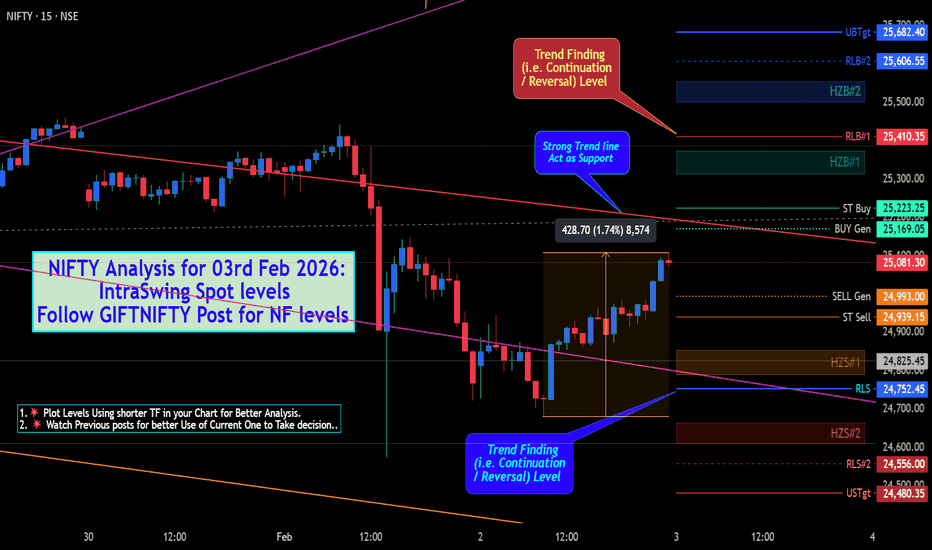
NIFTY Spot level Analysis for 03rd Feb 2026+ NIFTY Spot level Analysis for 03rd Feb 2026+
👇🏼Screenshot of NIFTY Spot All-day(02nd FEB 2026) in 5 min TF.
🚀Follow GIFTNIFTY Post for NF levels
👇🏼Screenshot of GIFTNIFTY as of now i.e.1st Session (02nd Feb 2026) in 5 min TF..
━━━━━━━━━₹₹₹₹₹₹₹₹₹₹₹₹━━━━━━━━
💥Level Interpretation / desc
Nifty50 analysis(4/2/2026).CPR: wide + ascending cpr: consolidtion
FII: 5,236.28 bought.
DII: 1,014.24 bought.
Highest OI:
CALL OI: 25800, 26000
PUT OI: 25700
Resistance: - 26000
Support : - 25500
conclusion:.
My pov:
1.today price consolidate towards 25250. because it is the place were huge support is seen.
2.i
See all ideas
Displays a symbol's value movements over previous years to identify recurring trends.
Frequently Asked Questions
India 50 CFD reached its highest quote on Dec 1, 2022 — 18,907.5 USD. See more data on the India 50 CFD chart.
The lowest ever quote of India 50 CFD is 14,050.0 USD. It was reached on Apr 21, 2021. See more data on the India 50 CFD chart.
India 50 CFD is just a number that lets you track performance of the instruments comprising the index, so you can't invest in it directly. But you can buy India 50 CFD futures or funds or invest in its components.


