NIFTY Breakout Retest — Bulls Getting ReadyNIFTY appears to be forming a classic Cup and Handle pattern, a strong bullish continuation setup. Recently, the index successfully broke out above the handle resistance zone, confirming the pattern’s validity. Currently, it is pulling back to retest the breakout level, which often serves as a healt

Nifty50 - Wave 4 Flat in Play, Triangle on the HorizonNifty’s prior correction completed as a W–X–Y, with Wave Y ending in a rare truncation — a sign of exhaustion before the next impulse began.
The following rise is unfolding into a clean 5-wave sequence. Wave 4 now appears as a flat correction but, per alternation, could stretch into a sideways trian

Nifty 1-Hour Chart – Double Top PatternA Double Top pattern has formed on the Nifty 1-hour chart, showing potential bearish reversal signals after price failed twice near the 26,100 resistance zone.
The pattern indicates that buying momentum is weakening, and sellers are likely to take control once the neckline near 25,700 is breached.


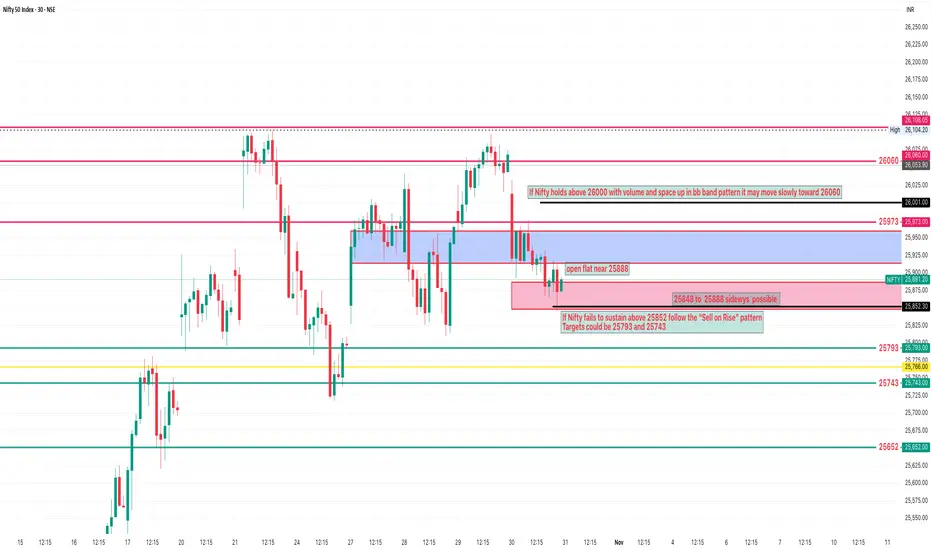
NIFTY Analysis 31 october 2025 ,Daily Morning update at 9 amif Nifty fails to sustain above 25852 u can use the “Sell on Rise” pattern
Targets could be 25793 and 25743
but if Nifty holds above 26000 with volume and forms bn pattern in bb band and space upside it may move little slowly toward 26060
Algorithmic & Quantitative TradingIntroduction
Over the past two decades, the global financial markets have transformed from bustling trading floors filled with human brokers shouting orders to high-speed electronic exchanges dominated by algorithms. This shift represents one of the most profound technological revolutions in financ

NIFTY : Trading levels and Plan for 03-Nov-2025🔹 NIFTY Trading Plan for 03-Nov-2025
(Based on psychological correction zones and technical confluences)
Chart Reference Levels:
🟩 Opening & Important Support: 25,644 – 25,682
🟧 Opening Resistance: 25,773
🟥 Last Intraday Resistance: 25,905
🩶 Last Intraday Support: 25,614
🩵 Extended Support Zone:

Nifty Expiry Analysis - 4/11/25 Market is in down trend look for PE on every rise. CE can taken above 25850. Premiums are around 150 for the ATM and ITM strike price so we can have limited movement on either side, book profits fast and do not sit in any trade for more than 15 minutes.

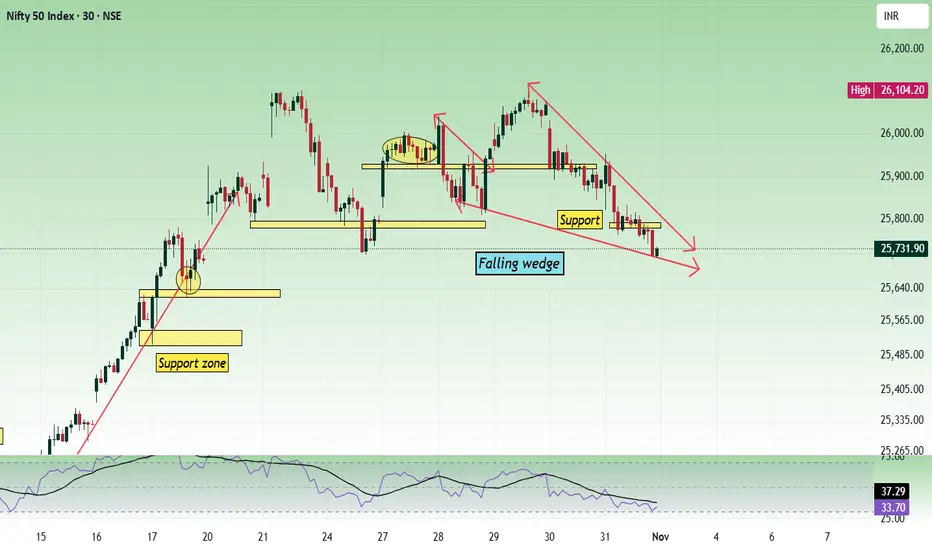
Nifty - Weekly Review Nov 3 to Nov 7Nifty in the lower time frame has formed a falling wedge, which is a bullish sign and also price is at the important crucial zone 25700. In the daily time frame, the price is showing bearish strength.
If the price breaks the 25680 - 25720 zone with bearish strength, 25500 can be tested.
Buy above
31 Oct 2025 - Finally, we are short-selling Nifty + PostMortemNifty Stance Bearish 🐻
In last week's postmortem report, we said the Diwali rally would be coming to an end. I guess I said that too early, as I was hoping for a reversal on Monday or Tuesday, but the reversal came only on Friday.
Our last long signal was on the 3rd of October and a short-reversal c

See all ideas
Displays a symbol's price movements over previous years to identify recurring trends.
Frequently Asked Questions
India 50 CFD reached its highest quote on Dec 1, 2022 — 18,907.5 USD. See more data on the India 50 CFD chart.
The lowest ever quote of India 50 CFD is 14,050.0 USD. It was reached on Apr 21, 2021. See more data on the India 50 CFD chart.
India 50 CFD is just a number that lets you track performance of the instruments comprising the index, so you can't invest in it directly. But you can buy India 50 CFD futures or funds or invest in its components.