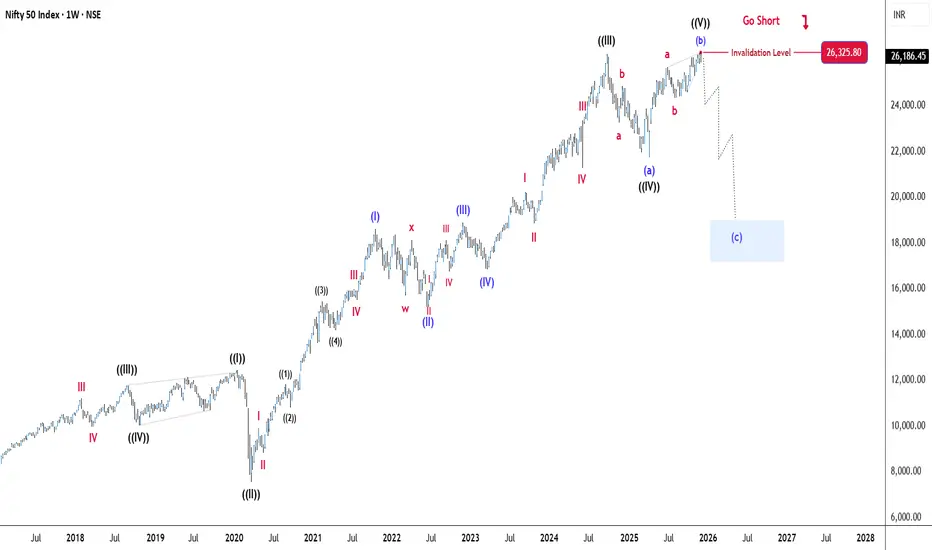
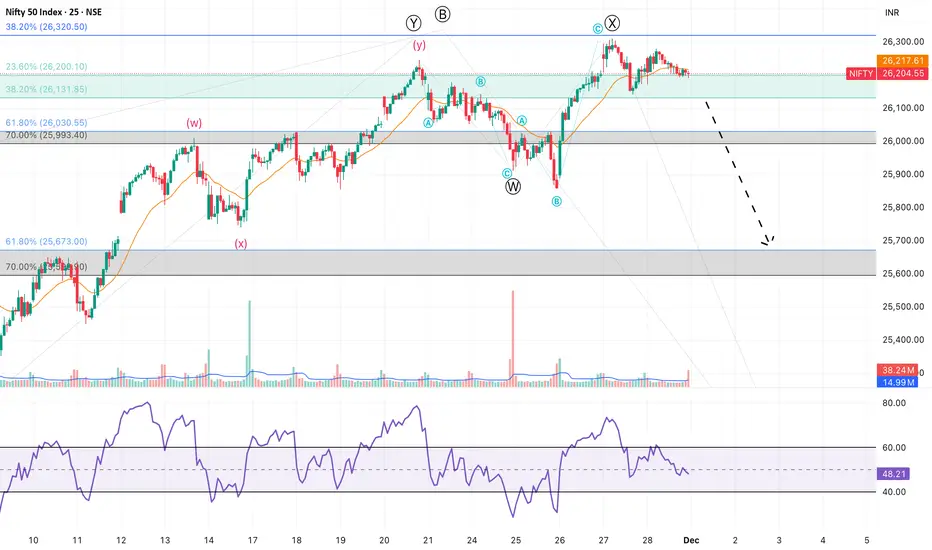
Nifty 50 - Elliott Wave Weekly AnalysisNifty 50 Now in correction face of Grand super cycle . Already Wave A and B Completed. C wave starts now (forming Expanded / Irregular Flat) end up to Fib extension of 1.618% wave A, B or Retrace 38.2% of Motive wave 2,3 so expected for correction in nifty 50 through Elliott wave theory so investors proper hedge your position or go short in FNO and big buying opportunity is coming soon...
Trade ideas
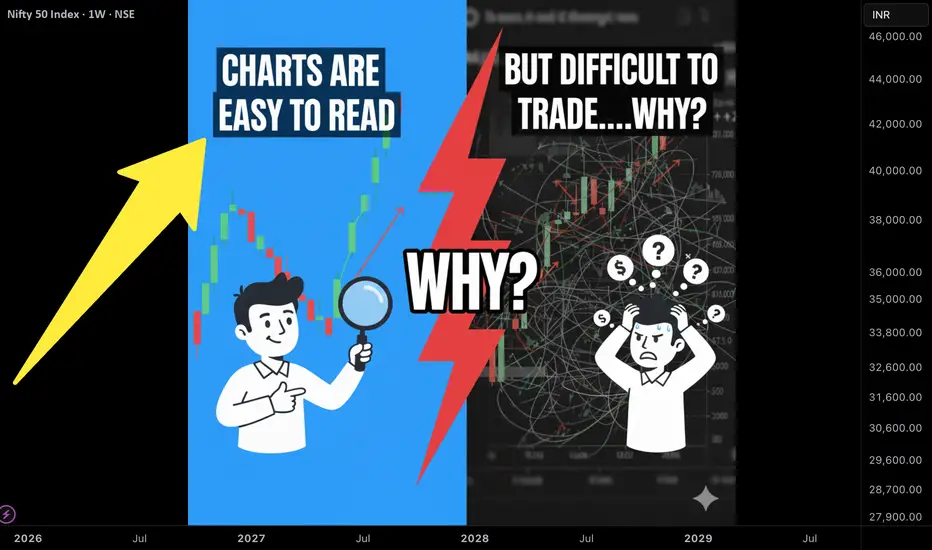
The struggle of a trader no one talks aboutWhy Chart Reading is Easy, Trading is Hard
Reading a chart is an intellectual activity.
Trading is an emotional activity.
When you're reading a chart, you're using the prefrontal cortex — the rational part of your brain responsible for calculation, logic, pattern recognition. Here, you're objective. You see the trend clearly. You think, “If price breaks this level, I’ll buy. If it fails, I’ll exit.”
But when money is on the line, another part of your brain takes control — the amygdala.
---
The Amygdala: The Trader's Hidden Enemy
The amygdala is the ancient survival system of the brain. It helped humans run from tigers, stay alert to threats, and survive danger.
To the amygdala, losing money = threat to survival.
So when price goes slightly against you, even if it’s normal market noise, the amygdala screams:
• EXIT! YOU’RE IN DANGER!
• WHAT IF IT CRASHES?
• WHAT IF YOU LOSE EVERYTHING?
Suddenly, the same breakout you trusted now looks like a bull trap.
A healthy pullback looks like a reversal.
A small red candle feels like the start of a collapse.
You don’t see the chart anymore.
You see fear.
The brain starts creating patterns that don’t exist — just like seeing shapes in clouds. That’s why traders cut winners early, hold losers too long, chase entries, hesitate to click buy, and exit at the worst time.
This is not lack of knowledge.
This is biology.
---
Junk Food and Trading: The Same Battlefield
Think of junk food.
Most people know it’s unhealthy. They know what to eat and what to avoid. They can explain calories, fat, insulin spikes — they’re logical about it.
But late at night, when emotions rise, cravings hit.
A samosa, burger, or chips suddenly look irresistible.
Thoughts change like this:
Before:
"I shouldn't eat junk."
During craving:
"One bite won't harm."
"I’ll start eating clean tomorrow."
"I worked hard today — I deserve this."
This is the same brain mechanism.
• Rational brain knows the correct decision
• Amygdala creates justification to satisfy emotion
Charts work the same way.
When you don’t have skin in the game, you’re rational.
When you're holding a live trade, your amygdala creates excuses, fears, hope — stories that blind you.
You begin to see a bullish chart as bearish, or see reversal even when it doesn’t exist. Just like junk food — you convince yourself into the wrong decision.
Not because you're stupid.
Because you're human.
---
So How Do You Beat This?
You don’t fix it by reading more books or analyzing more charts.
You fix it by training your emotional system, not just your analytical one.
Professional traders aren’t better at reading charts — they're better at managing what their mind does after entering a chart.
The goal is not to eliminate emotions.
The goal is to act despite them.
---
Final Thought
Charts are easy to read.
But trading them requires you to fight the most ancient part of your biology.
When logic meets money,
the market is no longer outside —
the real market is inside your brain.
Win there, and price will follow.
Nifty Minor Correction Retrace up to 61.8% so wait for longNifty Minor degree wave 5 Competed Contracting Leading Diagonal Pattern form so correction possible up to 61.8% level wait for long
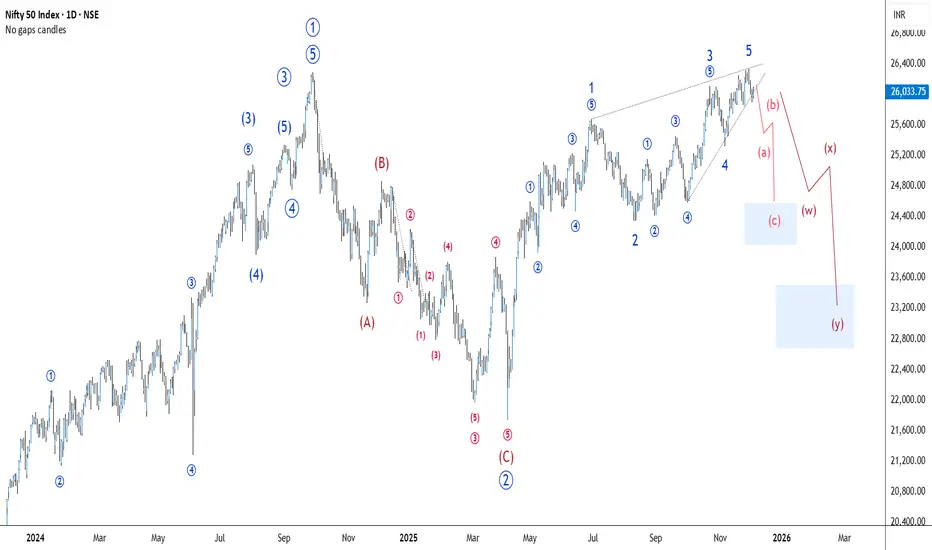
Nifty Analysis for Dec 01, 2025Wrap-up:
Nifty is forming a wxy pattern in wave C of major wave 2 has completed wave x @26310 and heading towards internal wave y.
What I’m Watching for Dec 01, 2025 🔍
Short nifty if it breaks 26131 SL 26310 for a target of 26030-25993 and 25673-22596 (SL on 15 min. candle close).
Disclaimer: Sharing my personal market view — only for educational purpose not financial advice.
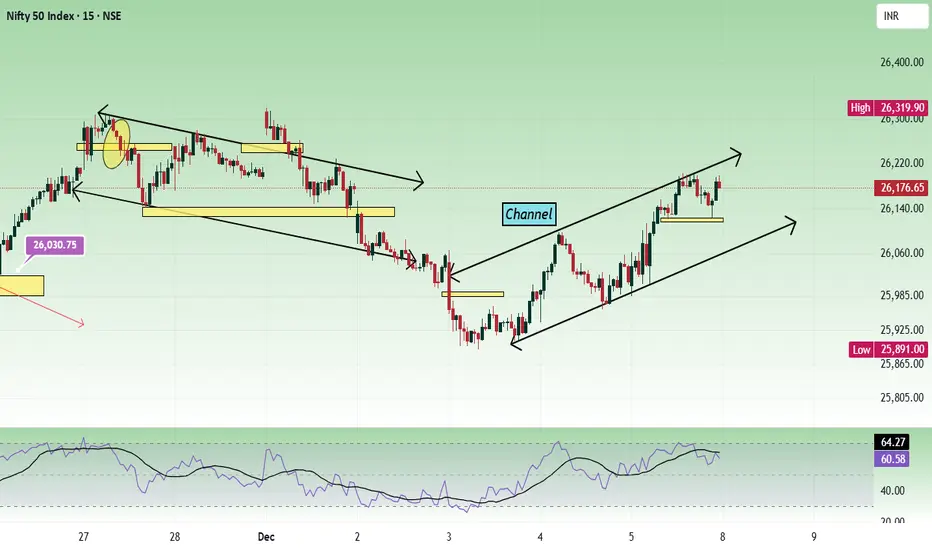
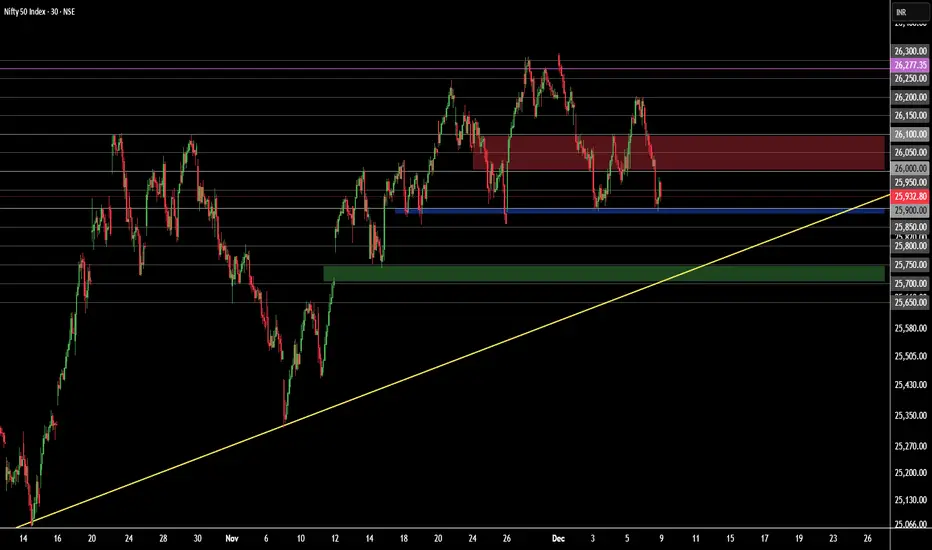
Nifty - Weekly review Dec 8 to Dec 12We can see two types of channels in the chart. Channel resistance and double top resistance is at the 26200 - 26220 zone. 26320 is another resistance. Since we can see 2 resistances nearby, and if the price is unable to gain strength, this zone can be choppy. As long as the price is above 26000, it is buy on dips unless the price falls with strong bearish strength.
Friday's movement was bullish as per the daily chart.
Buy above 26100 with the stop loss of 26050 for the targets 26140, 26180, 26240, 26300, 26360, 26420 and 26480.
Sell below 25900 with the stop loss of 25960 for the targets 25860, 25820, 25760, 25700, 25660, and 25600.
Always do your analysis before taking any trade.
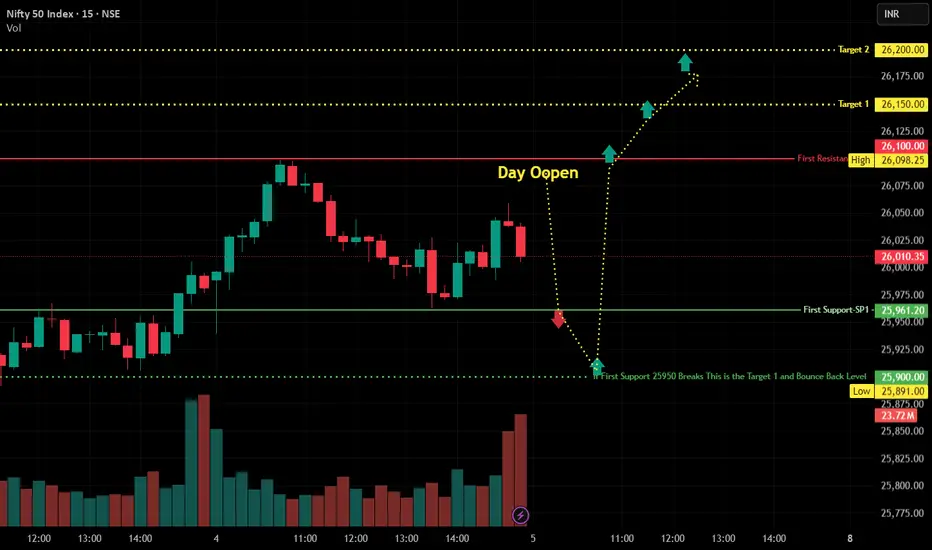
Nifty Tomorrow Levels 5 Dec 2025 May go like that These are the nifty 50 Levels for 5 Dec 2025 as data shows 25900 is strong support may act as bouncing point as near DEC future is going slow. Not big gap up open. If it breaks first R1 26100 then rally may go towards Target 1= 26150 and toTarget 2= 26200.
Not much expected big moves will be range bound and decay Theta. After 1 PM.
This is not any investment idea or buy sell advice. Act according to your own studies.
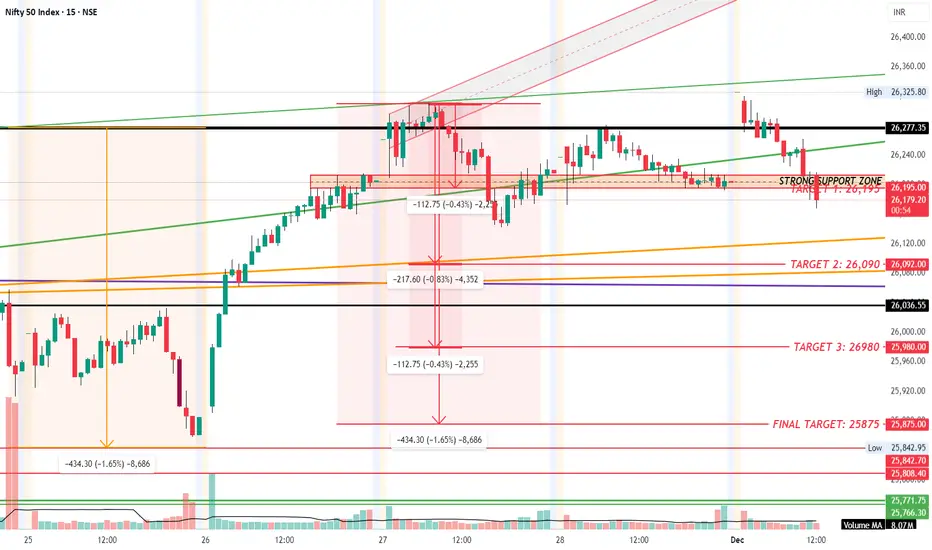
NIFTYNIFTY MADE HIGH WITH DOUBLE TOP along with DIVERGENCE, with stong support at 26200 level, if it breakdown this level we can expect NIFTY to fall below 26000 with final taget of 25,900
NIFTY - BEARISH BAT or ABC corrective rise?TF: 15 Minutes
CMP: 26136
If we consider this as an ABC rise of the entire fall from 26320 levels, then it should halt at 26170 odd and reverse.
In Harmonic pattern, BEARISH BAT formation is visible and the desired target for this is at 26270
Lets see how the price unfolds
Disclaimer: I am not a SEBI registered Analyst and this is not a trading advise. Views are personal and for educational purpose only. Please consult your Financial Advisor for any investment decisions. Please consider my views only to get a different perspective (FOR or AGAINST your views). Please don't trade FNO based on my views. If you like my analysis and learnt something from it, please give a BOOST. Feel free to express your thoughts and questions in the comments section.

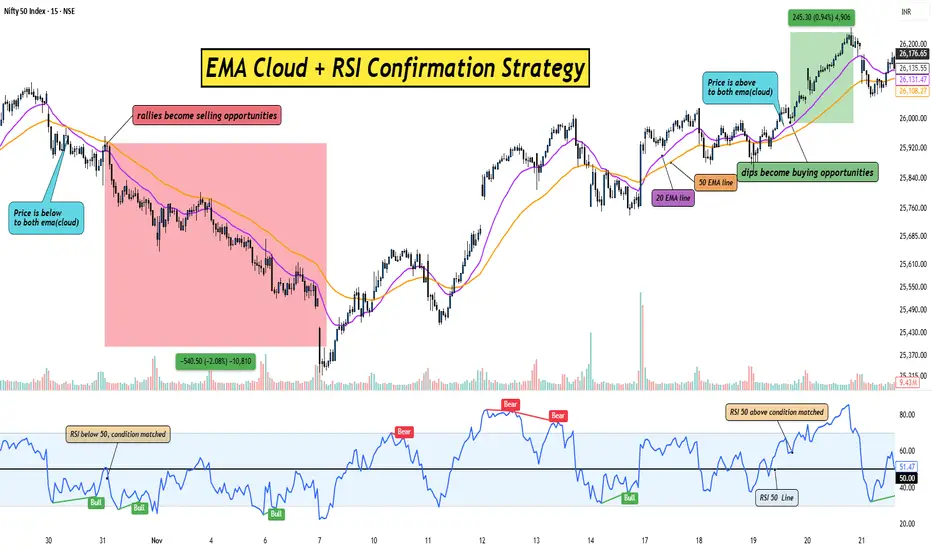
The EMA Cloud+RSI Combo That Traders Are Using to Catch Big MoveHello Traders!
If you struggle with false breakouts and early entries, this simple combination of the EMA Cloud and RSI Confirmation can help you filter noise and catch cleaner trend moves.
This setup works for Stocks, crypto, indices, forex, any market where trends matter.
Let’s break it down in the simplest way possible.
1. What Is the EMA Cloud?
The EMA Cloud is a zone created using two EMAs, commonly the 20 EMA and 50 EMA.
When price stays above the cloud, the trend is bullish and dips become buying opportunities.
When price stays below the cloud, the trend is bearish and rallies become selling opportunities.
The cloud visually shows where momentum is strong versus where price is losing strength.
2. Why Add RSI Confirmation?
RSI helps you avoid chasing overextended moves.
You only take a trade when RSI aligns with the cloud direction, giving you confirmation.
This reduces false entries and improves accuracy.
EMA Cloud gives the trend.
RSI gives the green signal to enter.
3. Entry Rules:– Simple and Clear
For Longs:
Price must stay above the EMA Cloud.
RSI should be above 50 to confirm bullish momentum.
Enter on a small pullback into the cloud or after a breakout candle closes above it.
For Shorts:
Price must stay below the EMA Cloud.
RSI should be below 50 for bearish confirmation.
Enter on a pullback toward the cloud or a breakdown candle.
This combination prevents you from buying too early or selling too late.
4. Exit Strategy:– Keep It Clean
Exit when price closes inside the EMA Cloud against your direction.
Aggressive traders can exit when RSI crosses back below 50 (for longs) or above 50 (for shorts).
Always trail your stop loss below the cloud to lock in gains.
The cloud helps you ride the trend longer with less stress.
5. Why This Strategy Works So Well
EMA Cloud filters the market trend.
RSI filters the momentum.
Together, they eliminate 70% of noise and give you only the smoothest trend trades.
It’s simple, visual, and beginner-friendly, yet powerful enough for advanced traders.
Rahul’s Tip:
Don’t rush entries just because the market is moving fast.
Wait for cloud direction + RSI confirmation, this patience alone can double your accuracy.
Conclusion:
The EMA Cloud + RSI Confirmation Strategy is a clean, reliable way to follow trends without second-guessing.
It removes emotional entries, filters noise, and gives you structured trade opportunities.
Use it consistently, and you’ll notice how much clearer your charts feel, and how much calmer your decision-making becomes.
If this post helped you understand a simple yet effective trend strategy, like it, comment your thoughts, and follow for more practical trading setups!
market levels indicated lets see market respect the indicated levels by my limited understanding of technical analysis of chart patterns

NIFTY : Trading levels and Plan for 04-Dec-2025📊 NIFTY TRADING PLAN — 04 DEC 2025
Current market context:
Price is hovering near 25,981, sitting just below key intraday levels. The index showed a late recovery on 3rd Dec, but still remains inside a broader corrective structure. Tomorrow’s opening reaction near the Opening Support (25,953) and Opening Resistance (26,020) will set the tone for the session.
Below is the complete trading plan based only on the marked levels in your chart.
🚀 1. GAP-UP OPENING (100+ points)
A strong gap-up above 26,020 indicates early bullish strength and short-covering. However, note that price will immediately approach the Last Intraday Resistance Zone: 26,094–26,119, which has been a major rejection zone earlier.
1. Opening above 26,020 → Look for Retest Entry
• Avoid chasing a gap-up candle.
• Wait for price to retest 26,020, show wicks / bullish engulfing / CHoCH reversal.
• If retest holds → Upside targets toward 26,160 → 26,224.
• This is safest because it confirms buyer presence.
2. If gap-up directly opens inside 26,094–26,119 (resistance box)
• Avoid long entries.
• Expect sellers to react.
• Look for rejection wicks & bearish structure shift.
• Short trades are only valid if price breaks below 26,020 after rejection.
3. Bullish Continuation Above 26,119
• If the resistance box breaks with strong momentum → Trend continuation.
• Next immediate upside: 26,160 → 26,224 (chart-projected path).
📌 Educational Note:
Gap-up openings often trap late buyers. A retest is safe because it confirms that the gap is being accepted by the market.
⚖ 2. FLAT OPENING (±50 points around 25,980)
Flat opens near Opening Support (25,953) or Opening Resistance (26,020) offer the best price-action trades.
1. If price holds 25,953 and forms higher-lows
• Buyers defending strongly.
• Look for bullish structure → Target 26,020 → 26,094.
• Sustained breakout above 26,020 gives a clean intraday long.
2. If price rejects 26,020
• Watch for bearish engulfing / rejection wicks.
• First downside target: 25,953
• Break below this → Trend may shift bearish for the day.
3. Range Day Setup
If price stays between 25,953–26,020, trade only extremes:
• Buy near 25,953 (only on confirmation).
• Sell near 26,020 (only on confirmation).
📌 Educational Note:
Flat opens are the most reliable for retail traders because structure is clearer and volatility is normal.
📉 3. GAP-DOWN OPENING (100+ points)
A gap-down into the Last Intraday Buyer Support (25,732–25,798) signals fear, stop-run liquidity, and possible reversal zones.
1. If price opens inside 25,732–25,798
• DO NOT short the open.
• This zone is where buyers previously defended.
• Look for reversal: hammer candle, divergence, or CHoCH.
• If reversal signs appear → Long trade targeting 25,953 → 26,020.
2. If price breaks below 25,732
• This is bearish continuation.
• Only short on retest of the broken zone.
• Downside targets: 25,680 → 25,640 (chart-projected bearish path).
3. If price recovers quickly from the gap-down
• V-shape reversals are common in strong markets.
• Once above 25,798, bullish continuation toward 25,953 → 26,020.
📌 Educational Note:
Gap-downs often sweep liquidity and reverse sharply. Confirmation is crucial before entering any trade.
🛡 RISK MANAGEMENT TIPS FOR OPTIONS TRADERS
1. Avoid buying options in the first 5–10 minutes after a gap opening. Volatility crush can hurt premiums.
2. Always define your stop-loss based on price levels, not premium. Price levels are more stable.
3. Avoid trading against major zones (resistance/support).
4. Use position sizing:
Never risk more than 1–2% of your trading capital on a single trade.
5. If IV is high → Prefer selling strategies.
If IV is low → Buying options becomes more efficient.
6. Don’t revenge trade. If levels break unexpectedly, step aside and re-plan.
📌 SUMMARY & CONCLUSION
• Bullish bias only above 26,020 → 26,094
• Range-bound between 25,953–26,020
• Strong reversal zone at 25,732–25,798 on gap-down
• Gap openings must always be traded with retests, not predictions
• Focus on market structure and reactions at these marked levels
Trade with discipline, follow levels, and avoid over-positioning during high volatility.
⚠ DISCLAIMER
I am not a SEBI-registered analyst.
This trading plan is for educational purposes only and not investment advice.
Market conditions can change rapidly—always use your own judgment and risk management.

NIFTY Levels for Today
Here are the NIFTY's Levels for intraday (in the image below) today. Based on market movement, these levels can act as support, resistance or both
Please consider these levels only if there is movement in index and 15m candle sustains at the given levels. The SL (Stop loss) for each BUY trade should be the previous RED candle below the given level. Similarly, the SL (Stop loss) for each SELL trade should be the previous GREEN candle above the given level.
Note: This idea and these levels are only for learning and educational purpose.
Your likes and boosts gives us motivation for continued learning and support.
05 Dec 2025 - Nifty is still Bullish, Next Target 23400?Nifty Stance Bullish 🐂
Last week, we started with the bullish tone, but our EMAs crossed over, and we had to go bearish on Tuesday, 2nd Dec. Although we fell to the support level of 25906 by Wednesday, we did not have enough momentum to break those levels.
What happened next was almost predictable; we got a good bounce of 310+ points to retrace back to the last Friday's (28th Nov) closing levels-the result, two back-to-back stop-loss hits. The technicals should help us close above 26400 this expiry.
At present, the market looks bullish because we do not have any more bearish news left. After clocking a better-than-expected GDP of 8.2%, everyone would have hoped for an instant run to 27000+ levels, but anyone who is seriously watching this space would know the relationship between GDP and Inflation. When the last reported Inflation is only 0.5%, it means that our nominal GDP is only 8.2+0.5 = 8.7% which has come in a lot lower than expectations.
We also witnessed #USDINR hitting a new high of 90.4370, and we all know that when the real GDP of a country rises, the currency seldom depreciates. Now read this along with a fall in GST collections and a lower PMI (Purchasing Managers Index).
We also saw the RBI cut the repo rates by 25 bps, further increasing the liquidity. All the economic indicators are pointing to a period of recession or slower growth. Maybe the past is behind us, and Nov 2025 was the lowest point of sales.
The government has already reduced GST rates as well as income tax cuts, and that should mean growth and consumption should pick up in the times to come. If so, our markets could be gearing up for the next level of bull run, but before that, we need to see spurts of growth at the grassroots level.

NIFTY Levels for Today
Here are the NIFTY's Levels for intraday (in the image below) today. Based on market movement, these levels can act as support, resistance or both
Please consider these levels only if there is movement in index and 15m candle sustains at the given levels. The SL (Stop loss) for each BUY trade should be the previous RED candle below the given level. Similarly, the SL (Stop loss) for each SELL trade should be the previous GREEN candle above the given level.
Note: This idea and these levels are only for learning and educational purpose.
Your likes and boosts gives us motivation for continued learning and support.

Nifty 50 Price Structure Analysis [09/12/2025: Tuesday] Top-Down Nifty 50 price structure analysis for 09th December 2025. The day is Tuesday.
(1) Monthly Time Frame:
Red indecisive candle. Major resistance is at level 26100. Minor support is at level 25900. The view is indecisive to bearish.
(2) Weekly Time Frame:
First day of the week. Today's red candle confirms that last week's red paper umbrella was a hanging man. Clear sign of trend reversal. Major resistance is at level 26100. Minor support is at level 25900. The view is bearish.
(3) Daily Time Frame:
It's kind of a red morubozu with a minor 50 points lower wick. The candle engulfed the last 2 days of green candles. A major resistance zone is formed at the levels 26100 - 26000. Minor support is at level 25900. The view is bearish.
(4) 30-Minute Time Frame:
Two trend reversal patterns are observed. The first pattern is head & shoulder (H&S). The second pattern is a triple top. It's a clear sign of trend reversal. The neck of both the H&S and triple top is formed at the level 25900. A major resistance zone is formed at the zone 26100 - 26000. Minor support is at level 25900. Every up move should be doubted. The view is bearish.
Events:
Nifty 50 weekly expiry. No other high-impact event. However, a major event is on 12 December - the FED interest rate decision. Thus, volatility is expected.
Bullish Scenario Set-Up:
(i) Price sustains above the opening price.
(ii) Price sustains above the level 26100.
Bearish Scenario Set-Up:
(i) Price sustains below the opening price.
(ii) Price sustains below the level 25900 and shows promise of breaking below the level 25850.
(iii) Bearish target is in the zone (25750 - 25700)
Expectations (Hypothesis and Insights from the Trading Plan):
(i) Take a bearish position only. Price must break the level 25900 and show promise of trading below the level 25850.
(ii) Doubt every up move.
(iii) Take no bullish trade until the price starts to trade above the level 26000 - 26100.
(iv) There is a higher probability of breaking down (bearish trend continuation).
(v) After price breaks below the level 25850, there is a higher chance that the price will try to fill the gap in the zone 25750 - 25700.
(vi) Its expiry day. So, expect uncertain price movement in the second half.
(vii) It may happen that bulls might try to expire price above the level 26000 by the end of the day.
(viii) Trade only when bullish/ bearish conditions are fulfilled. Otherwise, don't trade. Protect your resources.
NOTE:
"Mark your points. Trade your points. Price is God. Anything can happen. Therefore, trade what you see, not what you believe."
Happy Trading!
Nifty 1H Elliott Wave Analysis Nifty 1H trend is Bearish - Ending Diagonal 5 Waves Completed and break channel pattern then C wave grand super cycle degree is started now c1,c2 in completed (cycle degree) c3 running expected target 1.618 to 2.618 of Fib level So correction is going don't go long protect your position in proper hedging or go short

NIFTY Levels for TodayHere are the NIFTY's Levels for intraday (in the image below) today. Based on market movement, these levels can act as support, resistance or both
Please consider these levels only if there is movement in index and 15m candle sustains at the given levels. The SL (Stop loss) for each BUY trade should be the previous RED candle below the given level. Similarly, the SL (Stop loss) for each SELL trade should be the previous GREEN candle above the given level.
Note: This idea and these levels are only for learning and educational purpose.
Your likes and boosts gives us motivation for continued learning and support.
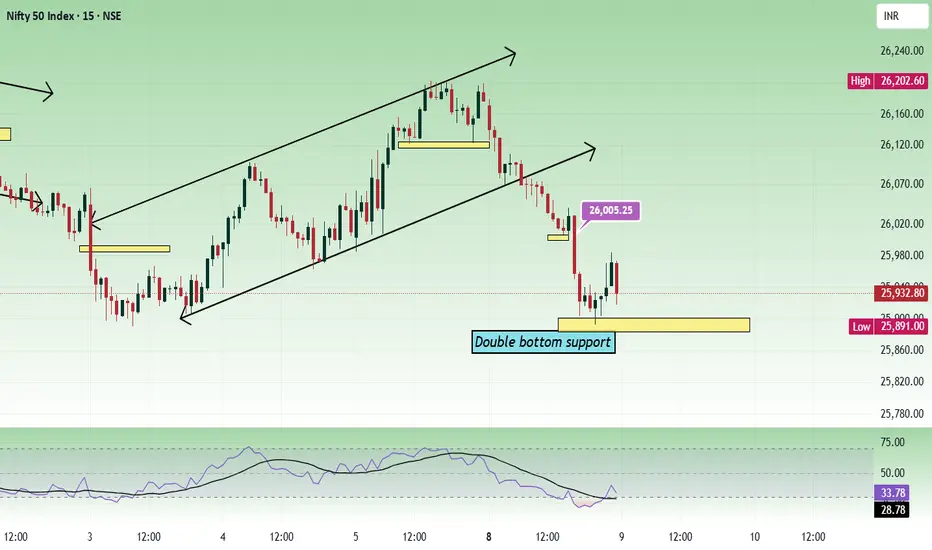
Nifty - Expiry day analysis Dec 9The price broke the channel and fall down towards the double bottom support at the 25900 zone. The price can move in this range 25800 to 26200 as per the higher(daily) and lower(15 minutes) chart analysis.
As per the daily chart, we can see a strong support at the 25850 zone.
Buy above 25900 with the stop loss of 25840 for the targets 25940, 25980, 26020, 26100, 26160 and 26200.
Sell below 25780 with the stop loss of 25840 for the targets 25740, 25700, 25640, 25600 and 25540.
Expected expiry day range is 25700 to 26100.
Always do your analysis before taking any trade.
Nifty 50 - 26050 > 26150 > 25900 > 25750 For this week expirySir/Mam,
For safe trader buy on dips if the level touches 25700 - 25800 - This range is Strong buy zone. Buy CE strike price 25600 Dec expiry.
For Medium risk trader buy PE and CE 26050 (now it is 137.50 + 204.15) of 16 Dec expiry.
For High-risk trader buy PE 09 Dec expiry (26250 - Price 215) at current level - Market has some downfall till 25800 - 25775 levels till this coming expiry it will show the direction.
Mind Thought - If you want to book profit in Option Trading you must be - Confidence, accept the losses, try again until you gain profit in it.
Just reminder -
For getting Degree a student has to wait till 15 years - True fact to digest.
Then for trading how much year you want to get perfect/degree? - Do make a comment for this Q

NIFTY Levels for TodayHere are the NIFTY's Levels for intraday (in the image below) today. Based on market movement, these levels can act as support, resistance or both
Please consider these levels only if there is movement in index and 15m candle sustains at the given levels. The SL (Stop loss) for each BUY trade should be the previous RED candle below the given level. Similarly, the SL (Stop loss) for each SELL trade should be the previous GREEN candle above the given level.
Note: This idea and these levels are only for learning and educational purpose.
Your likes and boosts gives us motivation for continued learning and support.

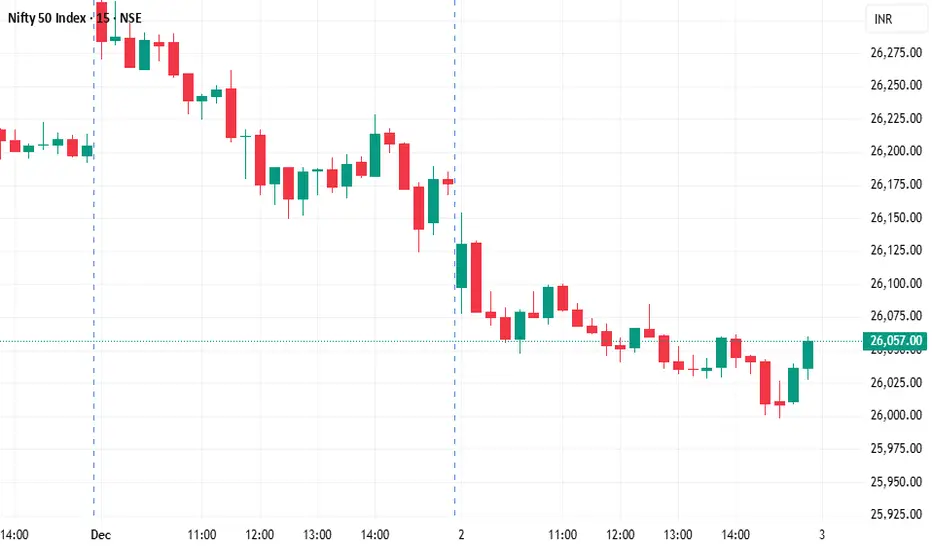
Nifty - Expiry day analysis Dec 2The price faced resistance at 26320 and fall down towards support. Now the price is testing the double bottom support at 26120.
If the price opens gap down and shows a bullish sign around the 26040 zone, buy above 26060 with the stop loss of 26010 for the targets 26100, 26140, 26180 and 26220. Channel resistance will be there at the 26200 zone.
If the price opens flat, check how it is reacting around 26200 and if it shows bullish strength, buy above 26240 with the stop loss of 26190 for the targets 26280, 26320, 26360 and 26400.
Sell below 25980 with the stop loss of 26030 for the targets 25940, 25900, 25860 and 25820.
Please note if the price opens at the 25300 zone or 25200 zone and shows bearish strength, then it is a sell.
Expected expiry day range is 25900 to 26300.
Always do your analysis before taking any trade.

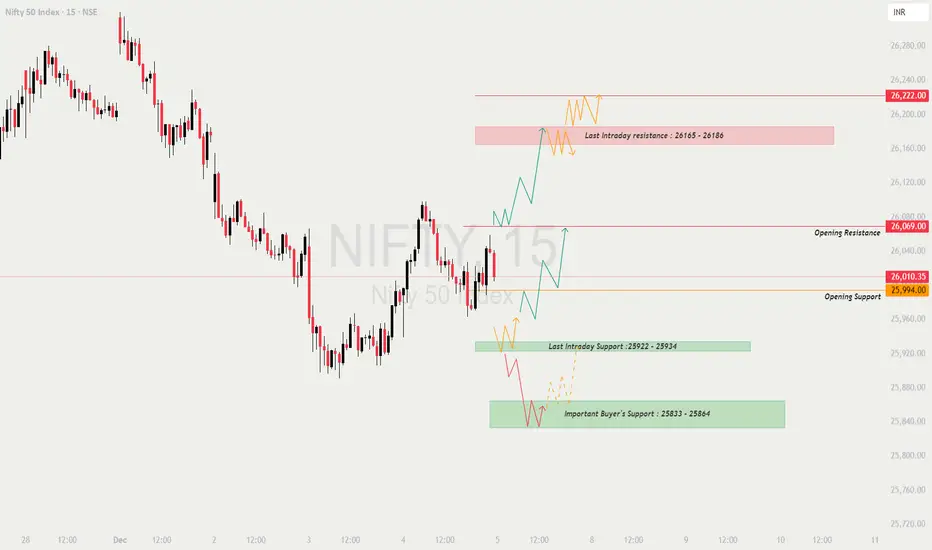
NIFTY : Trading levels and Plan for 05-Dec-2025📊 NIFTY TRADING PLAN — 05 DEC 2025
Price closed near 26,010, sitting between Opening Resistance (26,069) and Opening Support (25,994).
The structure is recovering from a corrective fall, but Nifty must break above 26,069 to show strength, while downside liquidity still sits at Last Intraday Support (25,922–25,934) and the deeper Important Buyer’s Support (25,833–25,864).
Market will likely react strongly to these zones.
🚀 1. GAP-UP OPENING (100+ points)
A gap-up near or above 26,110–26,150 will place Nifty closer to the major resistance zone.
1. If price opens above 26,069 and holds (positive sign)
• Avoid chasing the first candle.
• Wait for a retest of 26,069 — this confirms buyers are genuinely strong.
• If retest holds → Long entry toward 26,165 → 26,186 (Resistance Zone).
• Partial booking advisable inside the resistance box.
2. If gap-up opens directly inside 26,165–26,186 (Last Intraday Resistance)
• High probability of rejection and profit booking.
• Avoid fresh longs in the resistance box.
• Look for reversal wicks → Possible short trade back toward 26,069.
3. If breakout sustains above 26,186
• Momentum expansion likely.
• Upside target becomes 26,222.
• Partial profit booking recommended due to stretched move.
📌 Educational Note:
Gap-ups often trigger emotional buying. Retest entries reduce risk and align you with institutional flow.
⚖ 2. FLAT OPENING (Near 26,000 ± 40 pts)
A flat open provides the cleanest structure and the most reliable intraday setups.
1. If price sustains above 26,069
• Strong sign of buyer intent.
• Long setups activate above 26,069 with targets: 26,165 → 26,186 → 26,222.
• Protect the trade with tight SL under the breakout zone.
2. If price rejects 26,069
• Look for bearish wick patterns or CHoCH.
• Potential drop toward 25,994.
• Break below 25,994 → Trend weakens → Next stop 25,922.
3. If price trades between 25,994–26,069
• Expect range movement.
• Buy low (25,994) and sell high (26,069) only with confirmation.
• Avoid aggressive trades inside the range.
📌 Educational Note:
Flat opens allow price action to show its true direction—higher-lows indicate bullishness, lower-highs signal weakness.
📉 3. GAP-DOWN OPENING (100+ points)
A gap-down near 25,900–25,940 puts the market into key demand territory.
1. If gap-down opens inside Last Intraday Support (25,922–25,934)
• Never short this zone blindly — expect buyer reactions.
• Look for reversal signs: hammer, bullish engulfing, CHoCH.
• If reversal confirmed → Long toward 25,994 → 26,069.
2. If gap-down opens directly into Important Buyer’s Support (25,833–25,864)
• This is a strong liquidity pocket.
• Ideal for bullish reversal trading.
• Watch price action carefully — if reversal prints → Long toward 25,922 → 25,994.
3. If support breaks decisively below 25,833
• Avoid chasing breakdown.
• Wait for retest of 25,833–25,864.
• If retest rejects → Short toward 25,770 → 25,720 (measured move targets).
📌 Educational Note:
Gap-downs often act as liquidity traps. Smart money accumulates aggressively before price reverses upward. Always wait for confirmation.
🛡 RISK MANAGEMENT TIPS FOR OPTIONS TRADERS
1. Avoid the first 5 minutes on a gap-up or gap-down day.
The market needs to stabilise.
2. Do NOT buy far OTM options after a big gap.
Premium crush eats your capital.
3. Always keep a price-level-based stop-loss, not a premium-based SL.
4. Follow 1–2% maximum risk per trade.
5. When IV is high → Prefer selling strategies (credit spreads).
When IV is low → Option buying becomes favourable.
6. Book partial profits at key zones such as 25,994, 26,069, 26,165.
7. Never revenge trade. Reset your mind after a stop-loss hit.
📌 SUMMARY & CONCLUSION
• Bullish bias above 26,069, with upside targets 26,165 → 26,186 → 26,222.
• Range-bound behaviour expected between 25,994–26,069.
• Strong bullish reversal zones below:
– 25,922–25,934
– 25,833–25,864
• Gap openings must always be traded with retests and confirmations.
• Stick to structure, avoid emotional entries, and respect your stop-loss.
⚠ DISCLAIMER
I am not a SEBI-registered analyst.
This trading plan is for educational purposes only and should not be considered investment advice.
Market conditions can change rapidly—trade using your own judgment and strict risk management.
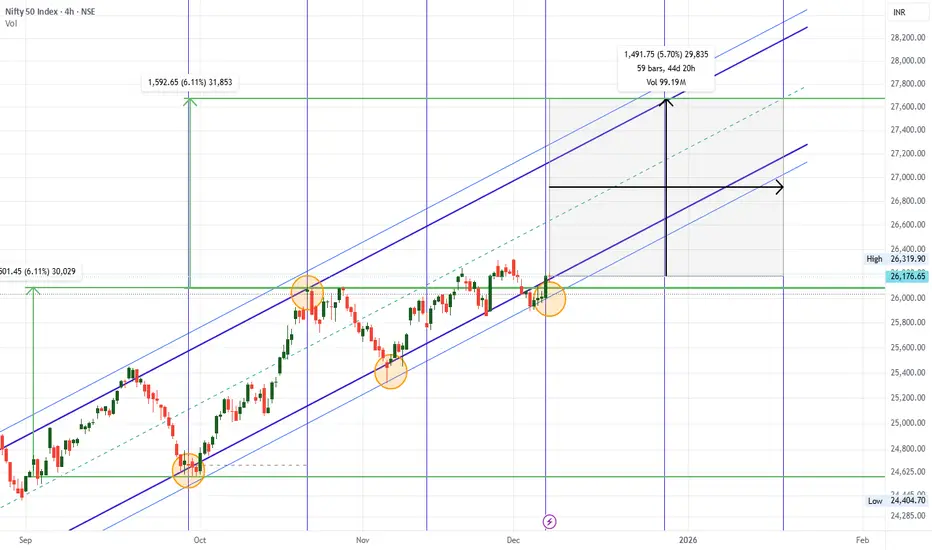
NIFTY 27500+ Target possible by Feb End.NIFTY 27500+ Target possible by Feb End.
Nifty is seen breaking out from ATH of 26300+. Momentum looks very Bullish on Nifty.
With the RBI Rate cut & growing GDP .... Banking / Auto Sectors looks good for few quarters. Investment done in Quality stock would provide gains of 10-15% in coming 2-3 Quarters.
LTP - 26186
SL - 25600
Targets - 27500+
Risk Reward Ratio - 1: 2.25
Happy Investing.