market sliding to 25518 ,25060 ,24917in weekly chart there is clearly showing pin bar or inverted hammer or doji or you can say anything any name where closing bellow of this candle will lead to my target level of 25518,25060,24917 level as there is breakdown support vertical trend-line and support levels
Trade ideas

Nifty - Weekly analysis Oct 27 to Oct 31The price faced resistance at the 26100 - 26120 zone and fall down. Important support levels are 25600 and 25800. 25500 is a psychological level.
If the price opens flat, buy above 25820 with the stop loss of 25760 for the targets 25860, 25900, 25960, 26020, 26080, 26120 and 26180.
Sell below 25700 with the stop loss of 25760 for the targets 25640, 25600, 25560, 25520, 25480 and 25420.
We are having nearby support levels, namely 25500, 25600, and 25800. The price can change direction and become volatile in that area.
Always do your analysis before taking any trade.
Nifty- Action Near the TopFrom technical perspective there is a triangular contraction formation (which extended from July to Mid-October) seen on this 75 minutes Nifty chart. It was followed by a strong breakout in the mid-October giving a vertical rise scenario.
➡As it is pulling back, there is a Support zone near 25850 (Volume Point of Control), which if holds might take the Index to new highs or at least to its previous highs.
Even if this support holds, I expect a slow grinding action with wide range swings on both the sides near previous highs.
➡A second scenario could be that 25850 doesn't holds. In this case we can expect a test of next potential support zone near 25330.
This was also the breakout zone of the triangle contraction, so the sellers might take it there for a retest before the price pushes back up.
What do you think at this point?
💬Will it hold the current support, or will it move to the next support?
📣Not a buy-sell recommendation, for educational purpose only.
Boost & comment for more such ideas in future.

Nifty50 - Wave 4 Flat in Play, Triangle on the HorizonNifty’s prior correction completed as a W–X–Y, with Wave Y ending in a rare truncation — a sign of exhaustion before the next impulse began.
The following rise is unfolding into a clean 5-wave sequence. Wave 4 now appears as a flat correction but, per alternation, could stretch into a sideways triangle while holding above the 0.382–0.5 zone.
Once complete, Wave 5 may challenge and possibly clear the ATH line.
Disclaimer: This analysis is for educational purposes only and does not constitute investment advice. Please do your own research (DYOR) before making any trading decisions.

Nifty Price Action Analysis for Nov 202525-Oct-25:
Nifty broke 25500 resistance with good volume on 15th Oct.
CMP is 25795 as on 24th Oct.
For November series Nifty is likely to take pullback support at 25400-25600 levels then at 25100 levels.
Major uptrend support lies at 24600 levels for another attempt for lifetime high

Nifty - Monthly Expiry Analysis Oct 28We had a trending movement in the morning session and consolidation in the afternoon session. Nearby resistance is seen at 26100 - 26120.
Buy above 25940 with the stop loss of 25890 for the targets 25980, 26020, 26080, 26120 and 26160. This scenario will work if the price opens above 25900 and shows bullish strength.
As per the daily chart, the price is bullish.
Sell below 25840 with the stop loss of 25890 for the targets 25800, 25760, 25720, 24680 and 25620. This scenario will work if the price shows a strong bearish sign in the zone 25900 to 26000.
Always do your analysis before taking any trade.

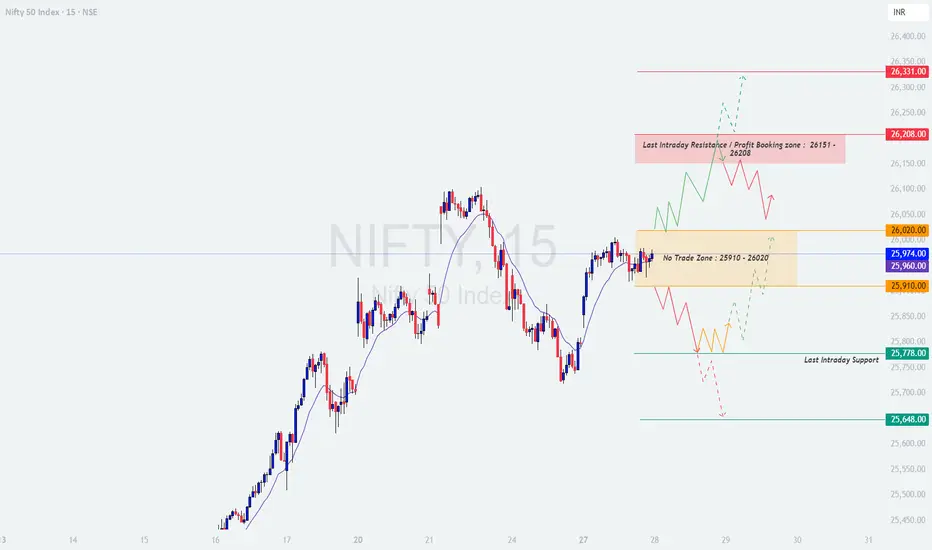
NIFTY : Trading levels and Plan for 28-Oct-2025 (Educational)NIFTY TRADING PLAN – 28-Oct-2025
📊 Nifty closed around 25,974, hovering within the No Trade Zone (25,910 – 26,020) after a choppy session. The index is showing signs of indecision as buyers defend lower supports near 25,778, while sellers remain active near the upper resistance zone around 26,151 – 26,208. Tomorrow’s move will largely depend on the opening tone and how prices react to the key levels outlined below.
🟩 SCENARIO 1: GAP-UP OPENING (100+ Points Above 26,020)
If Nifty opens above 26,020, it will immediately enter the Last Intraday Resistance / Profit Booking Zone (26,151 – 26,208).
Watch for quick momentum toward 26,151 — this is a critical intraday level where profit booking can emerge.
Sustaining above 26,208 may trigger fresh long entries, extending the move toward 26,331.
Failure to hold above 26,151 could bring the index back to retest the 26,020 breakout level — a healthy pullback zone for intraday traders.
A sustained break below 26,020 will indicate a failed gap-up breakout, turning bias neutral to mildly bearish.
🧠 Educational Insight:
Gap-ups often reflect overnight optimism, but smart traders wait for confirmation candles before chasing prices. The first 15–30 minutes are crucial to determine if the opening gap will sustain or fade.
⚙️ Plan of Action:
→ Let the first candle close; if Nifty holds above 26,151, long entries can be considered with targets toward 26,331 and stop-loss below 26,020.
🟨 SCENARIO 2: FLAT OPENING (Between 25,910 – 26,020)
A flat start within the No Trade Zone may lead to range-bound and confusing price action early in the session.
Bulls need a clean breakout above 26,020 to shift momentum back toward 26,151 – 26,208.
Bears will regain short-term control if prices slip below 25,910, potentially driving the index toward 25,778.
Avoid trading within this zone as whipsaws are likely due to equal buying and selling pressure.
🧠 Educational Insight:
When markets open flat within a “No Trade Zone,” patience is key. Many traders lose money trying to predict breakouts that never confirm. Let the price show strength before taking a stance.
⚙️ Plan of Action:
→ Wait for a decisive hourly close beyond 26,020 (for long) or below 25,910 (for short). Trade only post-confirmation with strict stop-loss rules.
🟥 SCENARIO 3: GAP-DOWN OPENING (100+ Points Below 25,910)
If Nifty opens below 25,910, it will shift short-term sentiment bearish, especially if opening occurs near 25,778 or below.
The first support zone lies around 25,778 — expect a possible technical bounce here.
If this support fails, the next target for sellers will be 25,648, where a temporary base could form.
Only a recovery and sustained close above 25,910 would negate the bearish pressure.
🧠 Educational Insight:
Gap-down openings often test traders’ emotions — avoid panic selling at open. Reversal candles around 25,778 can provide high R:R setups for quick intraday longs.
⚙️ Plan of Action:
→ Consider short positions below 25,778 with stop-loss above 25,910. For a safer play, wait for rejection candles near 25,910 before entering any directional trade.
💡 RISK MANAGEMENT TIPS FOR OPTIONS TRADERS
Avoid entering during the first 15–30 minutes after market opens — let volatility settle.
Always define your stop-loss — never risk more than 1–2% of total capital in a single trade.
Prefer deep ITM options for directional plays to reduce time decay.
Avoid trading when price remains in the “No Trade Zone”; capital preservation is priority.
Trail profits dynamically — once your trade achieves 1:1 R:R, secure partial gains.
📘 SUMMARY & CONCLUSION
Key Resistance Levels: 26,020 → 26,151 → 26,208 → 26,331
Key Support Levels: 25,910 → 25,778 → 25,648
No Trade Zone: 25,910 – 26,020
🔹 The bias remains neutral within the range, but momentum can quickly shift beyond 26,020 or below 25,910.
🔹 Buy on dips near 25,778 if support holds, and sell on rises near 26,208 if rejection patterns appear.
🔹 Stay flexible — the trend confirmation will only emerge after a decisive breakout beyond the defined zones.
⚠️ Disclaimer: I am not a SEBI-registered analyst. This analysis is purely for educational and informational purposes. Please do your own research or consult a certified financial advisor before taking any trading decision.
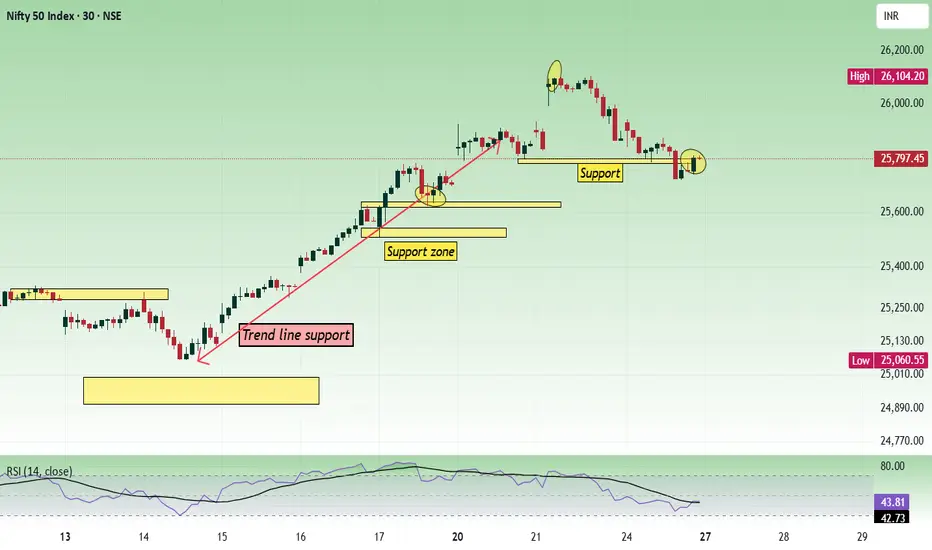
NIFTY : Trading levels and Plan for 27-Oct-2025 (educational)📘 NIFTY TRADING PLAN – 27-Oct-2025
📊 Timeframe: 15-Min | Analysis by LiveTradingBox
📈 Index Close: 25,797.45 (−0.01%)
🧭 Key Reference Levels
🟥 Last Intraday Resistance: 26,020
🟧 Opening Resistance: 25,910
🟨 Opening Support / Resistance Zone: 25,714 – 25,758
🟩 Last Intraday Support Zone: 25,553 – 25,581
🚀 Scenario 1: Gap-Up Opening (100+ Points Above Previous Close)
If Nifty opens near or above 25,900–25,950, it enters the Opening Resistance Zone. This area has repeatedly attracted sellers in the recent sessions. A gap-up may therefore test the patience of both bulls and bears as traders assess whether the move is sustainable or just another reaction to short-covering.
If Nifty sustains above 25,910 for 15–30 minutes with supportive volume, a momentum extension toward 26,020 and potentially 26,150 could unfold.
However, if the index fails to hold above 25,910, profit booking may drag prices back to the 25,758–25,714 zone.
Aggressive buyers should wait for a retest near 25,758 before entering, as this level could provide better risk/reward structure.
Only a sustained break above 26,020 with hourly candle confirmation may invite positional longs aiming toward 26,150+.
🟢 Educational Tip: After strong gap-up openings, avoid chasing the price in the first few candles. Wait for a base-building or retest setup to confirm market intent — remember, the first 15–30 minutes often define the trap zone.
⚖️ Scenario 2: Flat Opening Around 25,780 – 25,820
A flat start around the current closing levels suggests market indecision. The Opening Support Zone (25,714–25,758) will act as the first battlefield between buyers and sellers.
If Nifty holds this zone and crosses above 25,910, a bullish intraday bias could develop, targeting 26,020.
But if the index repeatedly fails near 25,910, expect sideways-to-weak bias, as intraday traders may prefer range setups between 25,750–25,910.
Breakdown below 25,714 with volume confirmation can trigger a short move toward 25,600 and then 25,553 (last support).
Patience is crucial; the best trades form when the market reveals its direction post-opening volatility.
🟠 Educational Insight: Flat openings reflect balance between overnight buyers and sellers. In such cases, structure-based trades — breakouts or breakdowns with volume confirmation — are far superior to speculative entries.
🔻 Scenario 3: Gap-Down Opening (100+ Points Below Previous Close)
If Nifty opens near 25,650–25,600, it steps into the Last Intraday Support Zone (25,553–25,581). This region is critical as it represents the prior demand zone from where intraday recoveries were observed.
Look for reversal signals like bullish engulfing, hammer, or higher low near 25,560 to anticipate short-covering rallies.
A rebound above 25,714–25,758 can confirm a recovery attempt targeting 25,910.
Conversely, a breakdown below 25,553 with heavy volume may lead to deeper selling toward 25,480–25,450 zones.
Avoid impulsive trades immediately at the open; let the first 15-minute candle settle before reacting.
🔴 Educational Note: Gap-downs often trigger emotional trades. Focus on reaction at key supports — a well-timed reversal trade from strong zones can yield high reward with limited risk.
💡 Risk Management Tips for Options Traders
🎯 Stick to defined setups: Trade only near marked zones with clear confirmation.
💰 Position sizing: Risk not more than 2% of your total capital on a single trade.
🛑 Stop Loss Discipline: Always use a strict stop loss based on an hourly close — avoid emotional widening.
⌛ Avoid early entries: The first 30 minutes are for observation, not execution.
📊 Book partial profits: Secure 30–40% gains early and trail stop loss to cost for remaining position.
📆 Avoid overnight option positions: Theta decay and event risks can distort reward potential.
🧩 Summary & Conclusion
Nifty currently trades between two crucial decision zones — 25,553–25,581 (Support) and 26,020 (Resistance).
A breakout above 26,020 may open gates for 26,150, while a breakdown below 25,553 could extend weakness toward 25,450.
The broader sentiment remains neutral-to-bullish as long as Nifty holds above 25,714. The plan should be to trade only confirmed breakouts or retests, ensuring entries align with volume and structure rather than impulse. Remember — discipline and timing are your best tools, not prediction. 🧘♂️
⚠️ Disclaimer:
I am not a SEBI-registered analyst. This analysis is shared purely for educational and informational purposes. Traders are advised to conduct their own research or consult a certified financial advisor before making any investment or trading decisions.

Nifty 1-Hour Chart – Double Top PatternA Double Top pattern has formed on the Nifty 1-hour chart, showing potential bearish reversal signals after price failed twice near the 26,100 resistance zone.
The pattern indicates that buying momentum is weakening, and sellers are likely to take control once the neckline near 25,700 is breached.
🔹 Trade Setup
Entry: Sell when Nifty touches 25,700
Stop Loss: 26,100
Target: 25,300
🔹 Technical Observations
Pattern Type: Double Top – bearish reversal confirmation
Neckline: 25,700 (key breakdown level)
Indicators Insight:
Ichimoku: Neutral turning bearish
SuperTrend: Downtrend continuation
VWMA & VWAP: Both sloping down → downside bias
RSI: Around 45 → momentum weakening below 50
If Nifty retests 25,700 and fails to sustain above it, downside momentum could extend toward 25,330–25,300 levels. A close below the neckline confirms pattern activation.

NIFTY Levels for Today
Here are the NIFTY's Levels for intraday (in the image below) today. Based on market movement, these levels can act as support, resistance or both.
Please consider these levels only if there is movement in index and 15m candle sustains at the given levels. The SL (Stop loss) for each BUY trade should be the previous RED candle below the given level. Similarly, the SL (Stop loss) for each SELL trade should be the previous GREEN candle above the given level.
Note: This idea and these levels are only for learning and educational purpose.
Your likes and boosts gives us motivation for continued learning and support.

A market Wrap Up on Fx, Rates, Geo- economic & Geo-PoliticsGlobal Wrap
Geo-economics was back on center stage.
The U.S. slapped new sanctions on Russia, broke off trade talks with Canada, upped its financial lifeline to Argentina’s President Milei, and geared up for the Trump–Xi meeting — which Trump insists will deliver a deal. (He’s clearly betting on optimism over precedent.)
U.S. — Soft Inflation, Fed in Focus
September inflation came in cooler than expected, boosting odds of a Fed rate cut on Wednesday. But both core and headline readings still hover a full point above the 2% target.
PMIs were upbeat; the University of Michigan survey… not so much. Consumers are clearly not feeling the vibes yet.
U.K. — Inflation Cools, Borrowing Heats Up
U.K. inflation eased to 3.8%, below forecasts, with wages also softening — pushing yields lower and giving the budget a breather. Still, borrowing for the first half of the fiscal year hit its highest since the pandemic. Less “Great British rebound,” more “Great British recalculation.”
China:
Slower, but on Target
China’s Q3 GDP growth slowed to 4.8%, bringing year-to-date expansion to 5.2% — enough to meet the official goal. Not thrilling, but Beijing will take it.
Markets:
Gold Stumbles, Oil Shines
Equities extended gains, yields stayed calm, and gold finally slipped after nine weeks of rallying. Oil had the opposite mood — both Brent and WTI closed above $60 a barrel as U.S. sanctions tightened on Russian exports.
The Week Ahead:
All eyes on geo-economics round two: the Trump–Xi summit, Argentina’s elections, and a flurry of central bank decisions.
The Fed is expected to trim rates by 25 basis points as job growth cools. Chair Powell’s press conference will be the week’s must-watch — especially with political heat still on the Fed.
The ECB is likely to stay on hold, while the Bank of Japan keeps its famously patient stance.
Meanwhile, the U.S. government shutdown drags into week four, delaying GDP and inflation data yet again — the statistical version of “please hold, your data is important to us.”
Oh BtW, there is the Bank of Canada rate decision too- no mystery there. They will cut another quarter.
Asia & Europe — Data Watch
China PMIs: Services likely up, manufacturing a tad softer.
Eurozone: Q3 GDP and inflation seen hovering near 2%.
U.K.: Consumption data to guide the late-November budget.
India — Still Strong, Slightly Softer
India’s forex reserves rose $4.5 billion to a record $702.3 billion, thanks to valuation gains.
The flash composite PMI slipped to 59.9 from 61.0 — the slowest in five months but still solidly expansionary. Services cooled, manufacturing ticked up, exports softened.
Markets flirted with record highs before mild profit-taking, as everyone awaits progress in U.S.–India trade talks.
Geopolitics — Quiet Resolve and Fiscal Reality
China: The Communist Party’s Fourth Plenum reaffirmed the 15th Five-Year Plan and doubled down on tech leadership. Tariffs may sting, but Beijing’s message is clear: “We’re not blinking.”
Japan: Sanae Takaichi took office as Prime Minister, promising stimulus — but markets aren’t buying it. With public debt at 236% of GDP, Tokyo may be out of fiscal runway. Appointing two ex-finance ministers suggests “prudence now, promises later.”

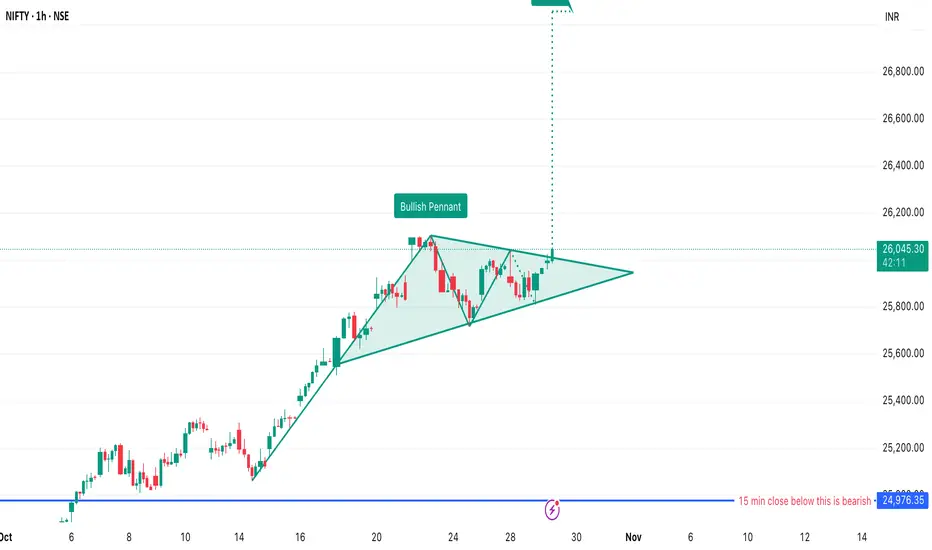
NIFTY Breakout Alert: Bullish Pennant Pattern on the 1H ChartNSE:NIFTY This chart highlights a classic bullish pennant pattern forming on the NIFTY 1-hour time frame. After a strong upward rally, NIFTY consolidated in a converging triangle, setting up for a potential breakout. The breakout above the pennant signals a strong continuation of the uptrend, with the measured move target projecting significant upside. Watch for sustained price action above 26,037.60 for bullish confirmation. The pattern remains valid unless there is a 15-minute close below the key support at 25,700 which would turn the outlook bearish. This idea provides actionable levels for traders to plan entries and manage risk.
NIFTY Levels for Today
Here are the NIFTY's Levels for intraday (in the image below) today. Based on market movement, these levels can act as support, resistance or both.
Please consider these levels only if there is movement in index and 15m candle sustains at the given levels. The SL (Stop loss) for each BUY trade should be the previous RED candle below the given level. Similarly, the SL (Stop loss) for each SELL trade should be the previous GREEN candle above the given level.
Note: This idea and these levels are only for learning and educational purpose.
Your likes and boosts gives us motivation for continued learning and support.

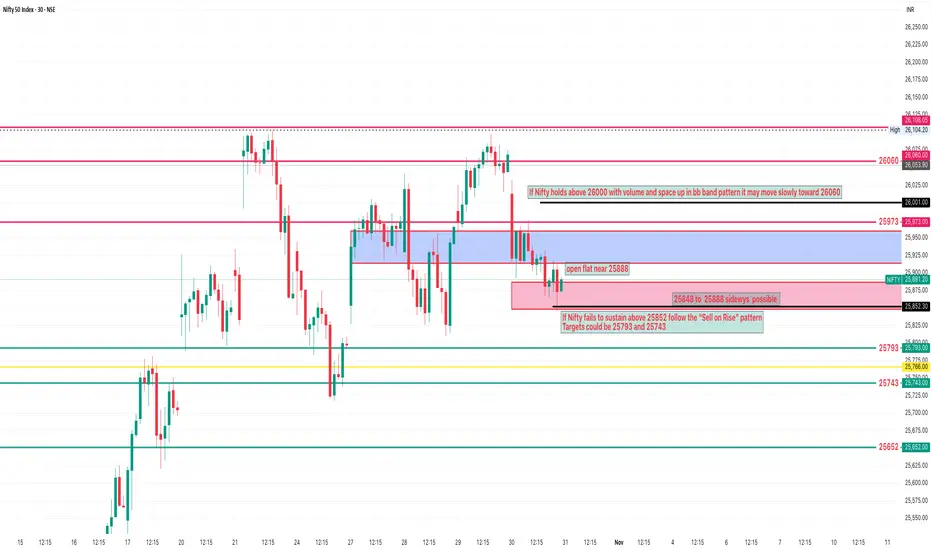
NIFTY Analysis 31 october 2025 ,Daily Morning update at 9 amif Nifty fails to sustain above 25852 u can use the “Sell on Rise” pattern
Targets could be 25793 and 25743
but if Nifty holds above 26000 with volume and forms bn pattern in bb band and space upside it may move little slowly toward 26060
Nifty 50 – Key Levels & Trade Setups | 27 Oct 2025Overview
The NIFTY 50 index concluded the previous week with an indecisive candle, reflecting ongoing market uncertainty. Notably, the price action has successfully filled the gap that was left open on October 20, 2025. As we approach the market open on October 27, 2025, I will be closely monitoring the initial price behavior to gauge directional bias.
Current Technical Scenario
The market is currently positioned within the 25,830–25,800 range coinciding with a 3-minute FVG, which could serve as a pivotal zone for short-term movements. From current levels, there is potential for a downside extension toward the 25,670.
Key Levels to Watch
Resistance : Monitor for breakout above the 25,875 level.
Support : 25,700, followed by 25,670 (major).
I will closely monitor market reactions at these levels during the trading session on October 27, 2025, and, if possible, provide real-time updates post-market open at 9:15 AM IST based on live price developments. This analysis is for educational purposes only and not financial advice—always conduct your own due diligence and manage risk appropriately.

#Nifty50 Next Week Analysis (October 27 - November 2, 2025)
The #Nifty 50 index closed the week ended October 24, 2025, at 25,795.15, marking a 0.37% decline and snapping a six-day winning streak amid profit booking in select heavyweights like banking and telecom stocks. This came after a strong rally that pushed the index near its all-time high territory around 26,000 earlier in the week. However, positive global cues, particularly the finalisation of the India-US trade deal, could provide a tailwind heading into next week.
#Support $ Resistance
Immediate Support - 25,800 to 25,300
Immediate Resistance - 26,400 to 26,200
#Influencing Factors
- Bullish Driver - Domestic flows remain strong, with FIIs net buyers (~₹12,000 crore last week) amid easing geopolitical tensions.
- Bearish Driver - US markets are choppy ahead of the November 5 election, and any escalation in Middle East tensions could pressure oil prices and risk assets.
#My Overview
Based on recent price action, the index is consolidating in a tight range after the pullback. It remains above Resistance Level now acting as a support given in the chart , indicating #Bullish -to-Neutral or #Bearish momentum without overbought conditions yet.
#Overall Outlook
#nifty50 Next week looks set for consolidation with a positive tilt, driven by trade deal optimism and resilient domestic buying. Bulls could regain control if Nifty sustains above 26,400 early in the week, targeting 28,000+. Bears may dominate on a close below 25,200, pulling toward 24,500. Stay tuned to US-India negotiations for intraday triggers.
#Trend Overview
Trend Neutral to Bearish and 'Can' go down due to bearish diversions -
~~ Disclaimer ~~
High Risk Investment
Trading or investing in assets like crypto, equity, or commodities carries high risk and may not suit all investors.
Analysis on this channel uses recent technical data and market sentiment from web sources for informational and educational purposes only, not financial advice. Trading involves high risks, and past performance does not guarantee future results. Always conduct your own research or consult a SEBI-registered advisor before investing or trading.
This channel, Render With Me, is not responsible for any financial loss arising directly or indirectly from using or relying on this information.

NIFTY Intraday Trade Setup For 30 Oct 2025NIFTY Intraday Trade Setup For 30 Oct 2025
Bullish-Above 26110
Invalid-Below 26060
T- 26350
Bearish-Below 25920
Invalid-Above 25970
T- 25690
NIFTY has closed on a bullish note with 0.45% gain today. Index has been consolidating below 26100 since few days. Above 26110 index is all set for a fresh ATH. On a 15 Min candle close above 26110, plan a long for the target of 26345. 25900 zone can be a confluence zone. Plan a short below 25920 on 15 Min candle close, 25690 will be target.
In case of a big gap up/down, wait till 10 o'clock and mark the high and low of the trading range (5MIN). Trade on this range breakout.
==========
I am Not SEBI Registered
This is my personal analysis for my personal trading. Kindly consult your financial advisor before taking any actions based on this.

24 Oct 2025 - Happy Diwali Uptrend coming to an end? PostMortem Nifty Stance Bullish 🐂
Nifty has been in a bullish stance since the 3rd of October 2025, and we have amassed total gains of 960pts so far. If you have not made money this month, there is something wrong with your strategy, because this was the easiest month in the last 3 or 4 years to make money. The reason is that we have had an unchecked, one-way journey with nil reversal or choppiness.
If you were an option seller, you might have lost money, as the implied volatility (VIX) was at its all-time low, and the quick surge in the underlying (Nifty) would have taken out your stop losses. If you had not covered your shorts, your losses would have widened. As the count of speculators has gone down, it's hard to guess it from X, as very few people are sharing P&L screenshots these days.
Coming back to our EMA crossover strategy, we are looking at 960+ points of unrealized gains. At one point, the gains exceeded 1,250+, all thanks to Trump's tweets indicating that Indian tariffs may be reduced to 15% from the current 50%. Our technical analysis is no match for his tweets, and the only way to protect ourselves is to use a fully hedged credit/debit spread instead of naked longs or shorts.
From the chart, you can see that the faster EMA (orange line) is dipping and could cross the blue line on Monday if we maintain a narrow ATR of 100 points or keep falling. We have the monthly expiry coming Tuesday, and it could be a flatter expiry, as we have already moved a lot on price in this series. If we fall on Tuesday, I would be very excited to play the Sensex expiry on Thursday as well.
The support levels for Nifty are 25681, 25219, and 25003 (hoping we don't fall that much). The resistance is faint at 25906, breaching which could take us to the ATHs soon.
---
If you liked this article, consider sharing it with someone who could benefit from this.

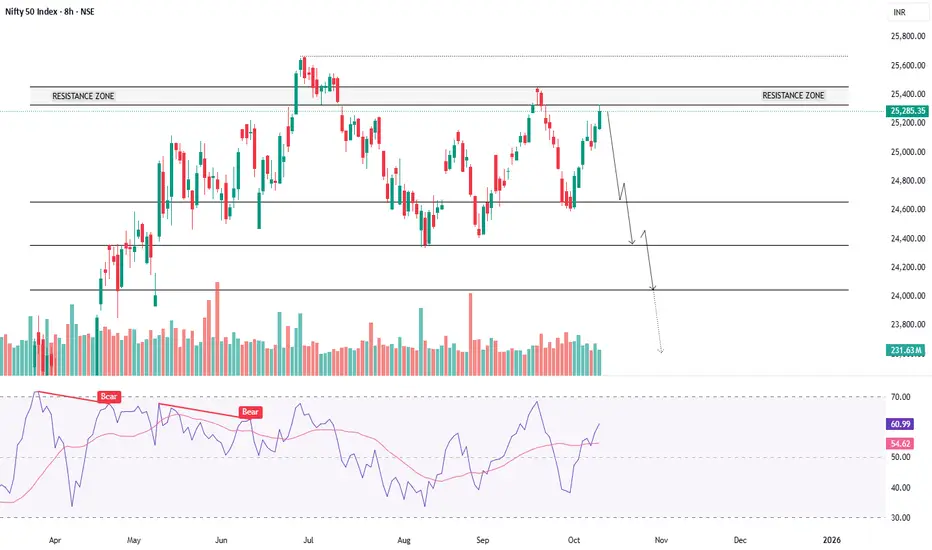
NIFTY50 - VULNERABLE TO 20% CORRECTIONSymbol - NIFTY50
NIFTY50 has been trading within a defined range for the past several months, unable to generate any meaningful trending move due to the absence of strong fundamental or macroeconomic catalysts on either side. Both bullish and bearish drivers have remained largely muted, resulting in a period of indecision and lackluster volatility.
While the index itself has shown little directional progress, distribution patterns are increasingly visible across the broader market, which continues to exhibit a consolidation to bearish bias. This suggests that institutional participation may be shifting, and underlying sentiment is weakening despite the Nifty50’s apparent stability.
There are several macroeconomic and geopolitical factors that could contribute to a potential correction in global equity markets. Although listing them all would make this analysis excessively long, some of the key concerns include:
1. Rising inflationary pressures driven by US tariffs implemented under Trump’s economic policy.
2. Weak US fiscal policy and growing concerns that the US government could default on its debt obligations.
3. Elevated recession expectations in the United States.
4. Gold and Silver simultaneously hitting historic highs, signaling a clear risk-off sentiment, even as US equity markets trade at record levels.
5. Overvaluation and speculative euphoria in AI and machine learning related stocks, indicating a potential bubble in select sectors.
At current levels, valuations appear moderately high, and the 'smart money' or true value buying zones remain significantly lower. Based on these factors, my personal bias leans toward a major correction in the coming months. I anticipate a potential downside of around 20% or more in NIFTY50.
This is a positional view, so I am not sharing immediate support or resistance levels. However, the 20-21K zone and below may represent attractive long term accumulation levels for investors once the correction plays out.
It’s worth recalling that in my previous outlook last year, when Nifty50 traded near 26000, I projected a 10–15% correction, which materialized shortly after. This time, however, the downside potential could be even deeper - though only time will tell how the broader macro picture unfolds.
Disclaimer: This analysis is shared purely for educational purposes and should not be considered trading or investment advice.
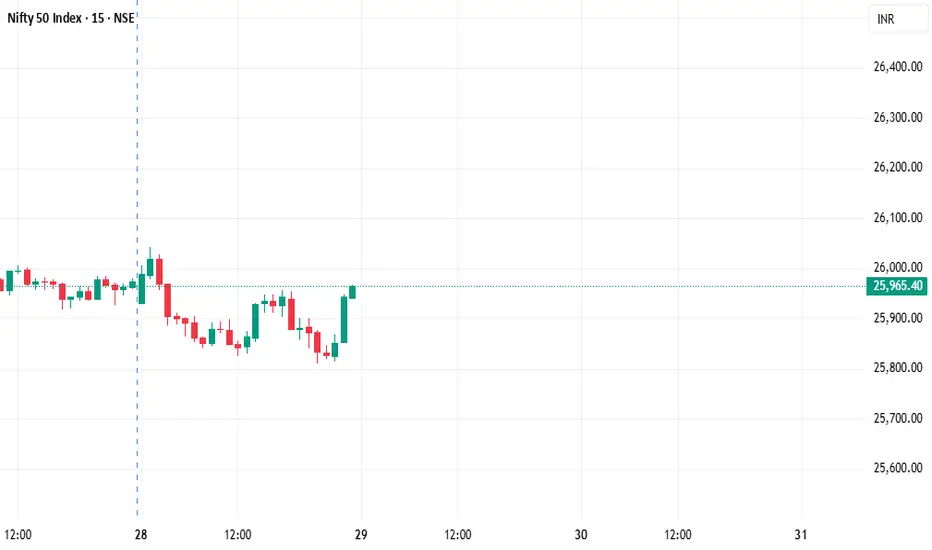
NIFTY : Trading levels and Plan for 29-Oct-2025NIFTY TRADING PLAN – 29-Oct-2025
📊 Nifty closed around 25,965, forming a tight consolidation within the No-Trade Zone (25,910 – 26,021). The index has been oscillating between intraday resistances and supports, showing signs of indecision. As we head into tomorrow’s session, traders should focus on reactions around the key breakout and breakdown levels.
🟩 SCENARIO 1: GAP-UP OPENING (100+ Points Above 26,021)
If Nifty opens above 26,021, it will immediately face the Last Intraday Resistance Zone (26,134 – 26,227).
A strong opening above 26,021 may trigger bullish momentum, driving prices toward 26,134.
Sustaining above 26,134 could attract follow-through buying, targeting 26,227 and possibly 26,300+.
However, this resistance zone is also a potential profit-booking area, where early buyers might book gains.
Failure to sustain above 26,134 could bring a pullback toward 26,021, which will act as an intraday pivot level.
🧠 Educational Insight:
Gap-ups often represent overnight optimism, but smart traders wait for a confirmation candle before entering. False breakouts near resistance zones can trap long positions quickly.
⚙️ Plan of Action:
→ If the first 15–30 minutes hold above 26,134, look for intraday long entries toward 26,227 – 26,300 with a stop-loss below 26,021.
→ If prices reject 26,134, expect a corrective dip — short-term traders can scalp short positions back toward 26,021.
🟨 SCENARIO 2: FLAT OPENING (Between 25,910 – 26,021)
A flat start inside the No-Trade Zone usually signals a day of range-bound activity in the initial session.
The market may stay choppy between 25,910 and 26,021 before choosing direction.
A breakout above 26,021 can trigger bullish momentum, while a breakdown below 25,910 will invite sellers.
Avoid trading inside this zone as both buyers and sellers may get trapped due to low directional clarity.
🧠 Educational Insight:
The “No-Trade Zone” is where risk-reward ratios are unfavorable. Experienced traders often wait for a clean breakout candle or volume confirmation before committing capital.
⚙️ Plan of Action:
→ Avoid premature entries. Wait for an hourly candle close above 26,021 or below 25,910 to initiate trades.
→ Maintain smaller position sizes until the trend direction becomes evident.
🟥 SCENARIO 3: GAP-DOWN OPENING (100+ Points Below 25,910)
If Nifty opens below 25,910, it will test the Last Intraday Support Zone (25,712 – 25,736).
Expect buyers to attempt a bounce from 25,712 – 25,736 initially.
If this zone fails, the next key support comes at 25,624, which could act as a potential reversal level.
A sustained break below 25,624 may trigger further downside pressure and shift short-term sentiment bearish.
🧠 Educational Insight:
Gap-downs often create emotional reactions, but disciplined traders wait to see if the first bounce holds. Many intraday reversals begin near strong support zones when retail traders panic sell.
⚙️ Plan of Action:
→ For aggressive traders: Short below 25,712 with targets near 25,624, keeping stop-loss above 25,910.
→ For conservative traders: Wait for a rejection candle near 25,910 to confirm a continuation or reversal pattern before entry.
💡 RISK MANAGEMENT TIPS FOR OPTIONS TRADERS
Avoid trading the first 15–30 minutes; let volatility settle before entering.
Always set a fixed stop-loss (preferably not exceeding 1–2% of your trading capital).
Prefer ITM options for directional trades to minimize time decay.
Exit half your position once you achieve 1:1 R:R to protect profits.
Avoid overtrading inside the No-Trade Zone — capital protection should be your top priority.
📘 SUMMARY & CONCLUSION
Key Resistance Levels: 26,021 → 26,134 → 26,227
Key Support Levels: 25,910 → 25,736 → 25,624
No Trade Zone: 25,910 – 26,021
🔹 Nifty remains in a neutral-to-cautious zone, with short-term volatility expected near 26,134 resistance.
🔹 A breakout above 26,134 can extend upside momentum, while a breakdown below 25,910 may invite fresh selling.
🔹 The best approach is to stay patient for directional clarity, respect levels, and trade with defined stops.
⚠️ Disclaimer: I am not a SEBI-registered analyst. This analysis is shared purely for educational and informational purposes. Please do your own research or consult a certified financial advisor before making any trading decisions.

Part 2 Ride The Big Moves Advantages of Option Trading
Option trading offers several benefits:
Leverage: Small premiums control large positions, magnifying potential returns.
Flexibility: Options can be used for income generation, speculation, or hedging.
Limited Risk for Buyers: The maximum loss for option buyers is limited to the premium paid.
Diverse Strategies: Traders can design complex setups for any market condition.
Portfolio Protection: Helps reduce downside risks without liquidating assets.
Because of these advantages, options have become integral to both institutional and retail trading strategies worldwide.

NIFTY Analysis 27 october 2025 ,Daily Morning update at 9 amNifty may open near 25866 and move sideways above12ema
Buy above 25880 , Targets 25902 and25945
Sell below 25756, Targets 25700 and 25643
