Nifty Intraday Analysis for 27th November 2025NSE:NIFTY
Index has resistance near 26400 – 26450 range and if index crosses and sustains above this level then may reach near 26600 – 26650 range.
Nifty has immediate support near 26000 – 25950 range and if this support is broken then index may tank near 25800 – 25750 range.
Overall momentum is positive, however, rangebound trade is expected due to expiry day of the Monthly F&O contract on BSE.
Trade ideas

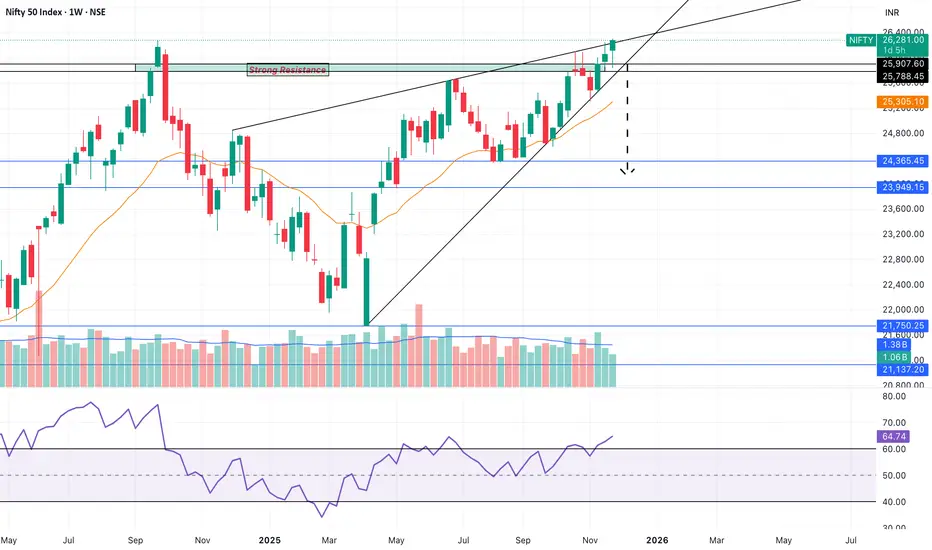
Rising Wedge pattern in NiftyRising Wedge pattern in Nifty (SL daily candle close)
Short Nifty below @25800
SL 26104
Target : 24365-23949
CMP 26306 @ Nov 27, 2025
Disclaimer: Sharing my personal market view — only for educational purpose not financial advice.
Nifty Trading Strategy for 27th november 2025📈 NIFTY Intraday Levels (15-Minute Candle Breakout Strategy)
🔼 BUY Setup
Buy only if price closes above the high of the 15-minute candle at 26333.
📌 Conditions to Enter Buy Trade:
Wait for the 15-minute candle to close above 26333 (not just touch or wick).
Enter after confirmation candle moves upward.
Ensure volume is supportive and trend is not sharply against you.
🎯 Buy Targets:
Target Level Expected Move
🥇 Target 1 : 26366 Quick scalp target
🥈 Target 2 : 26399 Moderate continuation
🥉 Target 3 : 26429 Extended trend target
🛡 Stop Loss (important): Below breakout candle low or nearest logical support.
🔽 SELL Setup
Sell only if price closes below the low of the 15-minute candle at 26100.
📌 Conditions to Enter Sell Trade:
Wait for a solid candle close below 26100.
Expect further downside only if momentum continues.
Avoid reversal candle entries.
🎯 Sell Targets:
Target Level Expected Move
🥇 Target 1 : 26070 Quick momentum target
🥈 Target 2 : 26040 Follow-through continuation
🥉 Target 3 : 26005 Deeper selling pressure zone
🛡 Stop Loss: Above breakdown candle high or nearest resistance.
⚠️ Risk Management Rules
⭐ Trade only after confirmed breakout candle close
⭐ Avoid pre-entry positions during sideways market
⭐ Risk only 1–2% of capital per trade
⭐ Always trail stop loss after each target
⭐ Protect capital first – profit comes next
📜 Disclaimer
I am not a SEBI registered analyst.
This is only for educational and informational purposes, not financial advice.
Trade at your own risk and always follow proper risk management.

Strong RECOVERY and CLOSING! What's next!?As we can see NIFTY showed strong upmove but we still need confirmation of weekly candle for bull run continuation hence following the structure, we may see a continuation of upmove but will only be confirmed if candle closing is seen in weekly time frame so plan your trades accordingly and keep watching everyone.
Market Isn’t Manipulated — It’s Just MisunderstoodI’ve seen so many FinGurus, influencers, and even new students say that the Indian market or the index is “manipulated.”
Let me break that illusion today — the index is not manipulated.
When people don’t understand something, they either blame it… or glorify it.
The market is neither God nor a gangster.
It simply reflects data, structure, and behaviour — all visible on the chart.
If you’ve been reading my commentary daily, you already know the truth:
The market is predictable when you track the right technicals and price action.
Most people just don’t pay attention to the details.
Now let’s come back to NSE:NIFTY
Exactly as expected, today’s dip got bought immediately.
And yesterday I clearly wrote that if Nifty sustains above 26000 even on hourly, the Sell-on-Rise idea becomes invalid.
That’s exactly what happened.
So from here on, the approach shifts to Buy the Dip —
but only from intraday supports + OI buildup zones.
Pivot is at 26087 and Nifty is comfortably above it.
Pivot Percentile is wide, which usually signals a sideway day where dips get bought.
Based on the structure, I think Nifty may form an Inside Bar tomorrow —
a day where both sides get trapped and liquidity is absorbed quietly.
So my plan is simple:
I’ll wait for the Pivot to tighten and prepare for the next breakout opportunity.
If the index doesn’t move according to my plan, I won’t trade — no matter how big the breakout looks.
I only trade what I can plan. Nothing else.
Let’s see what tomorrow brings and then act accordingly.
Take care. Have a profitable tomorrow.
NIFTY : Trading levels and Plan for 27-Nov-2025📊 NIFTY TRADING PLAN — 27 NOV 2025
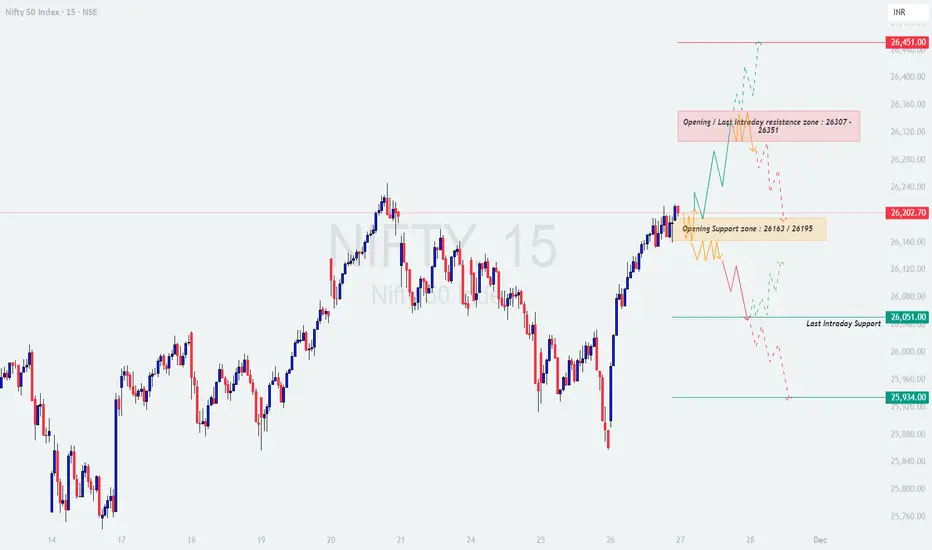
Nifty closed around 26,202, sitting right under the Opening / Intraday Resistance Zone (26,307–26,351) and above the Opening Support Zone (26,163–26,195).
Market structure is slightly bullish but still inside a supply region, meaning the opening reaction will decide trend strength.
Key Level Zones to Track:
🟥 Opening / Last Intraday Resistance Zone: 26,307 – 26,351
🟥 Major Resistance: 26,451
🟧 Opening Support Zone: 26,163 – 26,195
🟩 Last Intraday Support: 26,051
🟩 Major Downside Support: 25,934
🟢 SCENARIO 1 — GAP-UP OPENING (100+ Points)
If Nifty opens around 26,300–26,360, price immediately enters the opening/intraday resistance zone.
If price sustains above 26,351 for 10–15 minutes →
⭐ Upside targets → 26,395 → 26,420 → 26,451
If price rejects the 26,307–26,351 zone →
Expect a correction toward 26,250 → 26,195
A bullish retest above 26,307 can offer a continuation long opportunity.
Avoid chasing long directly on gap-up — opening candles at resistance often trap buyers.
📘 Educational Note:
Gap-ups near a major supply zone require confirmation. Look for higher low formation or strong bullish candle closing above resistance before entering.
🟧 SCENARIO 2 — FLAT OPENING (Near 26,170–26,210)
A flat open puts Nifty inside the Opening Support Zone (26,163–26,195) — a decision-making region.
Breakout above 26,210 →
Targets → 26,260 → 26,307 → 26,351
Breakdown below 26,163 →
Targets → 26,120 → 26,080 → 26,051
Avoid trading inside the 26,163–26,210 range until a clear breakout forms.
Best trades:
✔️ Breakout → Retest → Continuation
✔️ Support bounce from 26,163
💡 Educational Tip:
Flat openings usually define trend early. The first 15-minute candle often gives directional bias — don’t rush into the chop.
🔻 SCENARIO 3 — GAP-DOWN OPENING (100+ Points)
A gap-down below 26,120 brings price directly toward 26,051 (last intraday support).
If 26,051 holds with strong wick rejections →
Upside targets → 26,100 → 26,163 → 26,195
If price breaks 26,051 decisively →
Next downside zone → 25,980 → 25,934
A bounce from 25,934 can give a powerful reversal trade — but only after confirmation.
If price stays below 26,051, expect trend-day weakness and follow-through selling.
📘 Educational Note:
Gaps into strong support zones often create high-quality reversal opportunities, but ONLY after confirmation through candle structure + volume.
💼 RISK MANAGEMENT TIPS FOR OPTION TRADERS 💡
Avoid trading immediately at market open, especially during gaps.
Use ITM options for directional trades to reduce theta decay.
Follow strict SL based on structure — never widen stop losses.
Do NOT average losing trades.
If VIX is low → option buying works better.
If VIX is high → use spreads or hedged selling.
Book partial profits at levels to protect gains.
Focus on quality setups, not quantity.
⚠️ Golden Rule:
Your job is not to win every trade — your job is to protect capital and stay consistent.
📌 SUMMARY
Bullish above → 26,210
Targets → 26,260 → 26,307 → 26,351 → 26,451
Bearish below → 26,163
Targets → 26,120 → 26,080 → 26,051 → 25,934
Avoid Zones:
— 26,163–26,195 (Indecision zone)
— 26,307–26,351 (High resistance; risky for longs)
🧾 CONCLUSION
Nifty is at a crucial turning point between support at 26,163 and resistance at 26,307.
The directional trend for the day will come from:
✔️ Breakout & retest above 26,210
✔️ Reversal from 26,051
✔️ Momentum short below 26,163
Avoid trades inside choppy mid-zones and wait for the market to reveal direction.
⚠️ DISCLAIMER
I am not a SEBI-registered analyst.
This analysis is for educational purposes only.
Please consult a certified financial advisor before trading or investing.
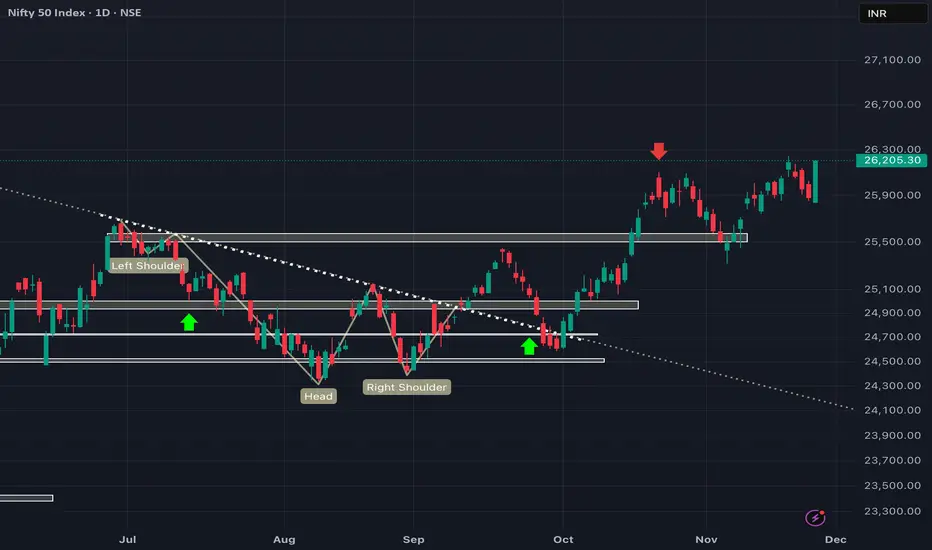
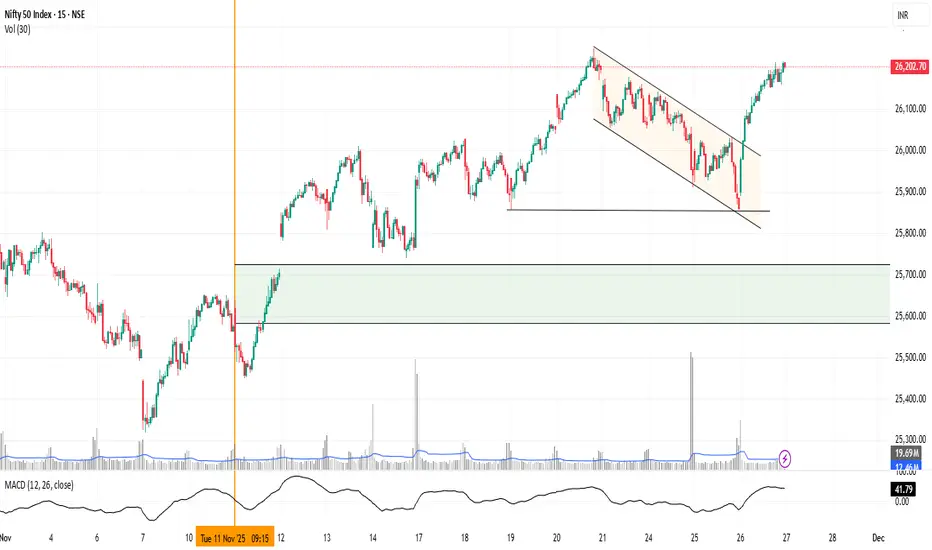
Why did Nifty give up gains today, when closed lower low yesterdFriends, we may feel that Nifty closed at a closing low and the previous day's low was also broken, then why did it happen today that the entire index reversed, is the technical wrong? If you put the Nifty chart in a smaller time frame i.e. 15 minutes and measure it with this train line, then you will understand that this reversal was absolutely perfect, hence if you are looking at any chart for technical reasons, then it is important to look at it in different time frames.
Nifty Intraday Analysis for 26th November 2025NSE:NIFTY
Index has resistance near 26075 – 26125 range and if index crosses and sustains above this level then may reach near 26275 – 26325 range.
Nifty has immediate support near 25725 – 25675 range and if this support is broken then index may tank near 25525 – 25475 range.

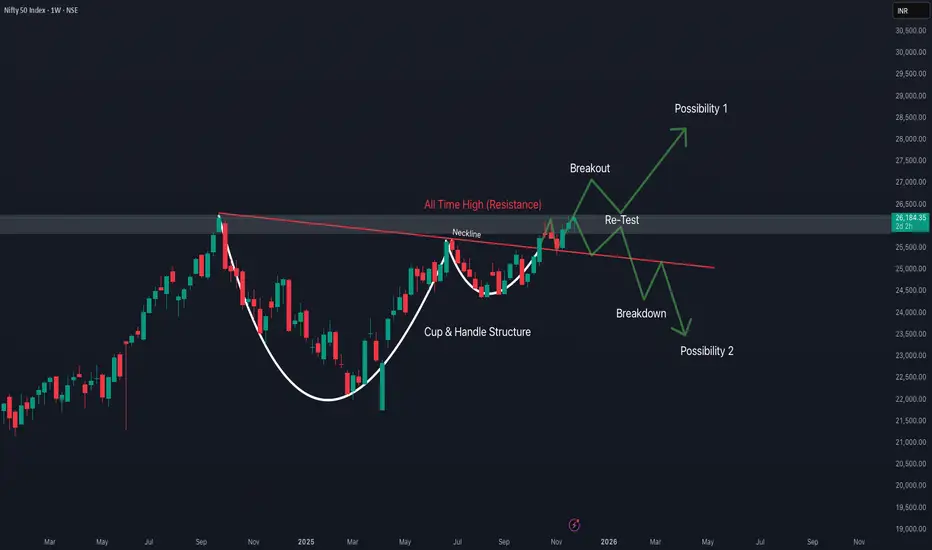
Weekly Price Action in Nifty 50The chart shows a classic Cup & Handle pattern
The cup is wide and smooth – a strong long-term accumulation pattern.
The handle is small, healthy, and formed near resistance → a sign of strength.
These patterns on the weekly chart typically lead to multi-month rallies.
The chart structure is strongly bullish unless Nifty falls below 25,500.
NIFTY SHORT nifty is at all time high supply zone and gave ltf confirmations for downside move with further scope to go down.
study the reaction at marked zone on how it plays out.

Our view is still bearish on NIFTYJust a retracement? We will be bias until confirmation of reversal.

NIFTY KEY LEVELS FOR 26.11.2025NIFTY KEY LEVELS FOR 26.11.2025
Timeframe: 3 Minutes
If the candle stays above the pivot point, it is considered a bullish bias; if it remains below, it indicates a bearish bias. Price may reverse near Resistance 1 or Support 1. If it moves further, the next potential reversal zone is near Resistance 2 or Support 2. If these levels are also broken, we can expect the trend.
When a support or resistance level is broken, it often reverses its role; a broken resistance becomes the new support, and a broken support becomes the new resistance.
If the range(R2-S2) is narrow, the market may become volatile or trend strongly. If the range is wide, the market is more likely to remain sideways
please like and share my idea if you find it helpful
📢 Disclaimer
I am not a SEBI-registered financial adviser.
The information, views, and ideas shared here are purely for educational and informational purposes only. They are not intended as investment advice or a recommendation to buy, sell, or hold any financial instruments.
Please consult with your SEBI-registered financial advisor before making any trading or investment decisions.
Trading and investing in the stock market involves risk, and you should do your own research and analysis. You are solely responsible for any decisions made based on this research.

NIFTY Levels for Today
Here are the NIFTY's Levels for intraday (in the image below) today. Based on market movement, these levels can act as support, resistance or both
Please consider these levels only if there is movement in index and 15m candle sustains at the given levels. The SL (Stop loss) for each BUY trade should be the previous RED candle below the given level. Similarly, the SL (Stop loss) for each SELL trade should be the previous GREEN candle above the given level.
Note: This idea and these levels are only for learning and educational purpose.
Your likes and boosts gives us motivation for continued learning and support.
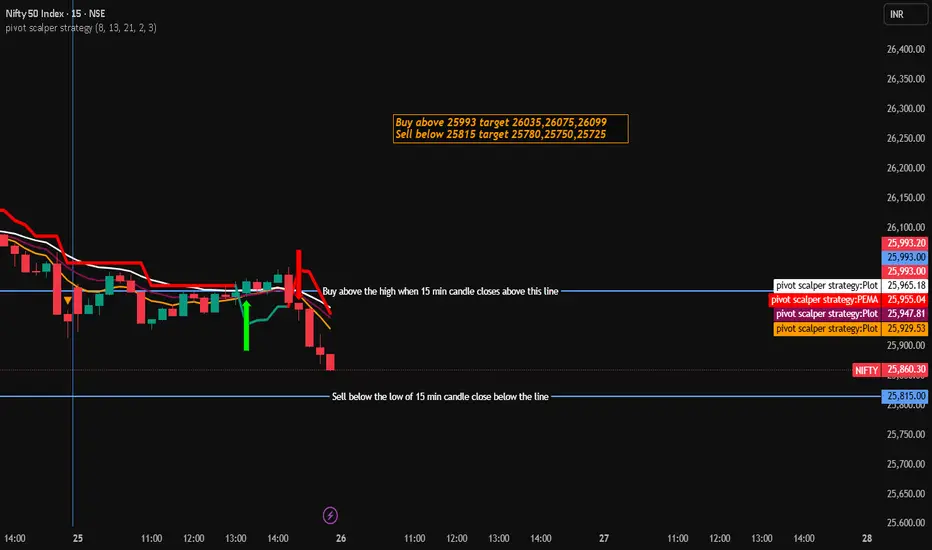
Nifty Trading Strategy for 26th November 2025📊 NIFTY Trading Plan
🟢 BUY Setup
Entry Trigger: Buy above the High of 15-min candle only if price closes above 25993.
Targets 🎯:
1st Target → 26035
2nd Target → 26075
3rd Target → 26099
Possible Confirmation Signals 🔍:
Strong bullish candle close
Increasing volume
Trend intact above VWAP/EMA
No sharp resistance immediately ahead
🔻 SELL Setup
Entry Trigger: Sell below the Low of 15-min candle only if price closes below 25815.
Targets 🎯:
1st Target → 25780
2nd Target → 25750
3rd Target → 25725
Possible Confirmation Signals 🔍:
Bearish breakdown candle
Higher sell volume
Sustained trading below intraday support
Weakness in market sentiment
🔐 Risk Management is Key
Always set SL (Stop-Loss) according to the candle structure
Book partial profits at target zones
Avoid over-trading — trade only when your levels trigger
Maintain position sizing as per your risk tolerance
⚠️ DISCLAIMER
I am not SEBI registered.
All levels are for educational & study purposes only 📘.
Trading in stock markets involves financial risk — Do your own analysis before taking any trade.
You are responsible for your own profits & losses.
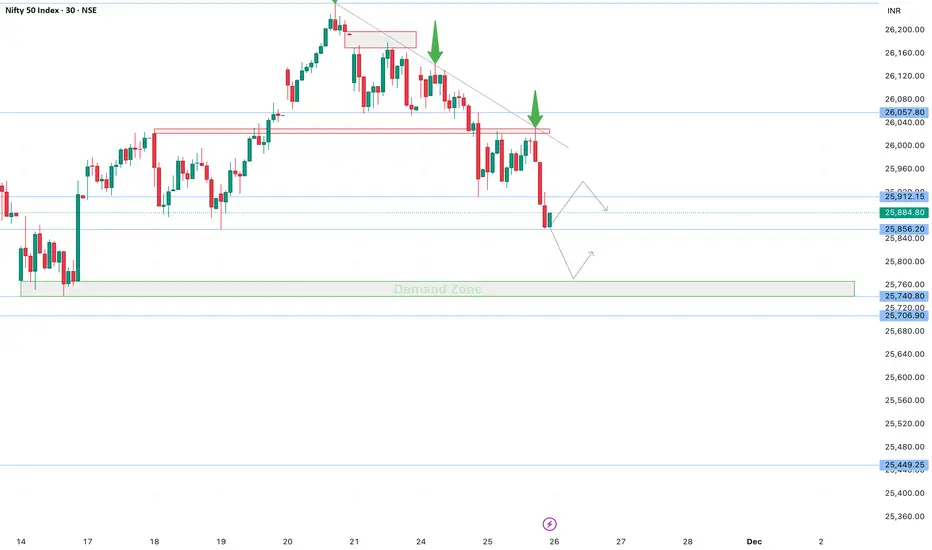
Supply–Demand + Trendline Confluence Trade SetupPrice abhi ek strong supply–demand structure follow kar raha hai. Market ne pehle demand zone se clear bounce diya tha, jahan buyers active mile. Upar jaate waqt price supply zone ke paas reject hua, confirming that sellers are still defending that level.
Abhi price trendline ke sath confluence area me trade ho raha hai, jo next move ke liye most important zone hai.
🔍 Key Analysis
Price ne Demand Zone se bounce diya → buyers active
Supply Zone par clear rejection → sellers strong
Market ek clean trendline follow kar raha hai
Ab price trendline + demand zone confluence test kar raha hai
Yaha se reversal ya breakdown — dono chances high clarity ke saath milenge
📌 Trade Plan
If price respects trendline:
Entry: Demand + trendline bounce ke baad bullish candle close
SL: Demand zone ke neeche
Targets:
T1: First minor resistance
T2: Supply zone retest
If trendline breaks:
Entry: Trendline breakdown candle close
SL: Breakdown candle high
Targets:
T1: Previous demand zone
T2: Major support
🔥 Why This Trade Works
Supply + demand + trendline = triple confluence
Clear structure + easy SL placement
Strong RR (1:2 / 1:3 possible)
⏰ 3PM Exit Rule
Agar target ya SL hit na ho →
3 PM par market price pe exit.
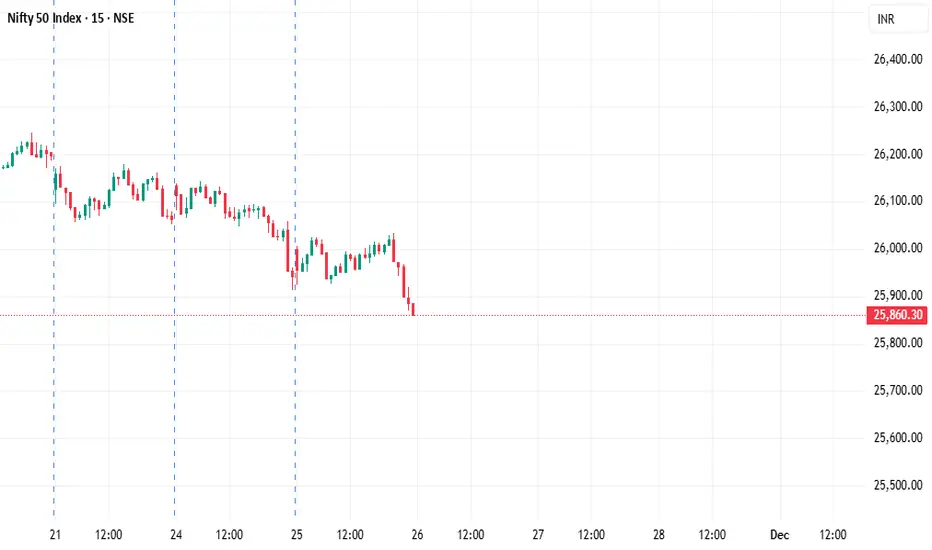
This week could be very decisive!!As we can see NIFTY couldn’t close itself and faced multiple rejections from 26000 levels which was both an important supply zone and psychological level. Hence if this weekly candle couldn’t close itself above 26000 level then we may see a sharp fall in NIFFTY so one should start getting cautious and only make new positions following the closing of this week’s candle so plan your trades accordingly.

Nifty - Buy the Dip + Sell-On-Rise Just like we planned for Tuesday, NSE:NIFTY went up to test 26025 and then dropped sharply.
We shorted exactly from that level as soon as it rolled down — clean and precise execution.
But here’s the thing: sellers still haven’t exhausted. They will soon, though.
For tomorrow, the Pivot is 25924 and the index is already trading below it — meaning the short buildup is still active.
The Macro Index also fell again, confirming weakness across the board.
So here’s my plan for tomorrow and the next 2–3 sessions:
As per technicals, Nifty may fall sharply below 25850, maybe even near 25790, and then bounce to 25900 — only to fall again.
So yes, Sell-on-Rise will continue…
But tomorrow will be a Buy-the-Dip day for me.
My approach is simple:
If Nifty touches near or below 25800, I will go long and book at 25900.
Then, if I see a rejection from 25900–25950 again, I’ll short it once more.
However, also remember - this whole plan will be invalid if Nifty closes above 26000 on daily chart or even hourly!
While most people will panic watching Nifty and BankNifty dropping, the broader market — especially Smallcaps — will quietly accumulate.
This is how smart money builds bases.
Only those who understand base formation will catch the next rally.
Everyone else will get shaken out.
So be careful.
Pick the right sector first, then pick the right stock.
📊 Levels at a Glance:
Pivot: 25924
Buy Zone: 25850–25790
Upside Booking Zone: 25900
Re-short Zone: 25900–25950
Macro View: Weak
Bias: Buy the Dip → then Sell the Rise
Broader Market: Accumulation phase in Smallcaps
That will be all for the day.
Take care. Have a profitable tomorrow.

Nifty closed below 26,000, BUT FIIs+DII are Buying📊 Key Levels for Wednesday (Snapshot):
⚠️ The Trap Zone (Neutral): 25,781 - 26,066 (Buy Support / Sell Resistance)
🔻 Bearish Breakdown: Only Below 25,781 (S1)
🚀 Bullish Reversal: Above 26,066 (R1)
⚔️ Pivot Point: 25,962
Institutional Data:
FII Net Buy: +₹917 Cr 🟢
DII Net Buy: +₹3,423 Cr 🟢
PCR: 0.73 (Bearish/Oversold) 🔴
👇 Join the Discussion: FIIs have started buying again. Do you think the Correction is OVER? Comment "TRAP" if you think Bears are about to get squeezed!

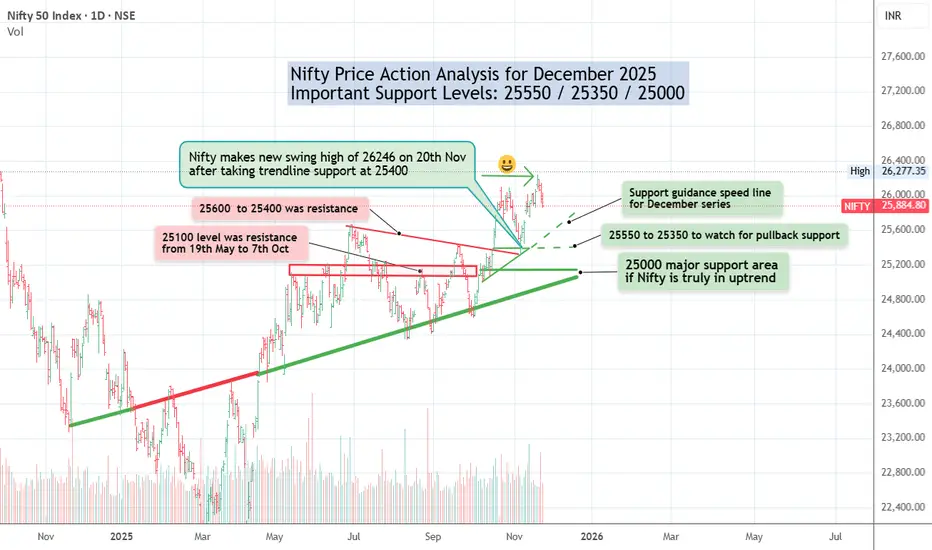
Nifty Price Action analysis for December 2025Nifty closed November Series at 25884 after achieving new swing high of 26246
For December it is likely to take support as shown on the chart. The support guidance line and pullback support (dotted) line is shown.
The trend seems up. View is to go long at every 250 points dip.
Major support for December is likely to be at 25550, 25350 and 25000.
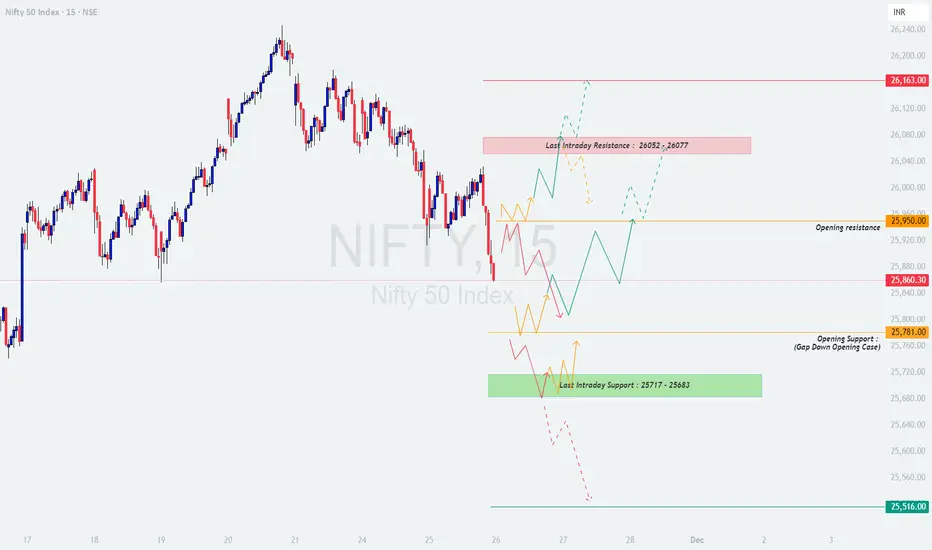
NIFTY : Trading levels and Plan for 26-Nov-2025📊 NIFTY TRADING PLAN — 26 NOV 2025
Current price sits around 25,860, right below the Opening Resistance (25,950) and just above the Opening Support (Gap-down case): 25,781.
The broader structure is weak, but Nifty is approaching a strong support zone around 25,717–25,683, which may trigger sharp intraday reversals.
Key Zones to Track:
🟥 Last Intraday Resistance: 26,052 – 26,077
🟥 Major Resistance: 26,163
🟧 Opening Resistance: 25,950
🟩 Opening Support (Gap-down case): 25,781
🟩 Last Intraday Support: 25,717 – 25,683
🟩 Major Support: 25,516
🟢 SCENARIO 1 — GAP-UP OPENING (100+ Points)
If Nifty opens around 25,960–26,050, price immediately enters the sellers’ zone near the Opening Resistance or slightly below the Last Intraday Resistance.
If price sustains above 26,052 for 10–15 minutes →
⭐ Upside targets: 26,077 → 26,120 → 26,163
If price rejects 26,052–26,077 zone →
Expect intraday pullback to 25,950 → 25,900 → 25,860
A bullish retest above 25,950 can give a continuation long opportunity.
Avoid aggressive longs at open — gap-ups into resistance often produce whipsaws.
📘 Educational Insight:
Gap-ups near resistance are continuation traps. Always wait for confirmation (higher low or strong candle close) before entering.
🟧 SCENARIO 2 — FLAT OPENING (Near 25,840–25,900)
A flat open places Nifty right inside the neutral compression zone, making direction unclear during the first 15 minutes.
Breakout above 25,950 →
Targets → 26,020 → 26,052 → 26,077
Breakdown below 25,840 →
Targets → 25,781 → 25,750
Avoid trading INSIDE 25,840–25,900 until price gives clear breakout/retest structure.
Best Opportunities:
— Breakout above 25,950 (retest entry)
— Breakdown below 25,840 (momentum entry)
💡 Educational Tip:
Flat opens help identify the day’s trend. The first clear breakout of the range usually decides the move for the next 1–2 hours.
🔻 SCENARIO 3 — GAP-DOWN OPENING (100+ Points)
A gap-down below 25,780 takes price directly into the Opening Support Zone and close to the Last Intraday Support (25,717–25,683).
If price holds 25,717–25,683 with strong wick rejections →
Upside targets: 25,781 → 25,840 → 25,900
If price fails to hold 25,683, next major support is:
➡️ 25,516
A bounce from 25,516 can provide a high-quality reversal long, but only after bullish confirmation.
If momentum remains bearish below 25,683, expect trend-day downside continuation.
📘 Educational Insight:
Gap-downs into major support often create the strongest reversal trades — but only after confirmation through volume + structure. Never jump early.
💼 RISK MANAGEMENT TIPS FOR OPTION TRADERS 💡
Avoid trading the first 5–10 minutes, especially on big gap opens.
Use ITM strikes for directional trades to reduce theta decay.
Always keep a fixed stop loss — do NOT widen SL after entry.
Avoid averaging losers (it damages your risk-reward and psychology).
Low VIX → good for option buying.
High VIX → prefer spreads or hedged selling.
Book partial profits at key swing levels; protect your capital.
⚠️ Golden Rule:
Your goal is not to catch every move — your goal is to stay in the game.
📌 SUMMARY
Bullish above → 25,950
Targets → 26,020 → 26,052 → 26,077 → 26,163
Bearish below → 25,840
Targets → 25,781 → 25,717 → 25,683 → 25,516
High-Risk Zones (Avoid Trading):
— 25,840–25,900 (choppy zone)
— 26,052–26,077 (strong supply; rejection possible)
🧾 CONCLUSION
Nifty is approaching a crucial support-resistance flip region. The reaction at 25,950 and 25,717 will decide the day’s trend.
The cleanest trades will come from:
✔️ Breakout & retest above 25,950
✔️ Reversal from 25,717–25,683 support
✔️ Momentum short below 25,840
Avoid trading the first volatile swings — let the direction develop clearly.
⚠️ DISCLAIMER
I am not a SEBI-registered analyst.
This analysis is strictly for educational purposes.
Please consult a certified financial advisor before taking any trading or investment decisions.
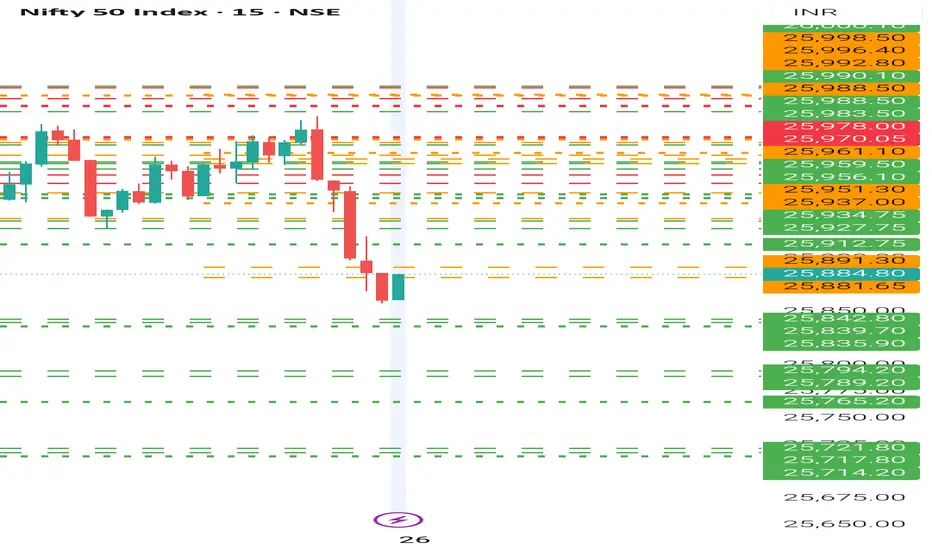
NIFTY- Intraday Levels - 26th November 2025If NIFTY sustain above 25891 above this bullish then around 25912/37 above this 25951/61 or 70/78 above this more bullish day closing above this will indicate bullish sentiment above this wait more levels marked on chart
If NIFTY sustain below 25881 below this bearish then 25842/35 support below this more bearish then 25794/65 strong level then very very strong level and last hope 25721/14 below this wait
My view :-
"My viewpoint, offered purely for analytical consideration, The trading thesis is: Nifty ( bullish tactical approach: buy on dip) The market is anticipated to form a floor (bottom) within the next day or two, initiating a rally back toward its all-time high , with a strong possibility of breaking that record soon.
This analysis is highly speculative and is not guaranteed to be accurate; therefore, the implementation of stringent risk controls is non-negotiable for mitigating trade risk."
Consider some buffer points in above levels.
Please do your due diligence before trading or investment.
**Disclaimer -
I am not a SEBI registered analyst or advisor. I does not represent or endorse the accuracy or reliability of any information, conversation, or content. Stock trading is inherently risky and the users agree to assume complete and full responsibility for the outcomes of all trading decisions that they make, including but not limited to loss of capital. None of these communications should be construed as an offer to buy or sell securities, nor advice to do so. The users understands and acknowledges that there is a very high risk involved in trading securities. By using this information, the user agrees that use of this information is entirely at their own risk.
Thank you.
Nifty 50 Price Structure Analysis [26/11/2025: Wednesday]Nifty 50 Price Structure Analysis for 26th November 2025. The day is Wednesday.
(1) Monthly Timeframe:
Green Spinning Top. Indecisive candle. Major support is at 25700. Major resistance at 26000.
(2) Weekly Timeframe:
Red Marubozu. The red candle engulfed the previous week's body. Heavy resistance at 26100 and 26000. Minor support at 25850. The view is bearish until the price starts to trade above 26000.
(3) Daily Timeframe:
Back-2-back 3 red candles (or 3 bearish days). Today's candle also seems kind of red morubozu with very small upper and lower wicks. Very strong resistance at 26000. Minor support at 25850. Major support at 25750. The view is bearish.
(4) 30-Minute Timeframe:
Two chart patterns are visible. Firstly, a Head-&-Shoulder (H&S) pattern is formed. The neck of the H&S pattern is broken. There is a high probability of a more bearish move. Secondly, the price is showing consistently lower highs and lower lows structure. Thus, there is a high probability of more downward movement. Major resistance is at the level of 25950 - 26000. Minor support is at 25850. There is a high probability of the price going down to the zone of 25750 - 25700. There is a pending gap filling in the zone of 25750 - 25700. Any upmove should be doubted. The view is bearish.
Bullish Scenario Set-Up: (Low Probability)
(i) Price sustains above the opening price.
(ii) Price starts to make higher highs and higher lows structure above the zone 25950 - 26000.
Bearish Scenario Set-Up: (High Probability)
(i) Price sustains below the opening price.
(ii) Price easily breaks and sustains below the level 25850. In this case, the bearish target would be in the zone of 25750 - 25700. The gap in this zone will work as a magnet.
Expectation:
There is a high probability that the price will show a bearish move and sustain below 25850. This will let the price reach the zone 25750 - 25700. Lastly, the zone 26000 - 25950 will remain as a strong resistance.
Events:
No major events. No expiries.
Note:
"Mark your points. Trade your points. Price is God. Anything can happen. Trade what you see, not what you believe."
Happy Trading! ;)

NIFTY heading downwards - EOD Analysis 25/11/2025Predictions for tomorrow 26/11/2025.
Our Sell Call yesterday on BPCL hit our first target; should hit our next target along with NIFTY tomorrow.
Stay Tuned!
