NIFTY 50 Nifty could test below white line or 24920 most probably within 27th Nov
if it moves sideways to bearish then it could reach within 8th Dec
Disclaimer:
It's a personal view not a financial advice and I assume no responsibility and liability whatever outcome arises.
Trade ideas

Nifty holding sell from 26100 yesterday,25920,25860 target Parameters Data
Asset Name Nifty 50
Reason 🟥 Nifty 50 ka 26,000 ke psychological level se niche trade karna aur FIIs ki taraf se heavy selling pressure.
R:R 🟨 1:1.2 (Risk to S2 high hai. Intraday sideways to bearish ho sakta hai.) / Threshold: Breakout above - & Breakdown below
Current Trade 🟨 AVOID Active | T1: 25850.00, T2: 25700.00, T3: 25500.00 | SL: 26070.00
Probability 🟨 50%
Confidence 🟨 15/30 (Mixed global clues aur conflicting domestic FII/DII flow ke chalte Neutral.)
Price Movement Sell side: 25850.00, 25700.00, 25500.00. If break 26020.00 then upmove possible towards 26070.00, 26150.00, 26250.00.
FNO Data (OI/PCR) 🟨 PCR 0.99 (Neutral). 26,000 par dono taraf se high OI, jo range-bound movement suggest karta hai.
Liquidity Zones 🟨 High Liquidity zone 25,900 - 26,100 ke beech hai.
Max Pain 🟨 26,050 (Expiry ke liye major pain point current spot ke kareeb hai.)
Gamma Exposure 🟥 Gamma negative territory mein shift ho raha hai, jo downside volatility badha sakta hai.
Supports 🟨 S1: 25,900 (Immediate F&O) | S2: 25,850 (20 DEMA) | S3: 25,500
Resistances 🟥 R1: 26,070 (Previous Close) | R2: 26,150 (Day High) | R3: 26,250 (All-time high resistance)
DEMA Levels 🟩 20 DEMA: 25,852 | 50 DEMA: 25,471 | 100 DEMA: 25,196 (Price short-term DEMA ke upar hai, structure positive hai.)
ADX/RSI/DMI 🟨 RSI (14) 45 (Neutral). Momentum kam ho raha hai.
Market Depth 🟨 Buying aur Selling pressure balanced hai.
Volatility (IV/RV) 🟨 IV high hai, volatility spike ho sakti hai.
Options Skew 🟥 Skew negative hai, Put premiums zyada hain, jo downside risk ki hedging dikhata hai.
OFI 🟥 Institutional flow negative ho raha hai.
COT Positioning 🟨 Mixed (Retail long but FII selling).
Source Ledger 🟩 NSE, Bloomberg, FactSet, Zerodha, TradingView.

NIFTY KEY LEVELS FOR 25.11.2025NIFTY KEY LEVELS FOR 25.11.2025
Timeframe: 3 Minutes
If the candle stays above the pivot point, it is considered a bullish bias; if it remains below, it indicates a bearish bias. Price may reverse near Resistance 1 or Support 1. If it moves further, the next potential reversal zone is near Resistance 2 or Support 2. If these levels are also broken, we can expect the trend.
When a support or resistance level is broken, it often reverses its role; a broken resistance becomes the new support, and a broken support becomes the new resistance.
If the range(R2-S2) is narrow, the market may become volatile or trend strongly. If the range is wide, the market is more likely to remain sideways
please like and share my idea if you find it helpful
📢 Disclaimer
I am not a SEBI-registered financial adviser.
The information, views, and ideas shared here are purely for educational and informational purposes only. They are not intended as investment advice or a recommendation to buy, sell, or hold any financial instruments.
Please consult with your SEBI-registered financial advisor before making any trading or investment decisions.
Trading and investing in the stock market involves risk, and you should do your own research and analysis. You are solely responsible for any decisions made based on this research.

Nifty Prediction for 25 Nov | FII vs DII Data & Expiry 📊 Key Levels for Tuesday (Snapshot):
🔻 Bearish Crash: Below 25,867 (S1) | Target: 25,774
🚀 Bullish Reversal: Above 26,098 (R1) | Target: 26,236
⚠️ The "Chop Zone": 25,867 - 26,098 (Avoid Trading)
Institutional Data:
FII Net Sell: -₹4,071 Cr
DII Net Buy: +₹4,373 Cr
PCR: 0.65 (Oversold/Bearish)
👇 Join the Debate: FIIs sold ₹4k Cr, DIIs bought ₹4k Cr. Who wins tomorrow? Comment "BEARS" or "BULLS" below!
Nifty Trading Strategy for 25th November 2025📈 NIFTY Trading Plan (15-Minute Strategy)
✅ BUY Setup
Trigger: Go LONG 🟢 above the High of the 15-minute candle
Confirmation: Price must close above 26,024 ⬆️
Entry: Enter only after the candle closes and a new candle begins continuing upward momentum.
Target: 🎯 +50 points from your entry
Stop Loss (recommended): Place SL below the breakout candle low or 20–25 points (whichever is comfortable).
Market Logic:
A close above 26,024 shows bullish strength.
Breakout confirmation reduces false breakout chances.
Good for intraday momentum-based traders.
🔻 SELL Setup
Trigger: Go SHORT 🔴 below the Low of the 15-minute candle
Confirmation: Price must close below 25,864 ⬇️
Entry: Enter after the candle closes and new candle continues downward.
Target: 🎯 +50 points on the downside
Stop Loss (recommended): Place SL above breakout candle high or 20–25 points.
Market Logic:
A close below 25,864 indicates strong selling pressure.
Closing confirmation avoids traps during volatility.
Suitable for intraday traders seeking trend continuation.
📝 Trade Management Tips
🕒 Avoid trading during major news events (RBI, Fed, Budget, election results).
📊 Follow proper risk–reward (minimum 1:1).
⚠️ Do not chase entries; wait for candle close confirmation.
💡 Keep position sizing small during volatile sessions.
⚠️ Disclaimer
🔒 I am not a SEBI-registered analyst.
This information is for educational and paper-trading purposes only.
Please consult your financial advisor before making trading decisions.
Trading in stock markets involves high risk.

#NIFTY Intraday Support and Resistance Levels - 25/11/2025Nifty is expected to open flat today, indicating a neutral start with no clear directional bias in the early session. If the index sustains above the 26050–26100 zone, it will activate the long setup with upside targets of 26150, 26200, and 26250+. A decisive move above this range may help Nifty recover back toward the higher resistance levels.
On the downside, weakness will confirm only if Nifty breaks below 25950, which will trigger the short setup with targets at 25850, 25800, and 25750-. Since the market is opening flat, initial movement may stay within the consolidation zone, and a breakout from these key levels will determine the trend for the day.

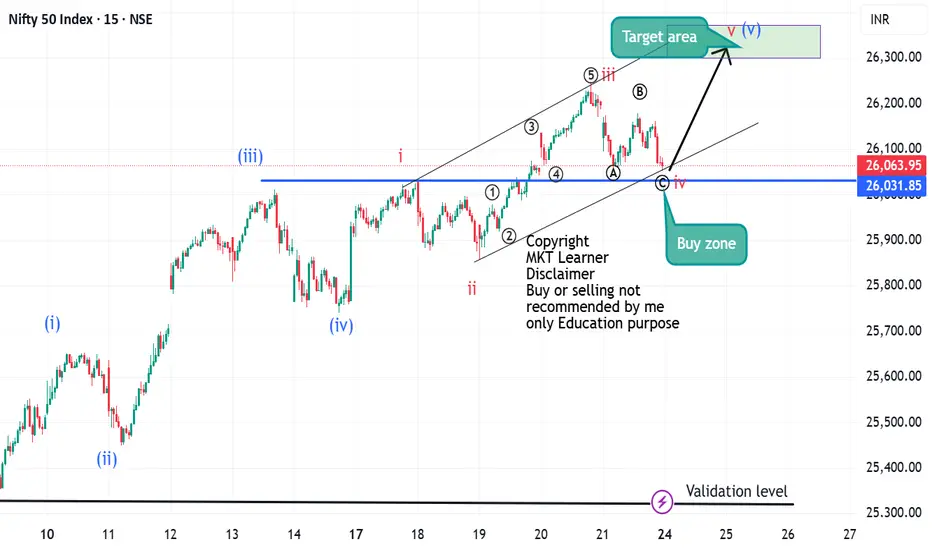
Nifty 15 Min chart wave AnalysisNifty 15 min time frame wave analysis
Nifty trade in impulse wave minuette degree (i) (ii) (iii) (iv) completed and wave (v) in progress
we study wave (v)
Wave (v)- internal structure i ii, iii have completed and wave iv in progress it may be ended near 26k here is buy setup generate for minuette degree wave (v) it may be anticipate around 26350 area.
Thanks
MKT learner
Disclaimer
it is educational purpose only .
NIFTY Levels for TodayHere are the NIFTY's Levels for intraday (in the image below) today. Based on market movement, these levels can act as support, resistance or both
Please consider these levels only if there is movement in index and 15m candle sustains at the given levels. The SL (Stop loss) for each BUY trade should be the previous RED candle below the given level. Similarly, the SL (Stop loss) for each SELL trade should be the previous GREEN candle above the given level.
Note: This idea and these levels are only for learning and educational purpose.
Your likes and boosts gives us motivation for continued learning and support.
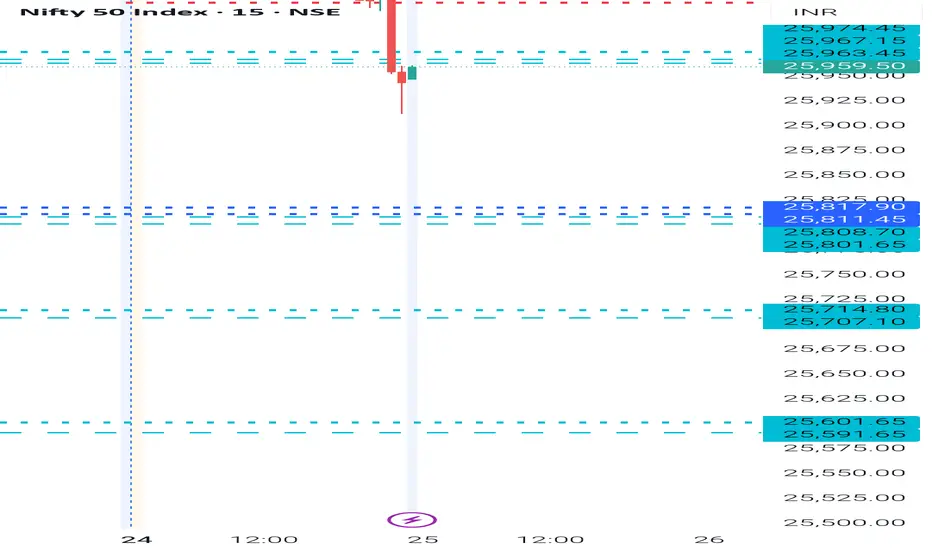
NIFTY- Intraday Levels - 25th November 2025*Note:- I'm not confident on today's levels so be careful*
If NIFTY sustain above 25974 above this bullish then around 26024/ 42 or 26052/63 above this more bullish then 26072/85 or 26100/118 strong level then above this wait more levels marked on chart
If NIFTY sustain below 25959 below this bearish then 25817/01 below this more bearish then 25601/25991 strong level below this wait
My view :-
"My viewpoint, offered purely for analytical consideration, The trading thesis is: Nifty (bearish tactical approach: sell on rise)
This analysis is highly speculative and is not guaranteed to be accurate; therefore, the implementation of stringent risk controls is non-negotiable for mitigating trade risk."
Consider some buffer points in above levels.
Please do your due diligence before trading or investment.
**Disclaimer -
I am not a SEBI registered analyst or advisor. I does not represent or endorse the accuracy or reliability of any information, conversation, or content. Stock trading is inherently risky and the users agree to assume complete and full responsibility for the outcomes of all trading decisions that they make, including but not limited to loss of capital. None of these communications should be construed as an offer to buy or sell securities, nor advice to do so. The users understands and acknowledges that there is a very high risk involved in trading securities. By using this information, the user agrees that use of this information is entirely at their own risk.
Thank you.
Price Reversal Setup from Key Demand & Supply Zones”⚡ **Analysis:**
The price has entered a strong **Demand Zone**, marked by previous accumulation and sharp bullish reaction. Buyers have consistently defended this area, indicating strong institutional interest. Current candles show slowing bearish momentum + wick rejections.
📌 **Trade Plan:**
• **Entry:** Inside or slightly above the Demand Zone
• **Stop Loss:** Below the zone (candle close basis)
• **Target 1:** Nearest supply zone
• **Target 2:** Previous swing high
• **Invalidation:** Clean breakdown and close below the zone
🎯 **Reasoning:**
Demand zones usually represent wholesale prices for institutions. If the zone holds, a bounce toward the next supply area is likely.

SHARP recovery coming up above 26000!?As we can NIFTY closed below 26000 which was against our expectations and was only valid if we were above 26000 levels. Now as long as we are below 26000, we are bearish until we sustain above 26000 for another strong upmove so plan your trades accordingly and keep watching everyone.

Warren Buffett Core Rules for Building Wealth!Hello Traders!
Warren Buffett is known as the “Oracle of Omaha” not because he picks magical stocks, but because he follows timeless principles that build wealth slowly and safely.
His rules are simple, but powerful, and every trader or investor can learn from them.
1. Rule No. 1: Never Lose Money
Buffett’s first rule is all about capital protection.
Before entering any investment, ask one question: “What is my real downside here?”
Building wealth starts with protecting what you already have.
2. Rule No. 2: Never Forget Rule No. 1
Most people break this rule because emotions take over.
They underestimate risk and overestimate their confidence.
A smart investor never lets their guard down.
3. Invest Only in What You Understand
Buffett only invests in businesses he clearly understands.
If you don’t understand how a company makes money, you shouldn’t invest in it.
Confusion always adds risk.
4. Be Fearful When Others Are Greedy, and Greedy When Others Are Fearful
When the crowd is celebrating, assets are usually overpriced.
When the market is in panic, opportunities quietly appear.
A contrarian mindset creates long-term winners.
5. Focus on Long-Term, Not Short-Term Noise
Short-term ups and downs are temporary.
Long-term business growth is what builds real wealth.
Buffett thinks in decades, not months.
6. Buy Great Businesses at a Fair Price
Don’t chase cheap stocks, chase quality.
A great business may look expensive today, but it can reward you for years.
Price is what you pay; value is what you get.
7. Do Not Rely on Market Predictions
Buffett ignores forecasts, experts, and predictions.
He studies the business, not opinions.
You don’t need to predict the market, you need to understand what you own.
8. Build an “Inner Scorecard”
Your decisions should follow your own principles, not public opinion.
Integrity and independence are at the core of Buffett’s philosophy.
Winning long-term requires your own standards.
9. Keep Emotions Out of Money Decisions
Emotional investing leads to guaranteed mistakes.
Patience, discipline, and consistency create long-term winners.
A calm mind makes better decisions.
10. Your Best Investment Is in Yourself
The strongest returns come from your skills, knowledge, and mindset.
Books, learning, and personal development give lifelong compounding.
A smarter you creates better financial choices.
Rahul’s Tip:
Wealth-building is not complicated, staying disciplined is.
Once you start thinking long-term, the market automatically starts rewarding you.
Conclusion:
Buffett’s rules are not just investing rules, they are life rules.
Protect your capital, stay patient, stay disciplined, and invest in becoming better every day.
Wealth grows slowly… until the day it grows suddenly.
If this post helped you understand Buffett’s principles better, like it, share your thoughts in comments, and follow for more timeless wisdom!

Nifty — Sell-on-Rise Still the My Strategy Market moved exactly the way I planned.
Good for my setups.
Don’t buy the dip right now. A better opportunity will come on Thursday.
NSE:NIFTY Pivot has now slipped to 26004 and the index is still closing below it — which clearly tells us the bulls are still weak.
The Macro Index also fell sharply today, confirming more weakness ahead.
Based on these data points, the plan for tomorrow stays simple: Sell-on-Rise.
Here’s how I’ll execute it:
If Nifty rises to 26025 and I spot a Pivot Low from there, I’ll short immediately.
My downside target will be 25850.
Plan B:
If we gap down and then rise, I’ll wait for another Pivot formation and short from new intraday levels.
If we gap down and fall again, I won’t touch the market. I’ll wait for Nifty to coil around a support and only then go long — with the same target as the resistance mentioned.
This entire plan becomes invalid if Nifty closes above 26132 in any way.
Stocks won’t perform anyway in this environment, so no point discussing them.
I’m only trading Nifty these days — and completely satisfied with the earnings.
📊 Levels at a Glance:
Pivot: 26004
Resistance for Shorting: 26025
Downside Target: 25850
Invalidation Level: 26132
Bias: Sell-on-Rise
Market View: Weak Macro + Weak Bulls
That will be all for the day.
Take care. Have a profitable tomorrow.

NIFTY Price Action with Market Breadth DivergenceThis TradingView chart displays the NIFTY index’s price movement from April to November 2025, with technical overlays such as moving averages and trendlines marking key support-resistance levels. The lower pane tracks market breadth, which measures the participation of stocks advancing versus declining, rather than momentum as with RSI.
Prominent highlighted points on the market breadth indicator—such as values of 17.6 in August and 22.9 in September—show a bearish divergence: while NIFTY reached new highs, market breadth trended downwards. This implies fewer stocks are participating in the rally, potentially signaling hidden weakness in the recent uptrend and an increased risk of market reversal. Traders often use such breadth divergences to spot early signals of trend exhaustion or impending corrections in broad indices.

Bear - Bulls Fight Nifty ExpirySir/Mam,
Last published Idea worked perfectly to all my viewers/followers.
For tomorrow, if Nifty opens below 25900 < then the levels opens for 25700. For safe Trading buy 26150 PE and CE now it is 200.65 + 15.45 = 216.1
That's it !
Tomorrow expiry, Volume timing as follows -
9.15 - 10.00 am - Price flow
10.00 - 1.45 PM - No Trade zone, watch the market support and resistance.
1.45 - 2.00 PM - Choose best strike price (both CE and PE should be -80 to 85% negative)
2.00 PM - 3.00 PM - Buy CE and PE of same strike price and sell with one side profit.
3.00 PM - 3.30 PM - Just watch the Profit !
Hope you have nice trading day tomorrow.
Stay safe and Take care.

NIFTY : Trading levels and Plan for 25-Nov-2025📊 NIFTY TRADING PLAN — 25 NOV 2025
(Reference: 15-min structure & intraday reaction zones)
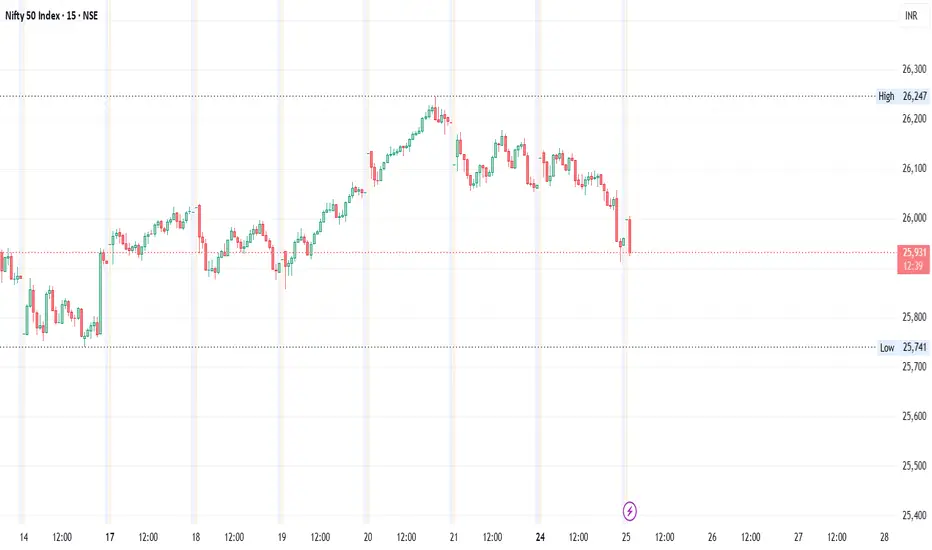
Nifty closed near 25,943, slipping into the Opening Support Zone (25,931–25,950) after a sharp late-day decline. The structure has shifted into a short-term bearish bias, but the first 15–20 minutes of the session will decide whether a reversal or continuation unfolds.
🔑 Key Levels to Track
🟥 Opening Resistance (Gap-up Case): 26,050 – 26,079
🟥 Last Intraday Resistance: 26,175
🟥 Major Upside Level: 26,307
🟧 Opening Support: 25,931 – 25,950
🟩 Last Intraday Support: 25,750 – 25,807
🟩 Major Downside Support: 25,516
🟢 SCENARIO 1 — GAP-UP OPENING (100+ Points)
If Nifty opens around 26,050+, price immediately enters the Opening Resistance Zone (26,050 – 26,079), a zone known for trapping early buyers.
If price sustains above 26,079 for 15–20 minutes →
📈 Targets: 26,120 → 26,175 → 26,225 → 26,307
If price rejects 26,079, expect pullback toward:
➡️ 26,020 → 25,970 → 25,950
The safest long trade is a retest–reclaim of 26,050 after rejection wicks.
Avoid aggressive buying directly at the open — resistance gaps often fade.
📘 Educational Note:
Gap-ups into resistance require confirmation via higher lows. A flat or weak breakout candle usually signals exhaustion, not strength.
🟧 SCENARIO 2 — FLAT OPENING (Around 25,930–25,960)
A flat open keeps Nifty inside the Opening Support Zone (25,931–25,950) — a decision-making region.
Breakout above 25,970 →
Targets: 26,020 → 26,050 → 26,079
Failure to hold 25,931 →
Decline toward 25,807 → 25,750
Avoid trading inside the 25,930–25,970 region until direction is clear.
Best trades:
✔️ Breakout–retest above 25,970
✔️ Support bounce at 25,807–25,750
💡 Educational Tip:
Flat openings reveal trend direction quickly — wait for the first candle to close before acting.
🔻 SCENARIO 3 — GAP-DOWN OPENING (100+ Points)
A gap-down below 25,880 pushes price rapidly toward the Last Intraday Support Zone (25,750 – 25,807).
If 25,807–25,750 holds with bullish wicks →
📈 Reversal targets: 25,900 → 25,950 → 26,020
If 25,750 breaks →
Next downside targets: 25,640 → 25,580 → 25,516
A sharp bounce from 25,516 provides a low-risk reversal trade setup.
Avoid picking bottoms blindly — wait for structure (HH/HL) to form.
📘 Educational Note:
Gap-downs into strong support often offer the best risk-to-reward if reversal signs appear — but only after confirmation.
💼 RISK MANAGEMENT TIPS FOR OPTIONS TRADERS 💡
Avoid trading during first 5–10 minutes after open.
Prefer ATM or ITM options for directional momentum.
Never widen your stop-loss under emotional pressure.
Avoid averaging losers — compound losses destroy accounts.
When VIX is low → option buying works better.
When VIX is high → use spreads or hedged selling.
Book partial profits to secure gains during volatility.
⚠️ Golden Rule:
Focus on capital preservation first — opportunities come daily, capital does not.
📌 SUMMARY
🔼 Bullish Above → 26,020 / 26,079
Targets: 26,120 → 26,175 → 26,225 → 26,307
🔽 Bearish Below → 25,931 / 25,807
Targets: 25,750 → 25,640 → 25,580 → 25,516
🚫 No-Trade Zone
25,930 – 25,970 (Flat opening zone — high noise, low clarity)
🧾 CONCLUSION
Nifty is approaching a high-volatility reversal area with both upside and downside swings possible. The reaction to the 25,931 support and 26,050 resistance will decide the trend for the day.
The most reliable trades will come from:
✔️ Breakout–retest above 26,020/26,079
✔️ Reversal confirmation at 25,807–25,750
✔️ Continuation trades after breakdown below 25,750
Patience and discipline are essential — avoid chasing.
⚠️ DISCLAIMER
I am not a SEBI-registered analyst.
This analysis is for educational purposes only.
Please consult a certified financial advisor before trading or investing.

Nifty 50 Structure Analysis [25/11/2025: Tuesday]Nifty 50 Price Structure Analysis for 25th November 2025. The day is Tuesday.
(i) Monthly Timeframe:
Green spinning top. The view is bullish to indecisive. Level 25700 is still a strong support. Level 26100 is a strong resistance.
(ii) Weekly Timeframe:
It is the last week of the month. Price got rejected from 26100. Price also breaks down level 26000. First day of the week. It is a red candle and an inside week. No bullish trade till price decisively sustains above 26050. Level 25900 is a major support. If level 25900 is broken down, then bearishness will increase. The view is indecisive to bearish. Strong resistance level formed at 26100 - 26050.
(iii) Daily Timeframe:
First day of the week. It's kind of red morubozu due to its large body. But there are wicks at the top and bottom. Strong support at 25900. Strong resistance at the level 26100 - 26050. No bullish trade till price decisively sustains above level 26100. Bearishness might increase if level 25900 is breached. The view is bearish.
(iv) 30-Minute Timeframe:
Strong selling is visible. Any upmove should be doubted. No bullish trade till price decisively trades above 26050 - 26100. The view is bearish.
Bullish Scenario Set-Up:
(i) Price sustains above the opening price.
(ii) Price starts to make a higher highs and higher lows structure above the 26050 - 26100 zone.
Bearish Scenario Set-Up:
(i) Price sustains below the opening price.
(ii) Price remains below 26050.
Expectation : For the monthly expiry, the price might expire below 26100.
Event : No major event. However, the Nifty 50 Monthly expiry is there. Volatility is expected.
Note:
"Mark your points. Trade your points. Price is God. Anything can happen. Trade what you see, not what you believe."
Happy Trading.

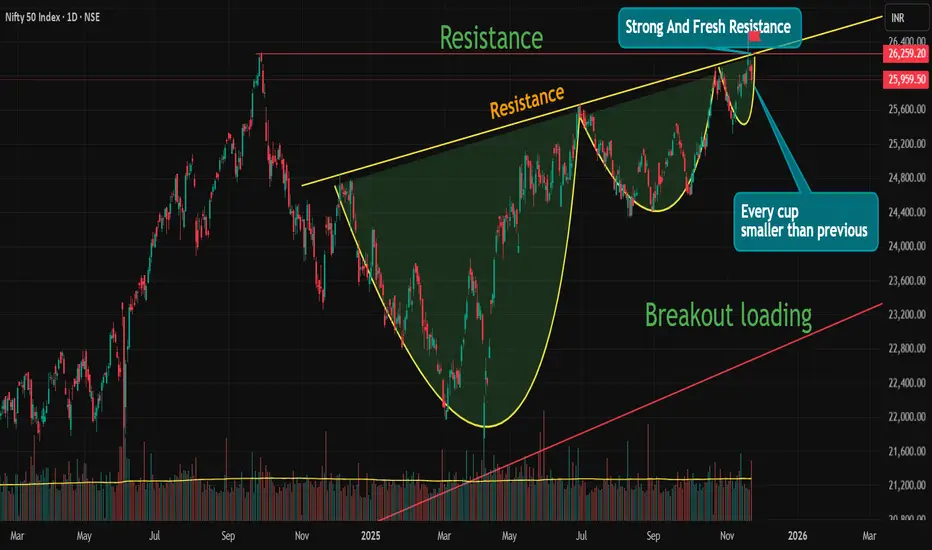
Something is cooking big than patternNSE:NIFTY
Nifty make continuously cup pattern smaller than previous cup . this is good sign for uptrend. but here also some negative points like all time resistance, negative pattern at all time resistance also another trend line resistance. global uncertainty here is big role. these are negative point.
you think i make confusion right but only half.
every analysis has two side
1. if analysis will right than we are ready for plan of action.
2. if analysis will wrong than we also ready for plan of action.
So, be prepared for both side.
Here is another 3 side if nifty make another cup 😅
hahahhaha
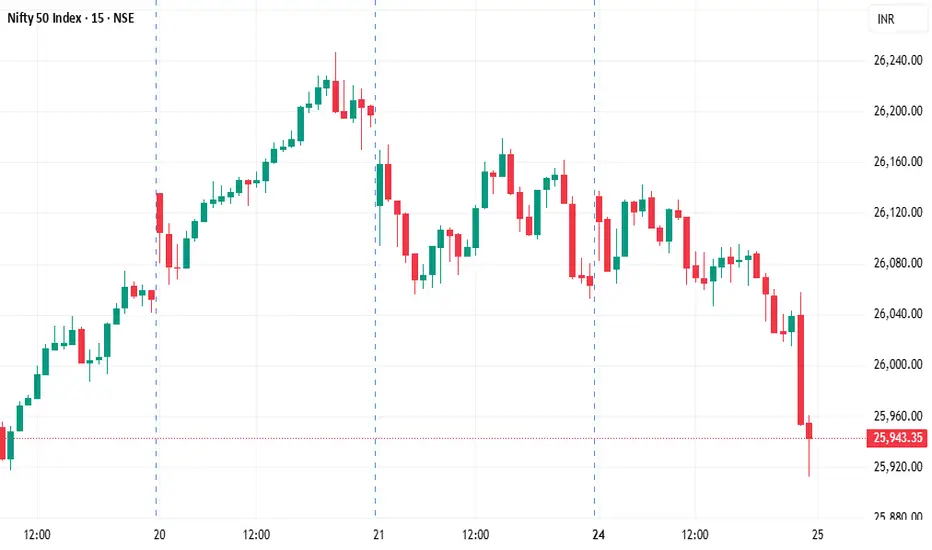
Nifty - Monthly expiry day analysis Nov 25Price formed a rising wedge pattern, and the price had a slow fall towards the support at 26k.
Today, the price broke the important psychological zone of 26k. Nearby support is seen at 25800, then at 25600. The price has formed a choppy range between 26000 and 26200 for the past days, and tomorrow if the price tests that range without strength, then again we will get a rangebound move.
Buy above 26020 with the stop loss of 25960 for the targets 26060, 26100, 26160, 26220, 26260 and 26320(If the price shows extreme bullish strength, then it can test these levels).
Sell below 25860 with the stop loss of 25920 for the targets 25820, 25780, 25720 and 25680.
Expected expiry day range is 25800 to 26200.
Always do your analysis before taking any trade.

Nifty Intraday Analysis for 24th November 2025NSE:NIFTY
Index has resistance near 26250 – 26300 range and if index crosses and sustains above this level then may reach near 26450 – 26500 range.
Nifty has immediate support near 25900 – 25850 range and if this support is broken then index may tank near 25700 – 25650 range.

Market Yellow line should be respectedMarket Yellow line should be respected and then to move towards all time high and even crossing it.

Nifty price Levels for day tradingThis analysis identifies critical Support (S) and Resistance (R) levels on the Nifty hourly chart, establishing a framework for day trading decisions.
These price points are considered indicative levels that define the market structure.
🔑 Key Levels Defined Upper Resistance (R2): approx 26,173 - 26,180 This is a strong overhead barrier. Sustained price action above this level would signal significant bullish momentum.
Frst support available at Range : approx 26,023 - 26,040
A crucial psychological and technical pivot. Holding above this level maintains a short-term bullish bias, while a break below suggests weakness.
Lower Support : approx 25,772
A key support zone. A breakdown below the Mid-Range Pivot is likely to lead the price down to test this area.
💡 Core Trading is The validity of directional moves relies on hourly closed candles. Breakout/Breakdown Confirmation: We look for an hourly candle close outside of these defined zones.
A decisive close confirms commitment and signals a potential shift into a new trend phase.
Intraday S/R: On smaller timeframes (5m/15m), these same levels will act as dynamic intraday Support and Resistance for range-bound or momentum-based trades.
In essence: Price movement is monitored relative to the Mid-Range Pivot (approx 26,040). Bullish Bias: Hold as long as the price holds above approx 26,040.
Bearish Bias: Confirmed on an hourly close below approx 26,023.

nifty 50
🔹 Nifty forming a clean symmetrical triangle on 15M ⏳
🔹 Strong support zone being tested multiple times 🛡️
🔹 Price getting squeezed → big move loading 🎯
🔹 Breakout above trendline = bullish momentum 🚀
🔹 Breakdown below support = quick downside flush ⚠️
🔹 Traders eyeing volatility expansion after long consolidation 📈📉
💡 Watch levels closely — breakout or breakdown will set the intraday tone!
#Nifty #Nifty50 #PriceAction #ChartAnalysis #Breakout #TradingSetup 🔥📊
