Trading with Volume1. What is Volume in Trading?
Volume is the total number of shares, contracts, or lots traded in a market during a particular period. Every time a buyer and seller make a transaction, it adds to the volume count.
For example:
If 10,00,000 shares of a stock are bought and sold during a day, that stock’s daily volume is 10 lakh.
If Bitcoin has 50,000 transactions in a 1-hour timeframe, that is its hourly volume.
Volume acts as the pulse of the market. When market participants are active, volume increases. When they lose interest, volume shrinks.
2. Why is Volume Important for Traders?
Volume helps traders answer critical questions:
a. Is the trend strong or weak?
A price trend supported by high volume is considered trustworthy. A trend on low volume is often weak and may collapse.
b. Is the breakout real or fake?
Strong volume during breakouts confirms genuine market interest. Low-volume breakouts often fail.
c. Is a reversal coming?
Volume spikes at tops or bottoms often indicate exhaustion and potential reversal.
d. Where are big players active?
Institutional traders like banks, funds, and smart money leave “footprints” through volume surges.
Thus, volume is a confirmation tool that helps traders avoid traps and make informed decisions.
3. Understanding Volume in Different Market Conditions
a. Volume in Uptrends
When volume rises along with price, the uptrend is considered healthy. Buyers are active and willing to buy at higher levels.
Signs of strong uptrend:
Price ↑ and Volume ↑ → Strong bullish trend
Pullback with low volume → Healthy correction
Signs of weakening uptrend:
Price ↑ but Volume ↓ → Weak trend, risk of reversal
b. Volume in Downtrends
In downtrends, high volume indicates strong selling pressure.
Strong downtrend signals:
Price ↓ and Volume ↑ → Strong bearish trend
Pullback with low volume → Continuation likely
Weak downtrend signals:
Price ↓ but Volume ↓ → Bear trend losing strength
c. Volume in Ranging Markets
In sideways markets, volume generally remains low. A sudden volume spike during range breakout signals trend formation.
4. How to Use Volume for Trading – Practical Techniques
Technique 1: Volume Breakout Trading
Breakouts are powerful signals but also come with fake moves. Volume confirms the authenticity.
Bullish breakout confirmation:
Price breaks resistance
Volume rises above average
Candle closes above breakout level
Bearish breakout confirmation:
Price breaks support
Volume spikes downward
Close is below the support level
Without volume confirmation, breakouts often fail and trap traders.
Technique 2: Volume Divergence
Divergence occurs when price and volume move opposite.
Examples:
Price making higher highs but volume making lower highs → Bullish trend weakening
Price making lower lows but volume decreasing → Bearish trend weakening
Such divergence often signals trend reversal.
Technique 3: Volume Spike Analysis
Sudden large volume spikes can mean:
A big player entering or exiting a position
Market turning point
Start of strong trend
At market bottoms, huge buying volume often appears. At tops, big selling volume may signal reversal.
Technique 4: Using Volume with Indicators
Some popular volume-based indicators:
a. Volume Moving Average (VMA)
Shows average volume to identify when current volume is unusually high or low.
b. On-Balance Volume (OBV)
Adds volume on up days, subtracts on down days to show accumulation/distribution.
c. Volume Weighted Average Price (VWAP)
Used by institutional traders; shows average price weighted by volume.
d. Money Flow Index (MFI)
Combines price and volume to detect overbought/oversold zones.
Using these indicators with price action increases trading accuracy.
5. Volume and Candlestick Patterns
Volume adds strength to candlestick signals.
Examples:
Bullish engulfing with high volume → Strong reversal
Hammer with high volume at support → Buyers entering
Doji with high volume → Indecision among big players
Volume validates candlestick reliability.
6. Volume and Support/Resistance Levels
Support and resistance zones are crucial. Volume helps confirm their strength.
At Support:
Price touches support with low volume → Support likely to hold
Price breaks support with high volume → Strong breakdown
At Resistance:
Price hits resistance with low volume → Resistance holding
Breaks resistance with high volume → Breakout confirmed
Volume acts as the deciding factor in whether levels hold or break.
7. How Smart Money Uses Volume
Institutional traders use volume to accumulate or distribute positions quietly.
Accumulation phase:
Price stays in range
Volume gradually increases
No big price movement
This indicates smart money buying.
Distribution phase:
Price stops rising
Volume spikes at peaks
Smart money selling to retail traders
Recognizing these phases helps traders identify big trends early.
8. Common Mistakes Traders Make with Volume
a. Believing every volume spike means breakout
Volume should be analyzed with price action, not in isolation.
b. Ignoring trend context
High volume in a range is meaningless unless combined with price breakout.
c. Misreading low-volume pullbacks
These are actually healthy for trends, not signs of weakness.
d. Trading without confirming volume
Entering trades based on price alone increases risk.
9. Best Practices for Volume Trading
Compare volume with average volume, not previous candles
Combine volume with trendlines, levels, and patterns
Avoid trading false breakouts without volume confirmation
Watch volume at key supports/resistances
Use volume indicators only as a supplement
Focus on multi-timeframe volume behavior
These practices significantly improve trading accuracy.
Conclusion
Trading with volume gives traders an edge by revealing the hidden strength behind price movements. Volume confirms trends, validates breakouts, identifies reversals, and exposes the actions of big players. When used correctly with price action, support/resistance, and technical indicators, volume becomes one of the most reliable tools in trading. For both beginners and advanced traders, mastering volume analysis is essential for smart, confident, and profitable trading decisions.
Trade ideas
NIFTY KEY LEVELS FOR 24.11.2025NIFTY KEY LEVELS FOR 24.11.2025
Timeframe: 3 Minutes
If the candle stays above the pivot point, it is considered a bullish bias; if it remains below, it indicates a bearish bias. Price may reverse near Resistance 1 or Support 1. If it moves further, the next potential reversal zone is near Resistance 2 or Support 2. If these levels are also broken, we can expect the trend.
When a support or resistance level is broken, it often reverses its role; a broken resistance becomes the new support, and a broken support becomes the new resistance.
If the range(R2-S2) is narrow, the market may become volatile or trend strongly. If the range is wide, the market is more likely to remain sideways
please like and share my idea if you find it helpful
📢 Disclaimer
I am not a SEBI-registered financial adviser.
The information, views, and ideas shared here are purely for educational and informational purposes only. They are not intended as investment advice or a recommendation to buy, sell, or hold any financial instruments.
Please consult with your SEBI-registered financial advisor before making any trading or investment decisions.
Trading and investing in the stock market involves risk, and you should do your own research and analysis. You are solely responsible for any decisions made based on this research.

NIFTY Levels for TodayHere are the NIFTY's Levels for intraday (in the image below) today. Based on market movement, these levels can act as support, resistance or both
Please consider these levels only if there is movement in index and 15m candle sustains at the given levels. The SL (Stop loss) for each BUY trade should be the previous RED candle below the given level. Similarly, the SL (Stop loss) for each SELL trade should be the previous GREEN candle above the given level.
Note: This idea and these levels are only for learning and educational purpose.
Your likes and boosts gives us motivation for continued learning and support.

#NIFTY Intraday Support and Resistance Levels - 24/11/2025Nifty is expected to open with a gap-up today, indicating early strength after the recent decline and signalling that buyers may attempt a recovery from lower levels. If the index sustains above the 26050–26100 zone, the long setup becomes active with upside targets of 26150, 26200, and 26250+. A breakout above the major resistance at 26250 can further extend the bullish momentum toward 26350, 26400, and 26450+.
On the downside, any weakness or reversal will be confirmed only if the index rejects the 26250–26200 zone, activating the reversal short setup toward 26150, 26100, and 26050-. An additional short opportunity emerges only if Nifty breaks below 25950, which opens targets of 25850, 25800, and 25750-. With a gap-up opening, early price action around the key zones will determine whether the market continues upward or faces resistance-driven pullback.

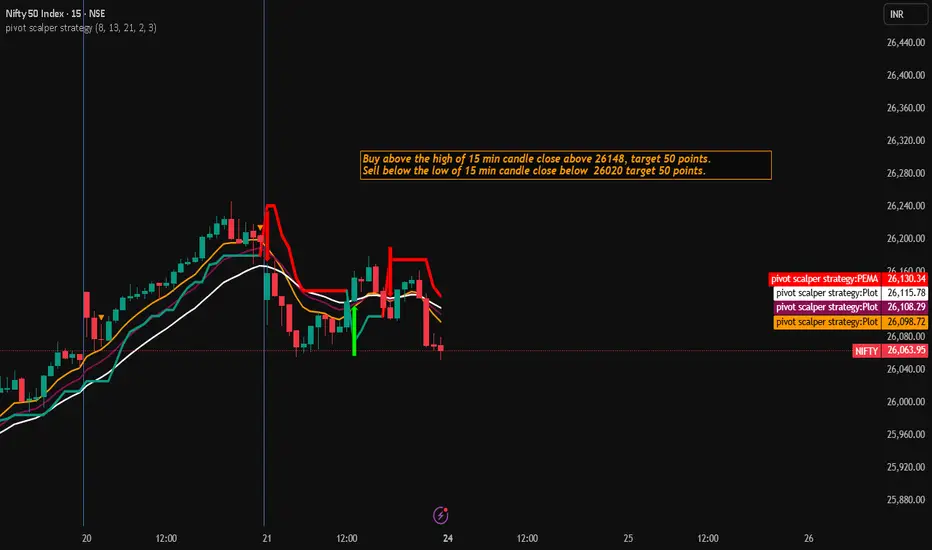
Nifty Trading Strategy for 24th November 2025📈 NIFTY Trading Plan – 15-Min Breakout Strategy
🟢 BUY Setup (Long Trade)
Trigger:
Enter only if a 15-minute candle closes above 26,148.
Entry:
✔️ Buy above 26,148 after confirmed candle close.
Target:
🎯 +50 points from entry.
Stop-Loss Suggestion:
🔒 SL can be kept below the breakout candle low or a nearby support zone (follow your risk rules).
Why this works:
A strong candle close above 26,148 indicates bullish momentum and early trend continuation. Waiting for the candle close filters out false breakouts.
🔴 SELL Setup (Short Trade)
Trigger:
Enter only if a 15-minute candle closes below 26,020.
Entry:
✔️ Sell below 26,020 after a confirmed candle close.
Target:
🎯 +50 points from entry.
Stop-Loss Suggestion:
🔒 SL can be kept above the breakdown candle high or a nearby resistance zone.
Why this works:
A breakdown below 26,020 confirms bearish pressure and opens room for a quick 50-point move toward the next support levels.
📌 Execution Notes
⏳ Always wait for candle close, not just wick break.
🎚️ Maintain proper risk–reward and avoid overtrading.
📊 Track market sentiment, global cues, and news events.
🧘 Trade calm — NIFTY can show sudden volatility around opening and news times.
⚠️ Disclaimer
🚫 I am not SEBI registered.
This analysis is only for educational purposes, not investment advice.
Trading in financial markets involves risk. Please do your own research or consult a certified financial advisor before taking any trades. You are responsible for your own trading decisions.
All time high near nifty 50be careful 3 time near this level so most probably to break this level in this week and give new high ..day candle is showing profit booking . ready for another move

IPO Mania – The Emotional Trap That Costs Crores!Hello Traders!
Whenever a big IPO hits the market, excitement spreads across India like wildfire.
You’ll hear people in offices, metros, and even chai stalls saying:
“Bhai, isme allotment mil gaya toh life ban jayegi!”
But behind the hype, most people forget one simple truth, IPOs are more psychological than financial.
This is why IPO mania traps thousands of investors every year.
1. The Illusion of Guaranteed Profit
Most new investors believe every IPO will list at a premium.
They confuse “subscription numbers” with “profit certainty.”
In reality, even heavily subscribed IPOs can list at a loss.
Hype does not equal returns.
But emotions make it feel like a sure-shot win.
2. Fear of Missing Out, India’s Biggest IPO Problem
When a big brand launches an IPO, everyone wants a piece of it.
People don’t analyse profits, cash flow, or debt, they buy because the crowd is buying.
This FOMO is what leads to overpriced valuations and poor listing performance.
If you enter because “everyone else is excited,” you’re already late.
3. The Oversubscription Trap
Retail sees 20x–50x subscription and thinks it guarantees listing gains.
But heavy oversubscription means demand is emotional, not rational.
Often, the listing day profit goes to institutional players, while retail gets stuck in pullbacks.
Oversubscription tells you one thing: the crowd is emotional, not smart.
4. When You Pay for the Brand, Not the Business
IPOs of famous companies attract blind buyers who trust the “brand name” more than the balance sheet.
But the price you pay on IPO day is usually the highest price the company has ever been valued at.
You’re paying for the story, not the actual numbers.
Brand popularity doesn't guarantee long-term returns.
5. How IPO Mania Costs Crores Every Year
Retail traders enter at peak excitement and exit at peak fear.
Most IPO investors sell at the first sight of red, turning temporary corrections into permanent losses.
Millions of rupees vanish each year because people trade IPOs emotionally, not strategically
The market punishes emotional decisions, especially in IPO season.
Rahul’s Tip:
Treat IPOs like any other investment, check fundamentals, valuation, debt, promoter quality, and long-term stability.
If you buy just because it’s “new,” you’re not investing, you’re gambling.
Conclusion:
IPOs are not guaranteed money machines.
They’re emotional traps disguised as opportunities.
If you learn to stay calm when the crowd gets excited, you’ll avoid the biggest IPO mistakes and protect your capital.
If this post opened your eyes to the reality behind IPO hype, like it, comment your thoughts, and follow for more honest trading psychology insights!

New High expectedAfter break of channel, new extreme is usually tested as per price action rule of trendline.
Nifty has broken Bull channel and at the same time. minor bear channel was also broken and it's new low was formed.
Now, we can expect Nifty to go for New High.

26000 will act as a SUPPORT now!As we can see NIFTY managed to close itself above 26000 level which was both a strong resistance and psychological level and closes both in daily as well as weekly time frame. Hence, following the structure we can confirm the NIFTY’s breakout and we can expect NIFTY to take support at 26000 levels which previously acted as a resistance. So, one can plan their trades accordingly keeping SL on closing basis below 25800 .

Bears Knocking, Then Reversal ? Weekly Wrap #Nifty50First Step of a successful trader is to build a Trade plan & review what he has done. (education purpose for all )
*Trend is rangbound, Short term Bearish.
*Trade plan: Sell on rise
* Critical Levels:
* Resistance:26135- 26200
* Support: 25960-25853
Jai Hind.
Disclaimer :
This video is only for educational purposes. Please consult your financial advisor before you take any trade.

Nifty - This Market Needs Breadth, Not GuessworkStop Searching for Bottoms — This Market Needs Breadth, Not Guesswork
These days I see so many new traders jumping from YouTube videos to X posts trying to “catch the bottom” or find some magic trick to trade in a weak broader market with weak macros.
This is the wrong approach.
Unless breadth improves, no setup will work.
Stop consuming unnecessary content. Stop learning things you shouldn’t.
Over-knowledge is a drug. You get addicted to learning new things nonstop — but in trading, execution pays… not unlimited learning.
Now coming to the market:
NSE:NIFTY gave a perfect squat day on Friday exactly as planned on Thursday.
When the index behaves exactly according to the plan, it means the environment is perfect for my setups.
A squat gives both-side moves, so we traded both calls and puts on Friday.
Pivot has now shifted to 26099 and Nifty closed below this level — this indicates short buildup on the index.
Our Macro Index has also fallen for 3 straight days, confirming weakness.
Strong support sits at 26000. If this breaks, the next support is at 25970–25950.
Resistance is at 26100. Even if price rises above this, it can become a bullish trap unless 26200 is taken out.
So until 26200 breaks, every bounce stays a Sell-on-Rise opportunity.
Even a gap-down directly to the support will still keep the Sell-on-Rise plan valid because index health will turn Orange from current Green.
However, if Nifty closes above 26200, this entire plan becomes invalid — though the probability is low because the Macro Index is weakening.
NSE:BANKNIFTY also looks weak for the coming week with support at 58300–58200.
New traders should avoid equities completely right now as no proper swing structures are visible.
📊 Levels at a Glance:
Pivot: 26099
Support: 26000 / 25850/25700
Resistance: 26100 (26200 must break to turn bullish)
Bias: Sell on Rise until 26200 breaks
Sector View: Weak overall; avoid new equity swings
That will be all for the day. Take care. Have a profitable week ahead.

Nifty Monthly Chart Suggest Breakout - Targets 31500+ in 18 MthsNifty Monthly Chart Suggest Breakout - Targets 31500+ in 18 Months.
LTP - 26068
Targets - 31500+
SL - 24000
Risk Reward Ratio - 1:2.75
Investments can be done in Quality Large Caps for next 2-3 Years for 50-60% ROI.
Happy Investing.

Bearish Nifty ExpirySir/Mam,
My view for this expiry is bearish. "Buy ONLY PE"
Buy PE whenever it goes up. You will see the levels crossing below 26000 and 25800 till Tuesday.
"MARK MY WORDS"
For safe Option Traders buy CE and PE of strike price 26200 which is approx. 177+50 = 227. Book profit - 250 (23 points) 100%
Get back to me with your comments if this goes accordingly.
Stay safe and healthy.

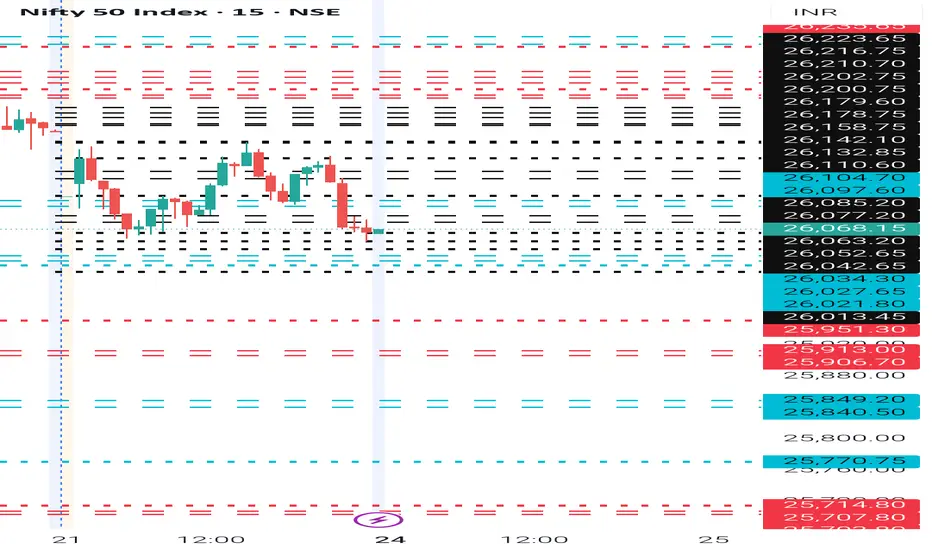
NIFTY- Intraday Levels - 24th November 2025If NIFTY sustain above 26077/85 above this bullish then around 26097/ 26110 or 26132/42 above this more bullish then 26158/78 or 26200/223 strong level then above this wait more levels marked on chart
If NIFTY sustain below 26013 below this bearish then 25951/06 below this more bearish then 25849/40 strong level then very very strong level 25770 below this wait more levels marked on chart
My view :-
"My viewpoint, offered purely for analytical consideration, The trading thesis is: Nifty (bearish tactical approach: sell on rise) expecting both side movements, with high volatility.
This analysis is highly speculative and is not guaranteed to be accurate; therefore, the implementation of stringent risk controls is non-negotiable for mitigating trade risk."
Consider some buffer points in above levels.
Please do your due diligence before trading or investment.
**Disclaimer -
I am not a SEBI registered analyst or advisor. I does not represent or endorse the accuracy or reliability of any information, conversation, or content. Stock trading is inherently risky and the users agree to assume complete and full responsibility for the outcomes of all trading decisions that they make, including but not limited to loss of capital. None of these communications should be construed as an offer to buy or sell securities, nor advice to do so. The users understands and acknowledges that there is a very high risk involved in trading securities. By using this information, the user agrees that use of this information is entirely at their own risk.
Thank you.
Breakout in NiftyA perfect cup and handle has formed in nifty weekly timeframe. comment for for details.

NIFTY 50 – Weekly Resistance Test & Monday (24 Nov) Price ScenarNifty closed the week around 26,068, right at a major weekly resistance zone that hasn’t been broken decisively for nearly one full year. The market is currently positioned at a key decision point where short-term pullbacks are possible, while the broader trend remains firmly bullish.
Here’s a clean breakdown of the technical structure:
1. Weekly Structure – Key Context (Most Important)
Nifty is retesting a 1-year supply zone.
Price has re-entered the same weekly resistance region where a major correction began last year. This naturally increases:
•profit-booking probability
•early-week volatility
•chances of a minor pullback before breakout
Weekly candle shows upper-wick rejection
Although buyers pushed strongly, the wick confirms supply at this zone.
Weekly volume increased
Buyers are active, but not enough to break out cleanly → suggesting the market needs a dip before continuing higher.
2. Daily & Intraday Structure
Trend is still strongly bullish (HH-HL formation)
Recent candles show lower volume on the pullback
Key supports are holding:
• 26,050–26,070 (intraday demand)
• 25,964 (opening support)
• 25,902 (last intraday support)
3. Monday (24 Nov) – Probability-Weighted Scenarios
Scenario A – Mild Pullback Before Reversal (Most Likely – 65%)
Due to weekly resistance + wick rejection + low-volume up move:
• Flat / slight gap-down open
• Retest of 26,050–26,070
• Buyers likely step in
• Intraday reversal from support
• Targets → 26,110 → 26,135 → 26,150
Why this is likely:
Pullback shows up on all timeframes without breaking trend.
Scenario B – Range & Consolidation (25% probability)
If Nifty opens inside 26,050–26,110:
• Low volatility early
• Sideways movement
• Market builds energy for later move
• Breakout above 26,120 decides trend continuation
Key breakout level:
- Sustained move above 26,120–26,135
opens the way to 26,183 → 26,219.
Scenario C – Straight Breakout (Least likely – 10%)
For this to occur:
• Gap-up above 26,150
• Strong volume expansion
• Clear rejection of supply zone
Possible but unlikely because:
• Weekly supply is strong
• Daily volume on the up move was weak
• Market rarely breaks a year-long resistance without a dip
4. Key Levels to Watch
Immediate Supports
• 26,070 (trend support)
• 26,050 (intraday demand)
• 25,964 (opening support)
• 25,902 (last intraday support)
Immediate Resistances
• 26,135–26,150 (short-term supply)
• 26,183
• 26,219
• 26,246
Break above 26,150 = trend continuation
Break below 25,964 = deeper pullback
5. Summary
• Broader trend: Bullish
• Weekly view: At heavy resistance
• Daily view: Low-volume rise → pullback likely
• Hourly view: Buyers still stronger than sellers
• Most likely open: flat / mild pullback → intraday recovery

NIFTY SPOT@26068, GO LONG FOR 750 POINTNifty @ 25068, just chart pattern analysis gave breakout from rounding bottom and retested level RSI & MACD positive. Nifty can scale to 26800 in 7-9 days.

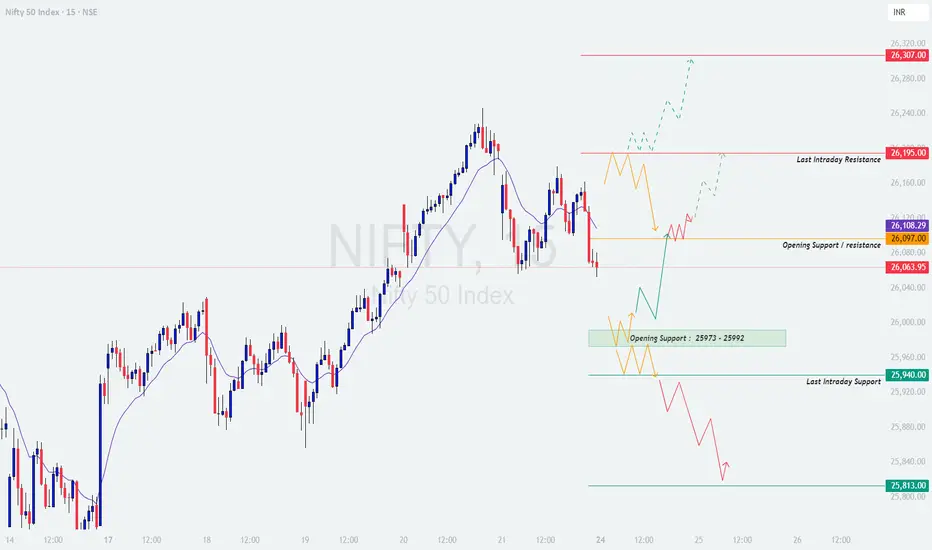
NIFTY : Trading levels and Plan for 24-Nov-2025📊 NIFTY TRADING PLAN — 24 NOV 2025
(Reference: 15-min chart structure & mapped intraday levels)
Nifty closed near 26,064, sitting just below the Opening Support / Resistance Zone (26,097–26,108).
The recent fall has brought price into a critical region where buyers and sellers will fight for control, making tomorrow’s open highly important.
🔑 Key Levels
🟥 Last Intraday Resistance: 26,195
🟥 Major Resistance: 26,307
🟧 Opening S/R Zone: 26,097 – 26,108
🟩 Opening Support Zone (Gap-Down Case): 25,973 – 25,992
🟩 Last Intraday Support: 25,940
🟩 Deep Support: 25,813
Below is the complete scenario-wise actionable plan 👇
🟢 SCENARIO 1 — GAP-UP OPENING (100+ points)
If Nifty opens around 26,160–26,210, price immediately tests the Last Intraday Resistance (26,195).
If price sustains above 26,195 for 10–20 mins with strong green candles →
🎯 Upside targets → 26,240 → 26,275 → 26,307
If price rejects 26,195 with long wicks →
Expect correction toward 26,120 → 26,097
A bullish retest at 26,097–26,108 can offer a low-risk long entry.
Avoid chasing the breakout candle—gap-ups near resistance often create bull traps.
📘 Educational Note:
Gap-up trades work best when price forms higher lows immediately after opening. A sideways or weak first 5–15 mins signals exhaustion.
🟧 SCENARIO 2 — FLAT OPENING (Near 26,050–26,100)
This puts price directly inside the Opening S/R Zone (26,097–26,108) — a decision-making region.
A clean breakout above 26,108 with a retest →
🎯 Targets → 26,150 → 26,195
On breakdown below 26,050, expect a drop toward:
➡️ 25,992 → 25,973
Avoid trading inside 26,050–26,108 zone initially; wait for direction clarity.
Best trend trades will come from:
— Breakout → Retest → Continuation
— Support bounce from 25,973–25,992
💡 Educational Tip:
Flat opens often give clean directional plays once the first 15-min candle closes. Patience pays.
🔻 SCENARIO 3 — GAP-DOWN OPENING (100+ points)
A gap-down into 25,973–25,992 brings price directly into strong support.
If 25,973–25,992 holds with bullish wick rejection →
🎯 Upside targets → 26,020 → 26,063 → 26,108
If price breaks below 25,973, next strong support is:
➡️ 25,940 (Last Intraday Support)
If 25,940 also fails → expect deeper fall toward 25,813
A sharp V-shaped reversal from 25,813 can become the best long trade of the day.
📘 Educational Note:
Gap-downs into major supports often produce intraday reversals—but only after confirming rejection with strong candles.
💼 RISK MANAGEMENT TIPS FOR OPTION TRADERS 💡
Avoid trading the first 5–10 minutes after open.
Prefer ATM/ITM options for directional moves.
Always predefine your SL—don’t widen it emotionally.
Never average losing trades.
When VIX is low → option buying works better.
When VIX is high → use spreads or hedged selling.
Book profits in parts to lock in gains during reversals.
⚠️ Golden Rule:
Protect capital first—opportunities come every day.
📌 SUMMARY
Bullish above → 26,108
🎯 Targets → 26,150 → 26,195 → 26,240 → 26,307
Bearish below → 25,992
🎯 Targets → 25,973 → 25,940 → 25,813
No-Trade Zones:
— 26,050–26,108 (choppy decision zone)
— 26,175–26,195 (high-risk supply zone)
🧾 CONCLUSION
Nifty sits near a sensitive reversal region.
Tomorrow’s trend depends entirely on how price reacts to:
✔️ 26,108 breakout
✔️ 25,973 support
The safest and highest-quality trades will come from retests, not impulsive entries.
Let the market reveal direction before you act.
⚠️ DISCLAIMER
I am not a SEBI-registered analyst.
This analysis is purely for educational purposes.
Please consult a certified financial advisor before trading or investing.
vaibhavraj12We can see a very interesting pattern formation. Price has formed an ascending triangle pattern before breaking out to the upside. After that, it has formed a descending triangle. There is a trend direction zone between 85000 and 85200.
How the price reacts between 85000 and 85200 will decide the trend direction.
Buy above 85260 with the stop loss of 85120 for the targets 85380, 85520, 85680, 85840, 85980, 86120 and 86300.
Sell below 84900 with the stop loss of 85060 for the targets 84760, 84620, 84480, 84320, 84160, 84020, 83880 and 83740.

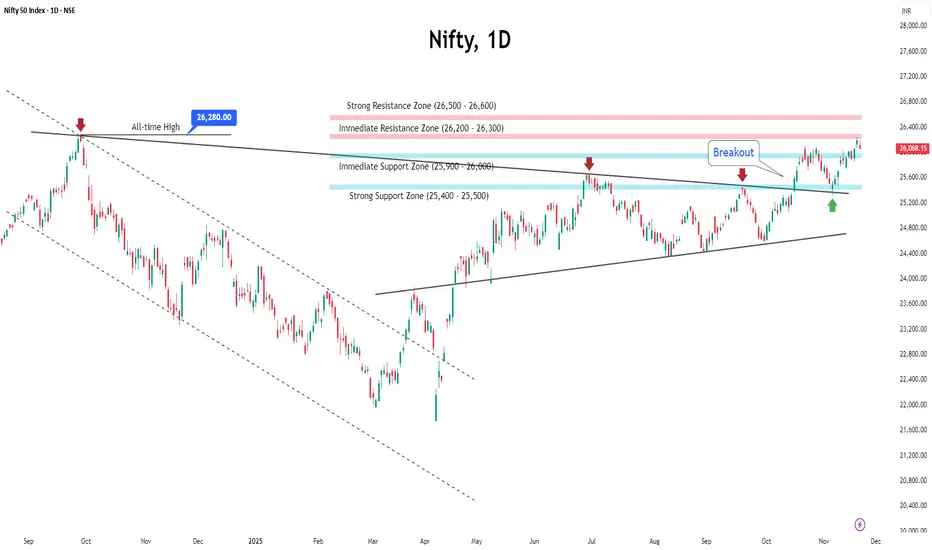
Nifty Breaks Above 26,000 — Can the Index Sustain This Strength?Indian markets ended the week on a positive note, with the Nifty rising 0.61% to close at 26,068. This came right after the index hit a fresh 52-week high of 26,246 on November 20 before cooling off.
Meanwhile, the India VIX jumped 14% to 13.63, reminding traders that volatility is quietly tightening its grip.
◉ Key Levels to Watch
Support Zones
Immediate support: 26,000.
Major support: 25,400 – 25,500, where strong put writing is visible
Resistance Zones
Near-term resistance: 26,200 – 26,300
Major resistance: 26,500
◉ Key Triggers This Week
Q2 GDP Data (Nov 28)
India’s GDP print for Q2 FY25–26 will be released this week.
Economists expect another strong reading, especially after Q1 GDP exceeded projections.
India–US Trade Deal Progress
Comments from Commerce Minister Piyush Goyal—hinting at “good news soon”—have lifted sentiment.
The proposed agreement aims to increase bilateral trade from $191 billion to $500 billion by 2030.
◉ Outlook & Strategy
For the coming week, a buy-on-dips approach remains favourable as long as Nifty sustains above 26,000.
A breakdown below this level could shift momentum, but for now, the bias stays positive with caution due to higher volatility.
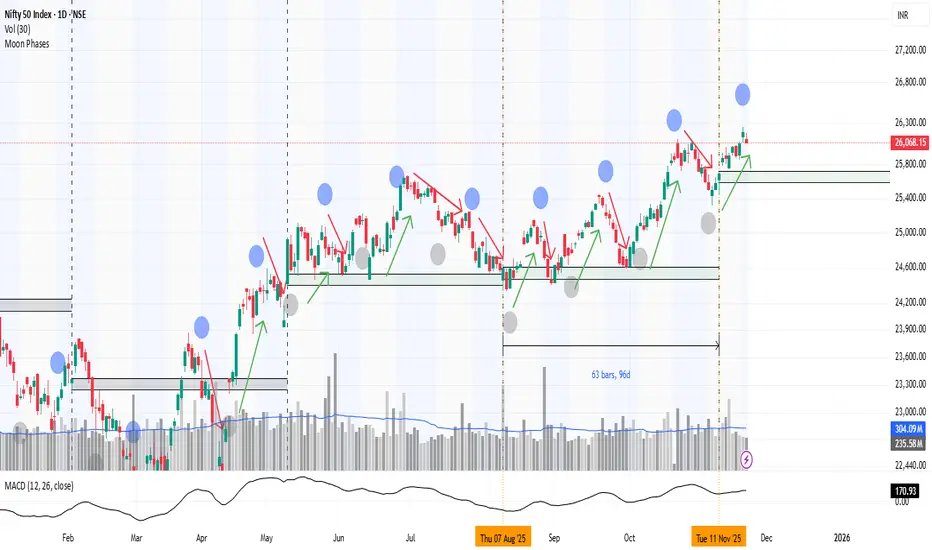
Nifty weekly view with moon phase & time cycle candleBelieve it or not, the Moon phase does its work. From New Moon to Full Moon, this up and down dance goes on in the market. It goes on and we are not able to pay attention to it, but it works. You will see that the market falls from New Moon and after Full Moon, the market starts moving upwards. It is difficult to say, but its effect starts becoming visible within plus minus 3 days.
And along with this, let me tell you that the high of the candle of 11th November was around 25715 and the low was around 25450, so this is the area of support(LOC).
And also remember that if the market can hold this support zone till 28th November (Ashtami Tithi), then it will be a very good thing. If the market breaks this support before the situation, then you may see even bigger blood bath in the market.
#Nifty Weekly 24-11-25 to 28-11-25#Nifty Weekly 24-11-25 to 28-11-25
26000-26250 is the range for next week.
Option sellers can consider the above range.
If Nifty sustains above 26250, more upside possible and targets are 26500/26780.
If Nifty trades below 25980, more downside possible and targets are 25850/25700.
View: Bullish to Sideways

