Nifty Monthly Chart Suggest Breakout - Targets 31500+ in 18 MthsNifty Monthly Chart Suggest Breakout - Targets 31500+ in 18 Months.
LTP - 26068
Targets - 31500+
SL - 24000
Risk Reward Ratio - 1:2.75
Investments can be done in Quality Large Caps for next 2-3 Years for 50-60% ROI.
Happy Investing.
Trade ideas

Bearish Nifty ExpirySir/Mam,
My view for this expiry is bearish. "Buy ONLY PE"
Buy PE whenever it goes up. You will see the levels crossing below 26000 and 25800 till Tuesday.
"MARK MY WORDS"
For safe Option Traders buy CE and PE of strike price 26200 which is approx. 177+50 = 227. Book profit - 250 (23 points) 100%
Get back to me with your comments if this goes accordingly.
Stay safe and healthy.

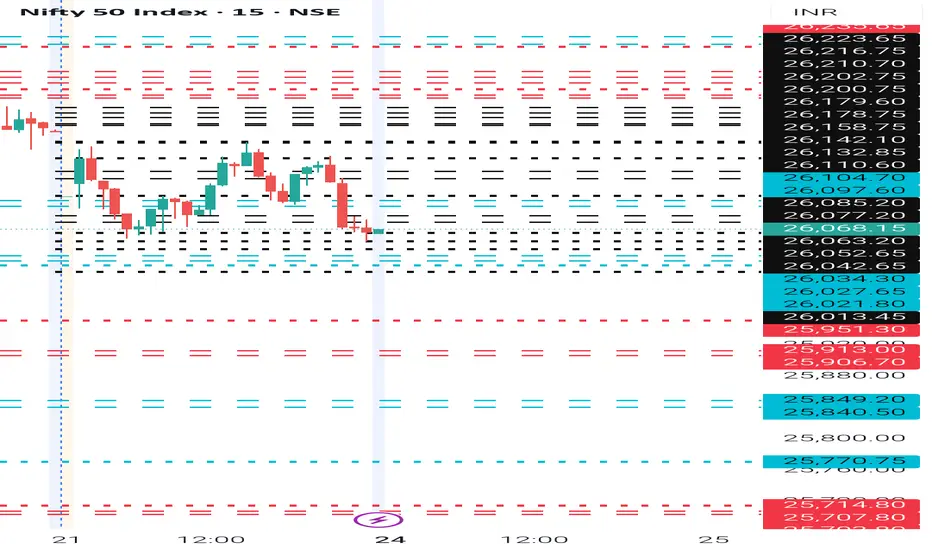
NIFTY- Intraday Levels - 24th November 2025If NIFTY sustain above 26077/85 above this bullish then around 26097/ 26110 or 26132/42 above this more bullish then 26158/78 or 26200/223 strong level then above this wait more levels marked on chart
If NIFTY sustain below 26013 below this bearish then 25951/06 below this more bearish then 25849/40 strong level then very very strong level 25770 below this wait more levels marked on chart
My view :-
"My viewpoint, offered purely for analytical consideration, The trading thesis is: Nifty (bearish tactical approach: sell on rise) expecting both side movements, with high volatility.
This analysis is highly speculative and is not guaranteed to be accurate; therefore, the implementation of stringent risk controls is non-negotiable for mitigating trade risk."
Consider some buffer points in above levels.
Please do your due diligence before trading or investment.
**Disclaimer -
I am not a SEBI registered analyst or advisor. I does not represent or endorse the accuracy or reliability of any information, conversation, or content. Stock trading is inherently risky and the users agree to assume complete and full responsibility for the outcomes of all trading decisions that they make, including but not limited to loss of capital. None of these communications should be construed as an offer to buy or sell securities, nor advice to do so. The users understands and acknowledges that there is a very high risk involved in trading securities. By using this information, the user agrees that use of this information is entirely at their own risk.
Thank you.
Breakout in NiftyA perfect cup and handle has formed in nifty weekly timeframe. comment for for details.

NIFTY 50 – Weekly Resistance Test & Monday (24 Nov) Price ScenarNifty closed the week around 26,068, right at a major weekly resistance zone that hasn’t been broken decisively for nearly one full year. The market is currently positioned at a key decision point where short-term pullbacks are possible, while the broader trend remains firmly bullish.
Here’s a clean breakdown of the technical structure:
1. Weekly Structure – Key Context (Most Important)
Nifty is retesting a 1-year supply zone.
Price has re-entered the same weekly resistance region where a major correction began last year. This naturally increases:
•profit-booking probability
•early-week volatility
•chances of a minor pullback before breakout
Weekly candle shows upper-wick rejection
Although buyers pushed strongly, the wick confirms supply at this zone.
Weekly volume increased
Buyers are active, but not enough to break out cleanly → suggesting the market needs a dip before continuing higher.
2. Daily & Intraday Structure
Trend is still strongly bullish (HH-HL formation)
Recent candles show lower volume on the pullback
Key supports are holding:
• 26,050–26,070 (intraday demand)
• 25,964 (opening support)
• 25,902 (last intraday support)
3. Monday (24 Nov) – Probability-Weighted Scenarios
Scenario A – Mild Pullback Before Reversal (Most Likely – 65%)
Due to weekly resistance + wick rejection + low-volume up move:
• Flat / slight gap-down open
• Retest of 26,050–26,070
• Buyers likely step in
• Intraday reversal from support
• Targets → 26,110 → 26,135 → 26,150
Why this is likely:
Pullback shows up on all timeframes without breaking trend.
Scenario B – Range & Consolidation (25% probability)
If Nifty opens inside 26,050–26,110:
• Low volatility early
• Sideways movement
• Market builds energy for later move
• Breakout above 26,120 decides trend continuation
Key breakout level:
- Sustained move above 26,120–26,135
opens the way to 26,183 → 26,219.
Scenario C – Straight Breakout (Least likely – 10%)
For this to occur:
• Gap-up above 26,150
• Strong volume expansion
• Clear rejection of supply zone
Possible but unlikely because:
• Weekly supply is strong
• Daily volume on the up move was weak
• Market rarely breaks a year-long resistance without a dip
4. Key Levels to Watch
Immediate Supports
• 26,070 (trend support)
• 26,050 (intraday demand)
• 25,964 (opening support)
• 25,902 (last intraday support)
Immediate Resistances
• 26,135–26,150 (short-term supply)
• 26,183
• 26,219
• 26,246
Break above 26,150 = trend continuation
Break below 25,964 = deeper pullback
5. Summary
• Broader trend: Bullish
• Weekly view: At heavy resistance
• Daily view: Low-volume rise → pullback likely
• Hourly view: Buyers still stronger than sellers
• Most likely open: flat / mild pullback → intraday recovery

NIFTY SPOT@26068, GO LONG FOR 750 POINTNifty @ 25068, just chart pattern analysis gave breakout from rounding bottom and retested level RSI & MACD positive. Nifty can scale to 26800 in 7-9 days.

NIFTY : Trading levels and Plan for 24-Nov-2025📊 NIFTY TRADING PLAN — 24 NOV 2025
(Reference: 15-min chart structure & mapped intraday levels)
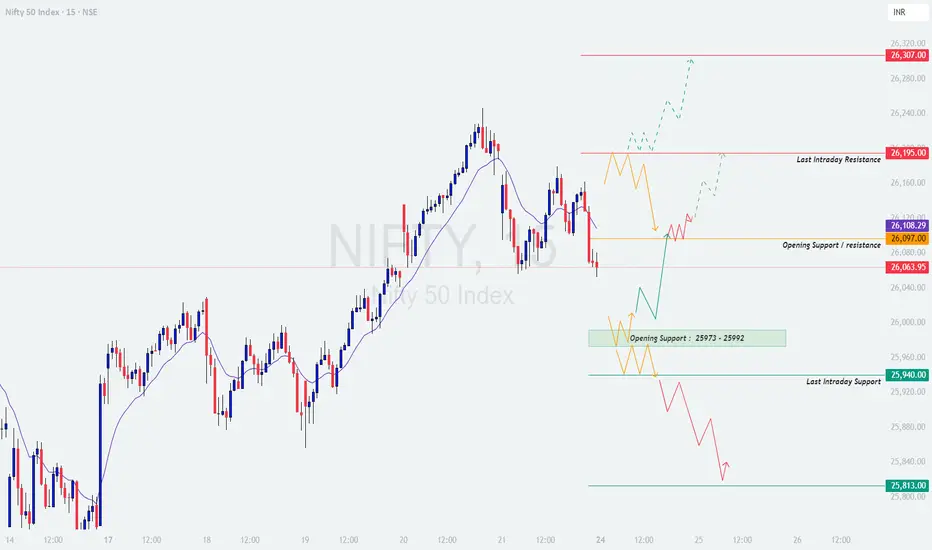
Nifty closed near 26,064, sitting just below the Opening Support / Resistance Zone (26,097–26,108).
The recent fall has brought price into a critical region where buyers and sellers will fight for control, making tomorrow’s open highly important.
🔑 Key Levels
🟥 Last Intraday Resistance: 26,195
🟥 Major Resistance: 26,307
🟧 Opening S/R Zone: 26,097 – 26,108
🟩 Opening Support Zone (Gap-Down Case): 25,973 – 25,992
🟩 Last Intraday Support: 25,940
🟩 Deep Support: 25,813
Below is the complete scenario-wise actionable plan 👇
🟢 SCENARIO 1 — GAP-UP OPENING (100+ points)
If Nifty opens around 26,160–26,210, price immediately tests the Last Intraday Resistance (26,195).
If price sustains above 26,195 for 10–20 mins with strong green candles →
🎯 Upside targets → 26,240 → 26,275 → 26,307
If price rejects 26,195 with long wicks →
Expect correction toward 26,120 → 26,097
A bullish retest at 26,097–26,108 can offer a low-risk long entry.
Avoid chasing the breakout candle—gap-ups near resistance often create bull traps.
📘 Educational Note:
Gap-up trades work best when price forms higher lows immediately after opening. A sideways or weak first 5–15 mins signals exhaustion.
🟧 SCENARIO 2 — FLAT OPENING (Near 26,050–26,100)
This puts price directly inside the Opening S/R Zone (26,097–26,108) — a decision-making region.
A clean breakout above 26,108 with a retest →
🎯 Targets → 26,150 → 26,195
On breakdown below 26,050, expect a drop toward:
➡️ 25,992 → 25,973
Avoid trading inside 26,050–26,108 zone initially; wait for direction clarity.
Best trend trades will come from:
— Breakout → Retest → Continuation
— Support bounce from 25,973–25,992
💡 Educational Tip:
Flat opens often give clean directional plays once the first 15-min candle closes. Patience pays.
🔻 SCENARIO 3 — GAP-DOWN OPENING (100+ points)
A gap-down into 25,973–25,992 brings price directly into strong support.
If 25,973–25,992 holds with bullish wick rejection →
🎯 Upside targets → 26,020 → 26,063 → 26,108
If price breaks below 25,973, next strong support is:
➡️ 25,940 (Last Intraday Support)
If 25,940 also fails → expect deeper fall toward 25,813
A sharp V-shaped reversal from 25,813 can become the best long trade of the day.
📘 Educational Note:
Gap-downs into major supports often produce intraday reversals—but only after confirming rejection with strong candles.
💼 RISK MANAGEMENT TIPS FOR OPTION TRADERS 💡
Avoid trading the first 5–10 minutes after open.
Prefer ATM/ITM options for directional moves.
Always predefine your SL—don’t widen it emotionally.
Never average losing trades.
When VIX is low → option buying works better.
When VIX is high → use spreads or hedged selling.
Book profits in parts to lock in gains during reversals.
⚠️ Golden Rule:
Protect capital first—opportunities come every day.
📌 SUMMARY
Bullish above → 26,108
🎯 Targets → 26,150 → 26,195 → 26,240 → 26,307
Bearish below → 25,992
🎯 Targets → 25,973 → 25,940 → 25,813
No-Trade Zones:
— 26,050–26,108 (choppy decision zone)
— 26,175–26,195 (high-risk supply zone)
🧾 CONCLUSION
Nifty sits near a sensitive reversal region.
Tomorrow’s trend depends entirely on how price reacts to:
✔️ 26,108 breakout
✔️ 25,973 support
The safest and highest-quality trades will come from retests, not impulsive entries.
Let the market reveal direction before you act.
⚠️ DISCLAIMER
I am not a SEBI-registered analyst.
This analysis is purely for educational purposes.
Please consult a certified financial advisor before trading or investing.
vaibhavraj12We can see a very interesting pattern formation. Price has formed an ascending triangle pattern before breaking out to the upside. After that, it has formed a descending triangle. There is a trend direction zone between 85000 and 85200.
How the price reacts between 85000 and 85200 will decide the trend direction.
Buy above 85260 with the stop loss of 85120 for the targets 85380, 85520, 85680, 85840, 85980, 86120 and 86300.
Sell below 84900 with the stop loss of 85060 for the targets 84760, 84620, 84480, 84320, 84160, 84020, 83880 and 83740.

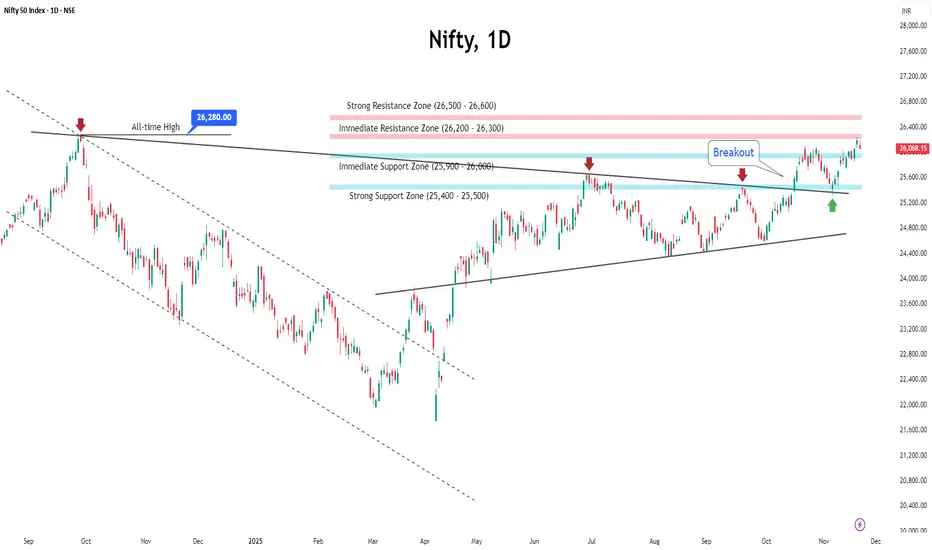
Nifty Breaks Above 26,000 — Can the Index Sustain This Strength?Indian markets ended the week on a positive note, with the Nifty rising 0.61% to close at 26,068. This came right after the index hit a fresh 52-week high of 26,246 on November 20 before cooling off.
Meanwhile, the India VIX jumped 14% to 13.63, reminding traders that volatility is quietly tightening its grip.
◉ Key Levels to Watch
Support Zones
Immediate support: 26,000.
Major support: 25,400 – 25,500, where strong put writing is visible
Resistance Zones
Near-term resistance: 26,200 – 26,300
Major resistance: 26,500
◉ Key Triggers This Week
Q2 GDP Data (Nov 28)
India’s GDP print for Q2 FY25–26 will be released this week.
Economists expect another strong reading, especially after Q1 GDP exceeded projections.
India–US Trade Deal Progress
Comments from Commerce Minister Piyush Goyal—hinting at “good news soon”—have lifted sentiment.
The proposed agreement aims to increase bilateral trade from $191 billion to $500 billion by 2030.
◉ Outlook & Strategy
For the coming week, a buy-on-dips approach remains favourable as long as Nifty sustains above 26,000.
A breakdown below this level could shift momentum, but for now, the bias stays positive with caution due to higher volatility.
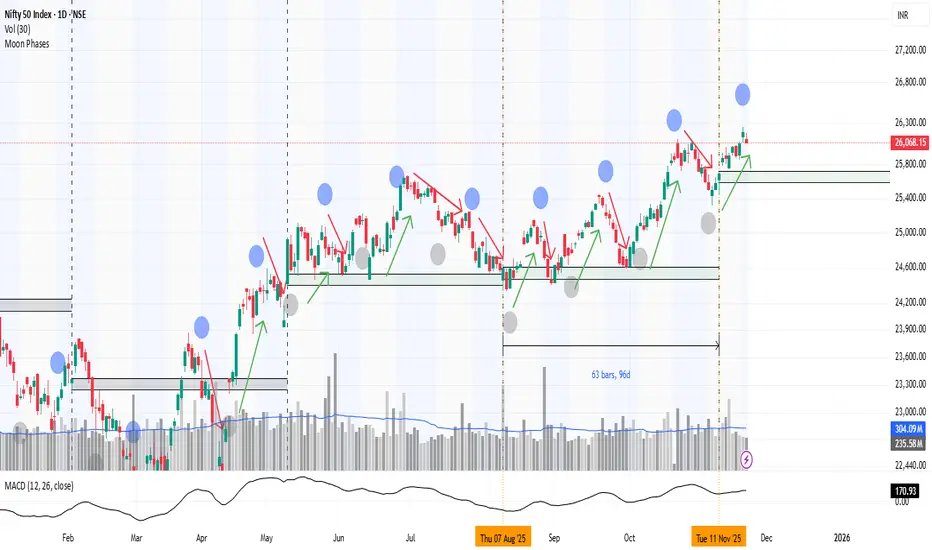
Nifty weekly view with moon phase & time cycle candleBelieve it or not, the Moon phase does its work. From New Moon to Full Moon, this up and down dance goes on in the market. It goes on and we are not able to pay attention to it, but it works. You will see that the market falls from New Moon and after Full Moon, the market starts moving upwards. It is difficult to say, but its effect starts becoming visible within plus minus 3 days.
And along with this, let me tell you that the high of the candle of 11th November was around 25715 and the low was around 25450, so this is the area of support(LOC).
And also remember that if the market can hold this support zone till 28th November (Ashtami Tithi), then it will be a very good thing. If the market breaks this support before the situation, then you may see even bigger blood bath in the market.
#Nifty Weekly 24-11-25 to 28-11-25#Nifty Weekly 24-11-25 to 28-11-25
26000-26250 is the range for next week.
Option sellers can consider the above range.
If Nifty sustains above 26250, more upside possible and targets are 26500/26780.
If Nifty trades below 25980, more downside possible and targets are 25850/25700.
View: Bullish to Sideways


Why 26,000 is Critical for Monday (24 Nov)📊 Key Levels for Monday (Snapshot):
🔻 Bearish Breakdown: Below 26,020 (S1) | Target: 25,972
🚀 Bullish Recovery: Above 26,147 (R1) | Target: 26,226
⚠️ Neutral Zone: 26,020 - 26,147 (No Trade Zone)
Institutional Data:
FII Net Sell: -₹1,262 Cr
DII Net Buy: +₹1,757 Cr
👇 Join the Discussion: Do you think DIIs can save the 26,000 level on Monday? Comment "26k" if you trust the support!

Nifty - 150 number LogicSir/Mam,
The market specially options are very hard to book profits as we have to be very clever of the NUMBERS GAME - 150
Let me make it clear as we all know the Nifty closing 26068.15. We need to keep 26050 CE and PE in your watchlist. Buy when both calculated value comes 150 or below (CE + PE) for e.g. now it is - 116+92 = 208 wait until it comes near - 150. Maybe it will come on Monday or Tuesday, you will have chunk of profit of sure.
Option trading is just a number which we need to capture it perfectly. The chart is just to make traders distract from the fear of upside or downside. The real trading is in the value which you buy and sell.
Agree that some make profit and loss. But when you have the correct number caught up then it is hard to get loss in it.
Now let's jump to Chart what we can visualize from that is,
26200 - Sell Zone
26050 - Not to Trade Zone
25900 - Support Zone
The above is levels where all traders get panic. So, we have to be smart to buy CE and PE as discussed above. When market comes to that level the values changed horribly as the value keep on changing to know the interest of the buyers and sellers at this point only levels get running upside or downside.
Sharing this idea, which is beyond logic, but this is best way to earn profit and to stay in Option Trading for coming days.
Hope you will like this idea.
Thanks for taking time.

Crucial weeks ahead - NIFTYNIFTY seems to be retesting its ATH zones with the Q3 looming near , we can expect some interesting movements happening in the market. Trade/invest with caution :)

NIFTY- VCP BreakoutThe Setup: Low-Risk Launchpad
The Nifty 50 Index has formed the Volatility Contraction Pattern (VCP) at its all-time high. A strong close above the pivot is required for further trend confirmation.
VCP Structure: The index formed a large base (similar to a Cup-with-Handle) that demonstrated several phases of tightening volatility, culminating in a very tight, low-risk consolidation (the final VCP/Handle) just below the ₹26,282 pivot.
Breakout Confirmation: The price has decisively cleared the ₹26,000 resistance, and the subsequent minor consolidation is occurring above this pivot, confirming the former resistance as new strong support.
Structural Health: The index remains above all rising major moving averages, indicating exceptional underlying strength and institutional control.
The Strategy
The primary strategy is to maintain a bullish bias and use minor pullbacks as opportunities to add to leading stocks.
Actionable Zone: The current consolidation area, just above the ₹26,282 breakout level, is the re-entry window.
Continuation Pivot: A decisive weekly close above ₹26,068 (the recent high) would signal the acceleration of the momentum.
Risk Management: The immediate risk point is the breakdown of the former pivot. Place a structural stop for market hedges or portfolio risk management below ₹25,250 - ₹25,500.
Conclusion
The Nifty 50 is technically poised for sustained upside into new price discovery territory, with the VCP breakout providing strong conviction in the continuation of the primary trend.

Part 8 Trading Master Class With ExpertsOptions Trading Styles in Markets
1. Intraday Option Trading
Fast movements
High leverage
Requires quick decision-making
2. Positional Options Trading
Holding for days or weeks
Less stressful than intraday
3. Weekly Expiry Trading (India-specific)
NIFTY & BANK NIFTY weekly options
Very popular among retail traders
Weekly options bring rapid time decay, which benefits option sellers but hurts buyers.

Nifty in corrective zoneWell as per proce action and ICT..there is a short correction may appear Tommorow n further for few days..as per my analysis it may take exterior liquidity and then may continue to bullish form and make a new high and shift structure to bullish side
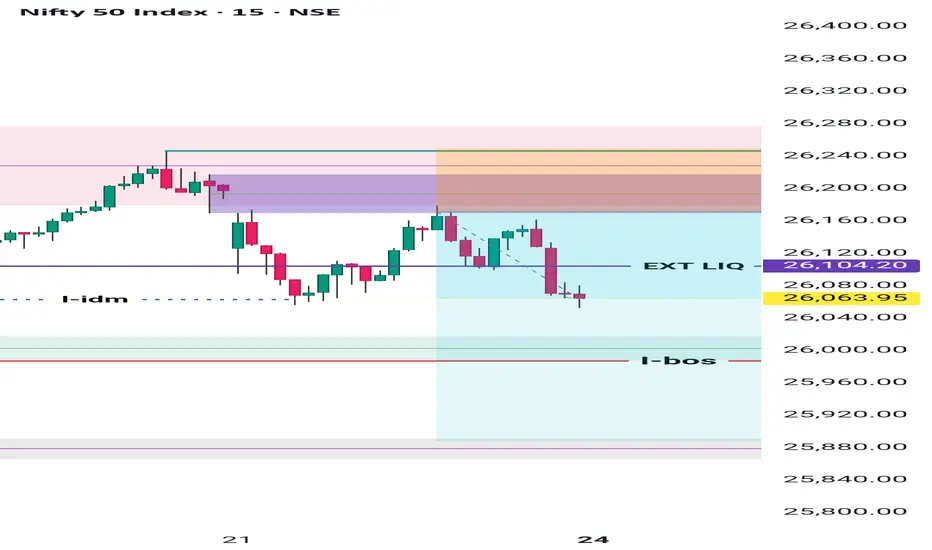
Nifty 50 Structural Analysis [24/11/2025: Monday]Nifty 50 Structural Analysis for 24th of November 2025
Monthly Time Frame Structure:
Green Candle. The trend is upward rising. Back-to-back 3-months positive move. Formation of a Cup-and-handle pattern. Signs of Bullish continuation. Stay bullish.
Weekly Time Frame Structure:
Net bullish week. But there is selling pressure at 26200. The view is bullish to indecisive.
Daily Time Frame Structure:
Selling pressure with a red candle at the top of the trend. We have to remain bullish until level 26000 is decisively breached. Not the time to bet bearish trades yet. Institutional bias (35 EMA) is upward sloping. Bullish trend, but I'm indecisive.
60-Minute Time Frame Structure:
There is selling pressure at the 26200 and 26150 levels. Level 26100 is also becoming a stronger resistance. Level 26000 is a good psychological support point. There is a high chance that the price will touch the 26000 level again. Institutional bias (35 EMA) is bullish to flatish. The view is bullish to indecisive.
30-Minute Time Frame Structure:
Price structure is forming a lower lows and lower highs structure. No sign of taking a bullish trade. Level 26100 is a major resistance, while level 26000 is a major support. Institutional bias (35 EMA) is flat to bearish. Price is in a mean reversion structure. Kind of either flat or downward consolidation. High chance that price will try to reach 100 EMA and 200 EMA. The view is indecisive to bearish.
Trade Condition for Bullish Set-Up:
(i) Price sustains above the opening price.
(ii) Price builds a higher highs and lower lows structure above 26100.
Trade Condition for Bearish Set-Up:
(i) Price sustains below the opening price.
(ii) Price decisively sustains below the level 26000.
No Trading Zone (N.T.Z.):
{ 26100 - 26000 }
Event: No major event. No expiry. But Tuesday is the monthly expiry. Expecting volatility.
Note:
"Mark your points. Trade your points. Price is God. Anything can happen. Therefore, trade what you see, not what you believe."
Happy Trading!

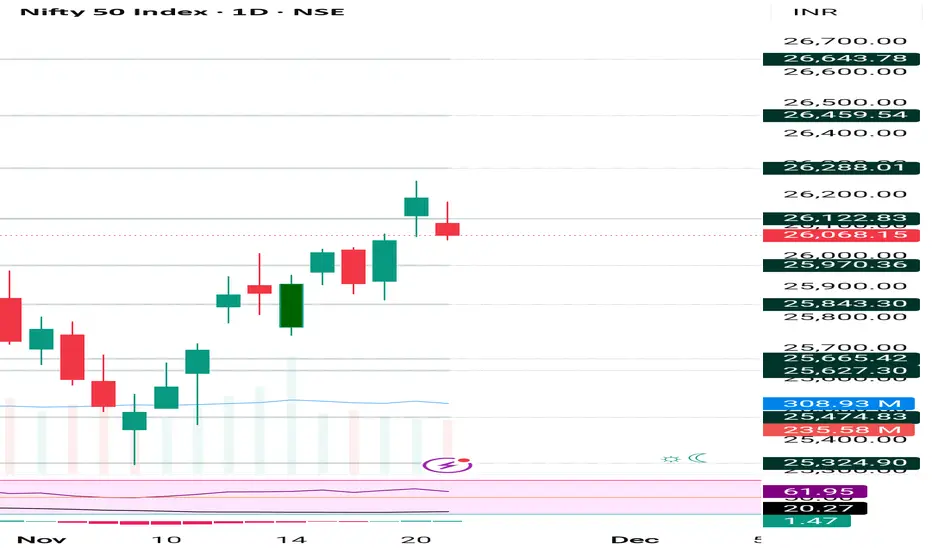
21 Nov 2025 — Nifty’s Long coming to an end? Weekly PostmortemNifty Stance Bullish 🐂
On 12th November, we went bullish after the EMA crossed over. If you observe the price action from 11 AM on 11/11/25 you can notice the massive recovery that came in Nifty.
Even though the EMAs crossed over in the last minute on 11th, the trading system actually gave the signal only during the opening minutes of 12th, Wednesday.
From there, the markets hit a new ATH of 26246 and then cooled off a bit. Actually, we were on track to take out 26400, if we hadn't got that crazy move on S&P500 on 20th Nov. SPX fell 3.49% from its intraday high to intraday low and this really took a toll on Nifty the next day.
Nifty is still long, but the EMAs are converging, which could signal a reversal if we stay flat or drop in points. The nearest supports are at 25906 and 25681, and you may already be aware that we do not have a resistance.

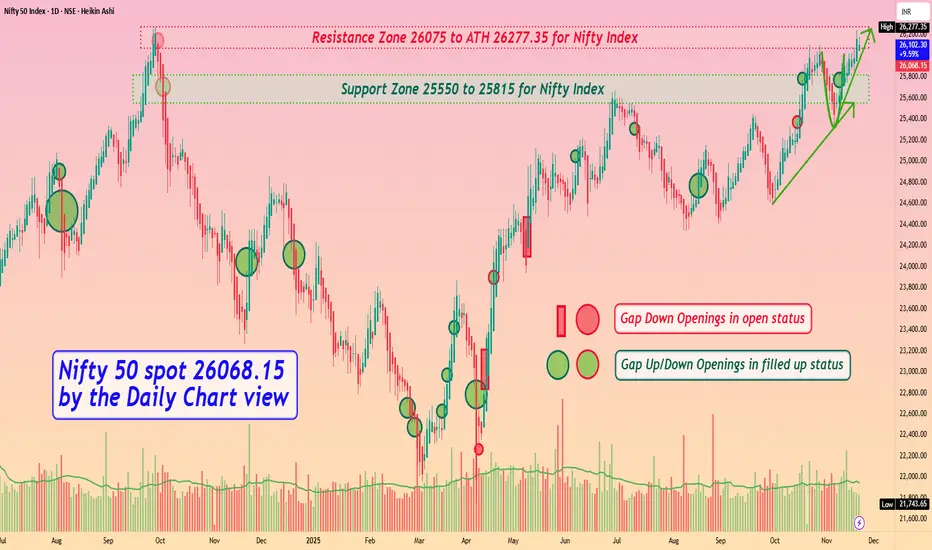
Nifty 50 spot 26068.15 by the Daily Chart view - Weekly updateNifty 50 spot 26068.15 by the Daily Chart view - Weekly update
- Support Zone 25550 to 25815 for Nifty Index
- Resistance Zone 26075 to ATH 26277.35 for Nifty Index
- Nifty keeping off to create ATH by Domestic and Geo Political events
- Bullish momentum intact but general Global paleness keeps New ATH distant
Nifty AI Tool report showing upmove will continue next week Parameters Data
Asset Name : Price 🟥 Nifty Futures (Nov) : 26,074.00
Price Movement 🟩 Upmove will continue to 26,195, 26,270 if break 26,270 then breakout Until 26,000 not break if break then 25,950, 25,850 possible.
Reason 🟩 Strong DII Buying & Put Writing: Strong domestic support aur derivative data mein high Put OI major downside ko limit kar raha hai. 🟥 FII Selling & Global Cues: FIIs ki cash segment mein selling aur mixed global signals upside ko rokte hain.
Confidence 🟩 Bullish 19/30 Bullish , Avoid , Bearish (63.33% score Above 60% hai, isliye Green.)
Probability 🟩 70% Upside/Continuation: Index ka key technical levels aur strong OI support ke upar hold karna bullish trend continuation ka sanket deta hai.
R:R 🟩 Favorable (Upside Potential R2 tak strong hai, SL ₹26,000 ke neeche rakha ja sakta hai.)
FNO Data 🟩 Strong Put Writing & PCR: PCR 1.50 par hai, indicating high bullish conviction.
Liquidity Zones 🟩 Strong Demand Zone: ₹25,950 - ₹26,000 (High Put OI) 🟥 Supply Zone: ₹26,200 - ₹26,270 (Previous Highs / Call Writing)
Max Pain 🟨 25,950 (Nov Expiry)
DEMA Levels 🟩 20 DEMA: ₹26,043 50 DEMA: N/A 100 DEMA: N/A 200 DEMA: N/A 250 DEMA: N/A (Price short-term DEMA ke upar hai, bullish.)
Supports 🟩 S1: ₹26,000 S2: ₹25,950 S3: ₹25,850
Resistances 🟥 R1: ₹26,195 R2: ₹26,270 R3: ₹26,500
ADX/RSI/DMI 🟩 Momentum Positive: RSI (58-60 range mein) positive hai.
Market Depth 🟩 Buy-biased (Overall market structure is bullish)
Volatility 🟨 INDIAVIX: 12.1 (Low/Moderate Volatility)
Source Ledger 🟩 NSE / Investing.com / 5paisa (Verified sources used)
OI 🟩 High OI (Futures) & OI Chg (+4.67%): Long Build-up ka sanket.
PCR 🟩 1.50 (High PCR, strongly Bullish)
VWAP 🟨 Neutral (Price ke aas-paas)
Turnover 🟩 High (High Volume, strong participation)
Harmonic Pattern 🟨 N/A
IV/RV 🟨 IV: 11.3 (ATM IV moderate hai.)
Options Skew 🟩 Bullish Skew: Upside ki options ki demand zyada hai.
Vanna/Charm 🟨 N/A (Advanced Greeks data not available)
Block Trades 🟨 N/A (No immediate major Block Trades reported)
COT Positioning 🟩 Long Heavy (FIIs ka Index Futures mein net long bias (61% long vs 39% short) maintain hai.)
Cross‑Asset Correlation 🟨 Neutral: US Bond Yields se correlation stable hai.
ETF Rotation 🟩 Positive Flow (Domestic Equity ETFs mein strong inflows.)
Sentiment Index 🟩 Cautious Greed
OFI 🟨 N/A (Order Flow Imbalance data not explicitly available)
Delta 🟨 N/A (Options Delta data not explicitly available)
VWAP Bands 🟨 Price near VWAP (Neutral)
Rotation Metrics 🟨 N/A
Nifty Intraday Analysis for 21st November 2025NSE:NIFTY
Index has resistance near 26400 – 26450 range and if index crosses and sustains above this level then may reach near 26650 – 26700 range.
Nifty has immediate support near 26000 – 25950 range and if this support is broken then index may tank near 25800 – 25750 range.
