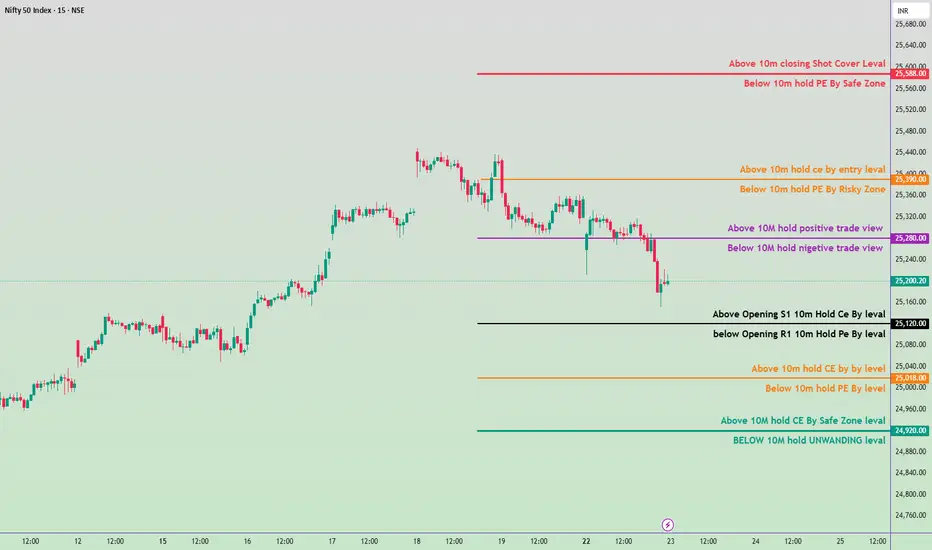
23 sep 2025 Nifty 50 Index with tomorrow’s key levels🔑 Key Levels
25,680 → Above 10m closing Short Cover Level
Below 10m hold PE by Safe Zone
25,390 → Above 10m hold CE by Entry Level
Below 10m hold PE by Risky Zone
25,280 → Above 10m hold Positive Trade View
Below 10m hold Negative Trade View
25,120 → Above Opening S1 10m Hold CE by Level
Below Opening R1 10m Hold PE by Level
25,008 → Above 10m hold CE by Level
Below 10m hold PE by Level
24,920 → Above 10m hold CE by Safe Zone Level
Below 10m hold Unwinding Level
“Stay tuned for more learning – like & follow now!”
INDIA50CFD trade ideas
Nifty Structure Analysis & Trade Plan: 23rd SeptemberBased on the charts and market data from Monday, September 22, the Nifty has experienced a significant correction, breaking below a key support level. The market sentiment has shifted from strongly bullish to cautiously bearish in the short term.
Detailed Market Structure Breakdown
4 Hour Chart (Macro Trend)
Structure: The long-term trend remains bullish, as the index is still trading above its August lows. However, Monday's strong bearish candle, which broke below the rising channel, indicates a significant shift in the immediate trend. The bulls' control has been challenged, and a deeper correction is now more probable.
Key Levels:
Major Supply (Resistance): 25,500-25,600. This level has proven to be a very strong supply zone, rejecting the price on multiple occasions.
Major Demand (Support): The most critical support is the 25,050-25,100 zone. This area, which includes a prior breakout level and a FVG (Fair Value Gap), is now the key "line in the sand" for the long-term bullish trend. A break below this would signal a major trend reversal.
1-Hour Chart (Intermediate View)
Structure: The 1H chart shows a clear MSS (Market Structure Shift) to the downside. The price has broken below the lower trendline of the rising channel and its immediate support, confirming the short-term bearish bias. The index is now making lower highs and lower lows.
Key Levels:
Immediate Resistance: The 25,300 level, which was a strong support, has now become a crucial resistance. Any bounce is likely to be met with selling pressure in this zone.
Immediate Support: The next key support level is the 25,200 mark. This is a psychological level that was tested and broken on Monday. A retest of this level is likely.
15-Minute Chart (Intraday View)
Structure: The 15M chart provides a clearer picture of the intraday fall. The price is showing a small consolidation after the sharp decline. This is likely a pause before the next move.
Key Levels:
Intraday Supply: The 25,250 area, which is the high of the recent consolidation.
Intraday Demand: The low of the recent consolidation and the intraday low, near 25,200.
Outlook: The intraday bias is bearish. The market is likely to continue its downward movement unless it can reclaim the 25,300 resistance level.
Trade Plan: 23rd September
Market Outlook: The market is now in a short-term bearish phase. A "sell on rise" strategy seems more favorable, but a strong reversal from a key support level is also a possibility.
Bearish Scenario (Primary Plan)
Justification: The market has shown a clear change in structure with a breakdown of key levels. The path of least resistance is to the downside.
Entry: Look for a short entry if the price retests the 25,300 level and shows signs of rejection with a bearish candlestick pattern. Alternatively, a breakdown and 15-minute close below 25,200 would trigger a short entry.
Stop Loss (SL): Place a stop loss above 25,350.
Targets:
T1: 25,100 (Next major support).
T2: 25,050 (Psychological level and strong demand zone).
Bullish Scenario (Counter-Trend Plan)
Justification: This is a counter-trend plan and should be approached with caution. It is based on the possibility of a strong bounce from a key support level.
Trigger: A strong bullish reversal candle (e.g., a hammer or engulfing pattern) near the 25,100 - 25,050 demand zone.
Entry: Long entry on a confirmed bounce from the demand zone.
Stop Loss (SL): Below 25,000.
Targets:
T1: 25,250 (Intraday resistance).
T2: 25,400 (Recent swing high).
Key Levels for Observation:
Immediate Decision Point: The 25,200 - 25,300 zone.
Bearish Confirmation: A break and sustained move below 25,200.
Bullish Confirmation: A recapture of the 25,300 level.
Line in the Sand: The 25,050 - 25,100 zone. The overall bullish trend is in jeopardy if this level is decisively broken.
Nifty weekly expiry analysis for 23/09/2025.Nifty has created 3 consecutive red candle on the daily charts and might touch its 20 EMA.
Market is around the All time high levels and chances of profit booking are there.
Today, nifty has closed 125 points lower than the pervious close.
Major Resistance levels :- 25311, 25438
Support levels :- 25094, 25010
On the hourly charts, the market seems to be taking rejection from the hourly 20 ema and it trading between 20 and 50 EMA.
It is trading in a close parallel channel range. If it remains in the range avoid trading or scalp as per the risk appetite.
Though nifty has taking down the 50 EMA and there are chance of it tested the higher moving averages soon.
Tomorrow is nifty weekly expiry. Wait and watch for the price action near the price levels before entering a trade.

Nifty 50 Neowave ForecastHi Everyone
Welcome to intelligent investor, we provide market insights by synchronising and combining all the price action waves from different time frames and gives you single trend.
Thank You
How to Read my charts....Click Below

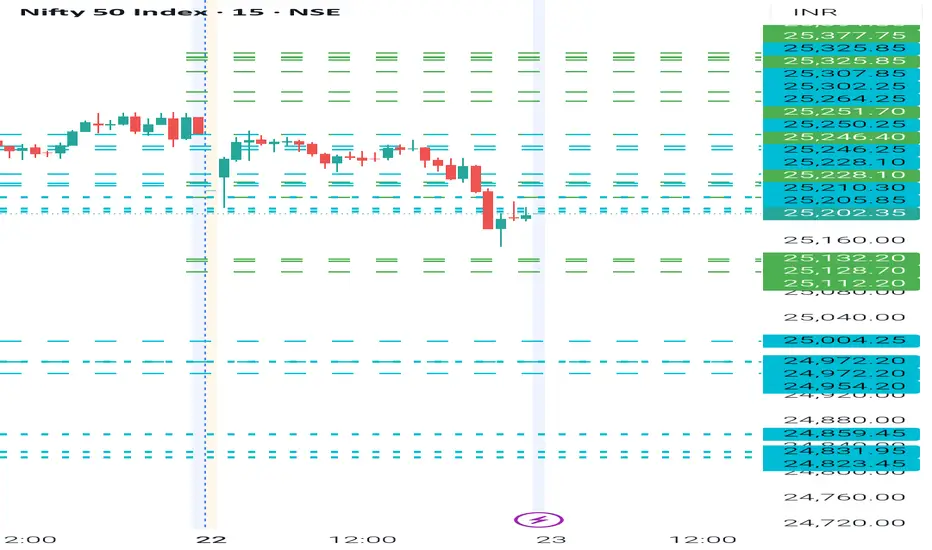
NIFTY- Intraday Levels - 23rd September 2025 weekly expiry If NIFTY sustain above 25205/210/228 above this bullish then 25246/51/64 strong level above this more bullish then 25302/25 then wait
If NIFTY sustain below 25132/128/112 below this bearish below this wait
Consider some buffer points in above levels.
Please do your due diligence before trading or investment.
**Disclaimer -
I am not a SEBI registered analyst or advisor. I does not represent or endorse the accuracy or reliability of any information, conversation, or content. Stock trading is inherently risky and the users agree to assume complete and full responsibility for the outcomes of all trading decisions that they make, including but not limited to loss of capital. None of these communications should be construed as an offer to buy or sell securities, nor advice to do so. The users understands and acknowledges that there is a very high risk involved in trading securities. By using this information, the user agrees that use of this information is entirely at their own risk.
Thank you.
Part 2 Ride The Big Moves 1. How Options Work in Practice
Suppose you buy a call option:
Stock XYZ = ₹200.
Call strike = ₹210.
Premium = ₹5.
Expiry = 1 month.
If the stock rises to ₹230 before expiry:
Profit = (230 – 210) – 5 = ₹15 per share.
If the stock stays below ₹210:
Loss = Premium paid = ₹5.
So the risk is limited to the premium, but the profit can be large.
2. Why Do People Trade Options?
Speculation – Traders use options to bet on price movements with limited risk.
Hedging – Investors buy puts to protect their portfolios (like insurance).
Income Generation – Selling options (like covered calls) can generate steady income.
Leverage – Options allow control of large positions with small amounts of money.
3. Option Buyers vs. Option Sellers
Option Buyer
Pays the premium.
Has rights but no obligation.
Risk is limited to the premium.
Profit potential can be high.
Option Seller (Writer)
Receives the premium.
Has an obligation to buy/sell if the buyer exercises.
Risk can be unlimited (in case of naked options).
Profit is limited to the premium received.
4. Strategies in Option Trading
Options are flexible. Traders combine calls and puts in creative ways to form strategies. Some common ones:
Covered Call – Holding a stock and selling a call against it for extra income.
Protective Put – Buying a put option to protect against downside risk in stocks.
Straddle – Buying both a call and a put at the same strike to profit from big moves either way.
Iron Condor – Selling both a call spread and a put spread to profit from low volatility.
Bull Call Spread – Buying one call and selling another at a higher strike to reduce cost.
Each strategy balances risk and reward differently.
5. Risks in Option Trading
While options are powerful, they also carry risks:
Time Decay – Options lose value as expiry approaches.
Volatility Risk – Options are sensitive to changes in volatility.
Liquidity Risk – Some options have low trading volume, making entry/exit difficult.
Unlimited Loss (for sellers) – A naked call seller can face huge losses if stock rises sharply.
Complexity – Misunderstanding option behavior can lead to unexpected losses.
6. Benefits of Option Trading
Flexibility – You can profit in rising, falling, or sideways markets.
Leverage – Control large exposure with small capital.
Hedging – Protect your portfolio against downside risk.
Defined Risk (for buyers) – Maximum loss is limited to the premium.
Income Opportunities – Selling options can generate consistent returns.

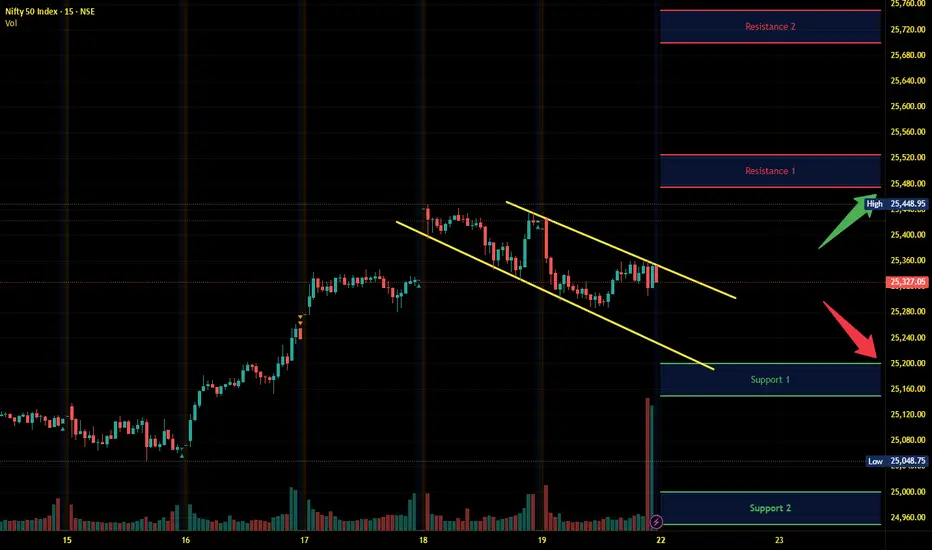
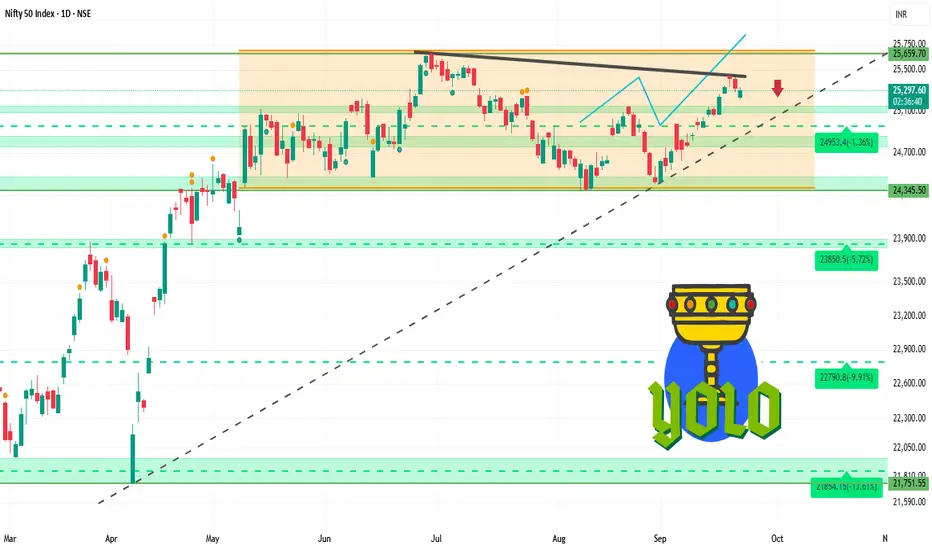
Nifty Intraday Analysis for 22nd September 2025NSE:NIFTY
Index has resistance near 25475 – 25525 range and if index crosses and sustains above this level then may reach near 25700 – 25750 range.
Nifty has immediate support near 25200 – 25150 range and if this support is broken then index may tank near 25000 – 24950 range.
Market specially IT stocks will react to imposition of exorbitant H-1B Visa fee by US and expected to open down.
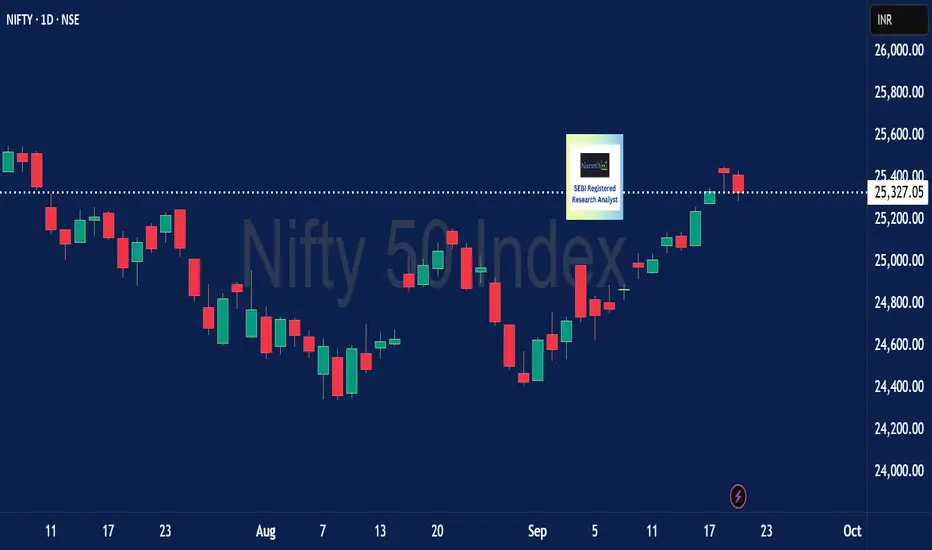
Nifty Weak 25K - 24,800 wont be a Surprise Recap:
💡 View shared on 18th Sep 2025:
Trend is positive & any dip is a buy opportunity.
✅ Strength above 25,430
❌ Weakness below 25,350
⚠️ Cautions near 25,515 - 25650
Actual on 19th Sep 2025
OHLC
25,410 🎯 Strength only above 25,430.00
25,428 🎯 Strength only above 25,430.00
25,286
25,327 🎯 Given Support was 25,350.00
22/09/2025 Nifty View
📌 Last Close: 25,327
🔻 Support: 25,254 - 25,204
🔺 Resistance: 25,340 - 25,426
💡 View:
Trend is seems negative & Gap down opening wont be a surprise.
✅ Strength above 25,460
❌ Weakness below 25,200
⚠️ Stay Cautions in LONG & SHORT - Keep churning to avoid Volatility
👉 Do you find these daily views useful and want to receive them regularly?
If yes, show 👍
Your support motivates us to share more
💡 Liked the idea?
Then don’t forget to Boost 🚀 it!
For more insights & trade ideas,
📲 Visit my profile and hit Follow
Warm regards,
Naresh G
SEBI Registered Research Analyst
💬 Comment below if you want me to analyse any stock for you 🔍
NIFTY 50 INTRADAY ASCENDING CHANNELIn 15 minutes chart nifty 50 reacted,
aal reactions from channel support and resistances are shown in this chart if lower support trend line will not broken by .. then we can expect for reversal and take decision to long otherwise it may continue falling.
I think there is no more to descibe in this chart all the reactions are clearly shown here.
this is not my buy/sell call.

NIFTY 1D Time frame🔍 Current Market Snapshot
Current Level: ₹25,292.45
Day’s Range: ₹25,211.60 – ₹25,331.70
Previous Close: ₹25,327.05
Market Sentiment: Neutral to mildly bearish
📊 Technical Indicators
Moving Averages: The Nifty 50 index is trading slightly below its short-term moving averages, indicating potential resistance.
RSI (14): Approximately 50, suggesting a neutral stance with no clear overbought or oversold conditions.
MACD: Neutral, with the MACD line and signal line close together, indicating indecision in market momentum.
Stochastic Oscillator: Neutral, fluctuating around the midline, reflecting a lack of strong directional movement.
🧮 Strategy / Trade Ideas
Long Setup:
Entry: Consider entering near support levels (~₹25,200) if bullish reversal signals appear.
Stop Loss: Place below ₹24,800 to manage risk.
Target: First resistance around ₹25,400, then ₹25,700.
Short Setup:
Entry: If price fails to break above resistance (~₹25,400) and shows signs of reversal.
Stop Loss: Above ₹25,800.
Target: Downside toward ₹25,200, then ₹24,900.
Nifty at support I can't expect a fall from here , there is no trade setup but If we plan buy on dips still we can make some pocket money. Disclaimer - for info and education purpose only

NIFTY KEY LEVELS FOR 22.09.2025NIFTY KEY LEVELS FOR 22.09.2025
RTF: 3 Minutes
If the candle stays above the pivot point, it is considered a bullish bias; if it remains below, it indicates a bearish bias. Price may reverse near Resistance 1 or Support 1. If it moves further, the next potential reversal zone is near Resistance 2 or Support 2. If these levels are also broken, we can expect the trend.
When a support or resistance level is broken, it often reverses its role; a broken resistance becomes the new support, and a broken support becomes the new resistance.
If the range(R2-S2) is narrow, the market may become volatile or trend strongly. If the range is wide, the market is more likely to remain sideways
please like and share my idea if you find it helpful
📢 Disclaimer
I am not a SEBI-registered financial adviser.
The information, views, and ideas shared here are purely for educational and informational purposes only. They are not intended as investment advice or a recommendation to buy, sell, or hold any financial instruments.
Please consult with your SEBI-registered financial advisor before making any trading or investment decisions.
Trading and investing in the stock market involves risk, and you should do your own research and analysis. You are solely responsible for any decisions made based on this research.

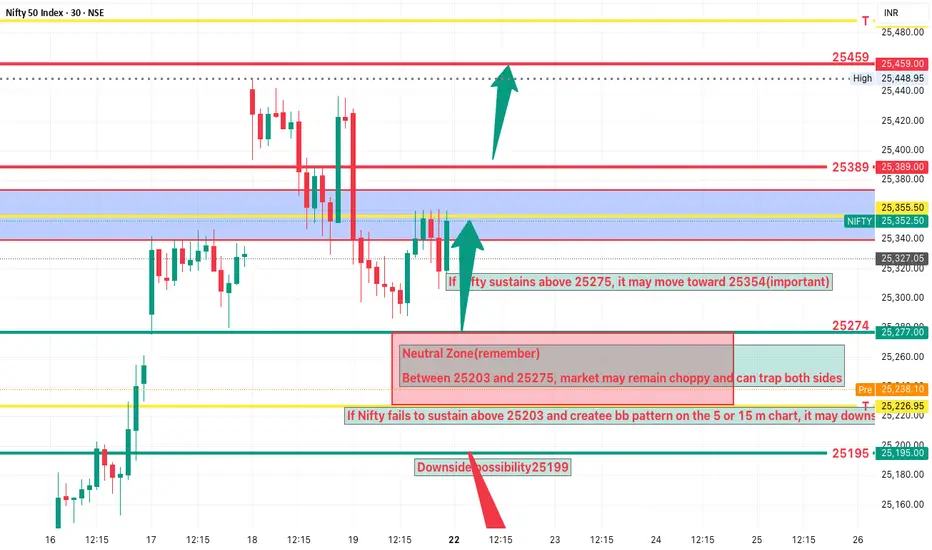
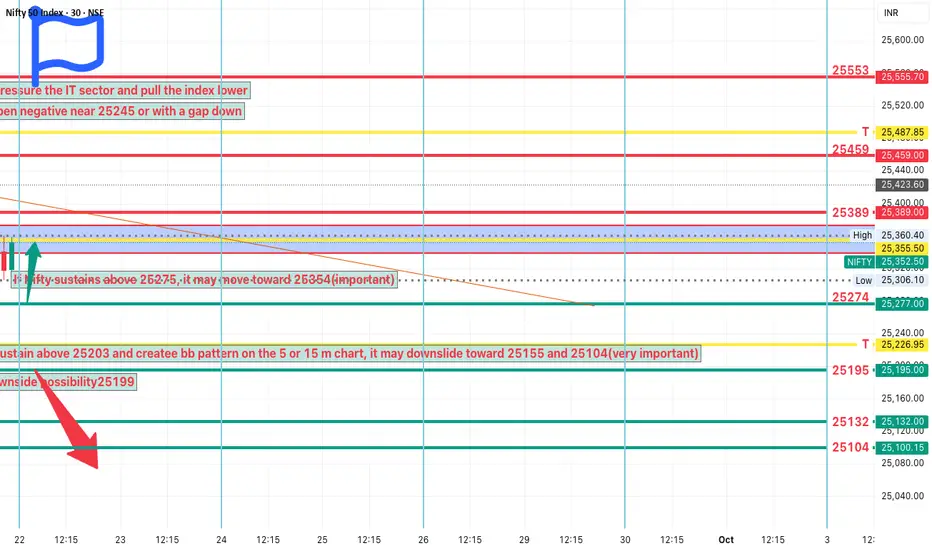
NIFTY Analysis 22 SEPTEMBER, 2025 ,Daily Morning update at 9 am25203–25275 is a no-trade zone, wait for breakout or breakdown confirmation.
If market opens with a gap down near 25245, observe whether it sustains above 25275 for recovery or slips below 25203 for weakness.
intraday Bearish Setup
If Nifty opens near 25245 and trades below 25203, watch for downside targets at 25155 and 25104.
IT sector weakness can add pressure.
Intraday Bullish Setup
If Nifty reclaims and sustains above 25275, upside targets are 25354 and 25389.
Sustaining above 25389 may open the next level at 25459
NIFTY Analysis 22 SEPTEMBER, 2025 ,Daily Morning update at 9 amREAD CAREFULLY EVERY WORD
intraday Bearish Setup
If Nifty opens near 25245 and trades below 25203, watch for downside targets at 25155 and 25104.
IT sector weakness can add pressure
Intraday Bullish Setup
If Nifty reclaims and sustains above 25275, upside targets are 25354 and 25389
Sustaining above 25389 may open the next level at 25459
Neutral Zone
Between 25203 and 25275, market may remain choppy and can trap both sides.
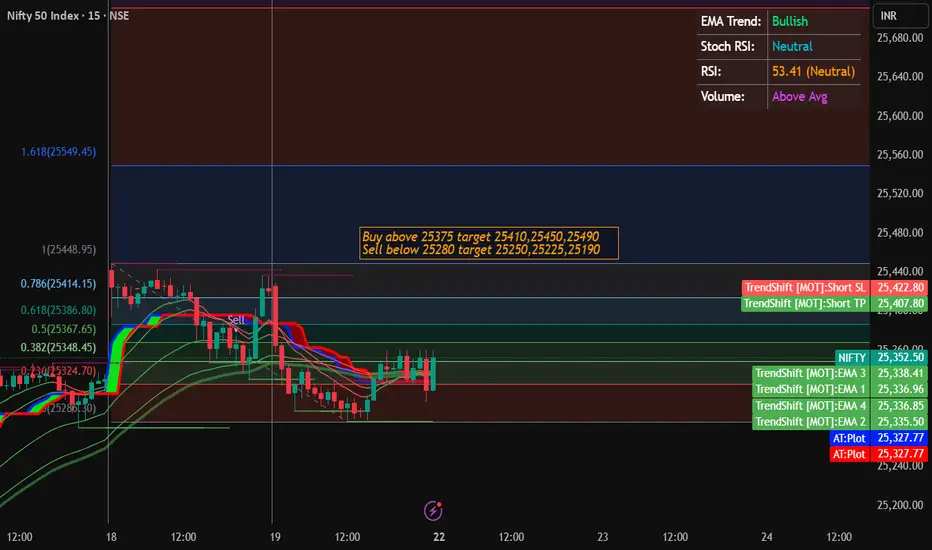
Nifty Trading Strategy for 22nd September 2025📊 NIFTY TRADING STRATEGY (15-Minute Chart)
🟢 BUY SETUP – Step by Step
🔍 Condition to Enter a Buy Trade:
Watch the 15-minute chart.
If a 15-min candle closes above 25,375, buying opportunity is created.
Remember ✅ The candle must close above 25,375, not just touch it.
🚀 Buy Entry Point:
Enter a Buy trade slightly above the high of that candle.
This confirms that the bullish momentum is strong.
🎯 Profit Targets for Buy Trade:
🎯 Target 1: 25,410 → Small & quick profit booking.
🎯 Target 2: 25,450 → Moderate profit level.
🎯 Target 3: 25,490 → Extended bullish target.
🛑 Stop Loss (SL):
Place SL just below the low of the breakout candle.
This limits your losses if market reverses.
🔴 SELL SETUP – Step by Step
🔍 Condition to Enter a Sell Trade:
Watch the 15-minute chart.
If a 15-min candle closes below 25,280, selling opportunity is created.
Important ✅ Enter only after candle closes below 25,280.
📉 Sell Entry Point:
Enter a Sell trade slightly below the low of that candle.
This ensures bearish momentum is valid.
🎯 Profit Targets for Sell Trade:
🎯 Target 1: 25,250 → Initial safe profit.
🎯 Target 2: 25,225 → Second level profit.
🎯 Target 3: 25,190 → Extended bearish move.
🛑 Stop Loss (SL):
Place SL just above the high of the breakdown candle.
Protects you from sudden upward reversal.
📌 Risk Management & Trading Tips for Beginners
✅ Start Small: Don’t use all your capital in one trade.
✅ Risk Limit: Risk only 1–2% of total capital per trade.
✅ Be Patient: Wait for candle close confirmation (don’t jump in early).
✅ Use SL Strictly: Stop-loss saves your account from big losses.
✅ Trail Profits: As price hits targets, move SL in profit direction.
⚠️ Disclaimer
📢 This strategy is for educational purposes only.
📢 It is not financial advice or a guaranteed way to earn profits.
📢 Stock market & index trading involves high risk.
📢 Do your own analysis and consult a financial advisor before trading.
✨ Pro Tip for Novices:
Mark the important levels → 25,375 (Buy Zone) and 25,280 (Sell Zone).
Use a clean chart (15-min timeframe).
Don’t overtrade — one good trade is better than 5 random trades.
NIFTY Levels for Today
Here are the NIFTY's Levels for intraday (in the image below) today. Based on market movement, these levels can act as support, resistance or both.
Please consider these levels only if there is movement in index and 15m candle sustains at the given levels. The SL (Stop loss) for each BUY trade should be the previous RED candle below the given level. Similarly, the SL (Stop loss) for each SELL trade should be the previous GREEN candle above the given level.
Note: This idea and these levels are only for learning and educational purpose.
Your likes and boosts gives us motivation for continued learning and support.
#NIFTY Intraday Support and Resistance Levels - 22/09/2025Nifty, a slightly gap-down opening is expected near the 25,300–25,350 zone. On the upside, sustaining above 25,250–25,300 can fuel bullish momentum toward 25,350, 25,400, and 25,450+. A breakout above 25,500 will strengthen the uptrend, paving the way for higher levels around 25,650–25,750+.
On the downside, immediate support lies at 25,200–25,150. A breakdown below this zone may invite selling pressure, dragging the index lower toward 25,100, 25,050, and 25,000-. Strong support is placed around 25,000, and a decisive break below that could extend weakness further.
Overall, Nifty is showing range-bound action with a slight bearish bias in early trade, but a sustained move above 25,300 will keep the bullish momentum intact. Traders should wait for confirmation at key levels and manage positions with strict stop-losses.

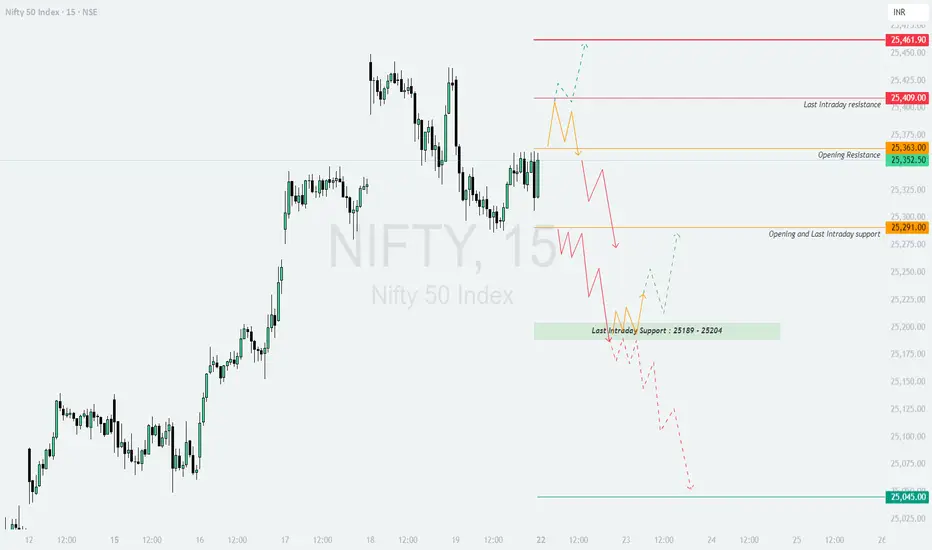
NIFTY : Trading levels and Plan for 22-Sep-2025NIFTY TRADING PLAN – 22-Sep-2025
The index closed around 25,352, with immediate opening resistance at 25,363, and higher hurdles near 25,409 (last intraday resistance) and 25,461. On the downside, supports are placed at 25,291 (opening/last intraday support) and the 25,189–25,204 zone. The critical lower support is seen at 25,045.
Considering a gap opening threshold of 100+ points, let’s break down the intraday scenarios:
🚀 Gap Up Opening (100+ points above previous close)
If Nifty opens strongly above 25,450–25,461, it will enter a bullish zone.
Sustaining above 25,461 can fuel momentum towards 25,525–25,600. Option traders can look for call buying opportunities with strict stop-losses.
However, if rejection candles appear near 25,461, profit booking may drag Nifty back towards 25,409–25,363. This would offer a counter-trade opportunity for cautious intraday shorting.
Risk control is essential here: wait for 15–30 minutes confirmation after gap-ups to avoid false breakouts.
⚖️ Flat Opening (near 25,300–25,350 zone)
If Nifty opens flat, then 25,363 (resistance) and 25,291 (support) become immediate reference points.
A decisive breakout above 25,363 can push prices towards 25,409 and further to 25,461. Sustaining beyond this level confirms bullish continuation.
On the other hand, if Nifty fails to cross 25,363 and slips below 25,291, then weakness may extend towards 25,189–25,204 zone.
This setup is best suited for breakout traders who can wait for price confirmation before entering directional trades.
📉 Gap Down Opening (100+ points below previous close)
If Nifty opens sharply below 25,200, it will test the last intraday support zone of 25,189–25,204.
A bounce from this zone can trigger a quick pullback rally towards 25,291–25,363.
But if the index sustains below 25,189, then deeper downside towards 25,045 becomes highly probable. In such a case, put options could provide high reward trades, but strict stop-loss is a must since sharp pullbacks often occur at key supports.
🛡️ Risk Management & Option Trading Tips
Always allow the first 15–30 minutes to set direction before entering.
Use hourly candle close as confirmation for breakout trades.
In gap scenarios, avoid aggressive chasing; instead, wait for retests of key levels.
Maintain at least a 1:2 risk-reward ratio for consistency.
Limit position sizing in options as premiums erode quickly due to time decay.
📌 Summary & Conclusion
Above 25,461, Nifty may head towards 25,525–25,600 🚀.
Flat openings will keep focus on 25,363 (resistance) and 25,291 (support) ⚖️.
Below 25,189, bearish momentum may extend towards 25,045 📉.
Patience and disciplined execution around these levels can provide the best trading opportunities.
⚠️ Disclaimer
I am not a SEBI-registered analyst. This analysis is purely for educational purposes. Please consult with your financial advisor before making any trading decisions.
Index Funds vs ETFs – Which is Better for Retail Investors?Hello Traders!
When it comes to passive investing, two options always come up, Index Funds and ETFs (Exchange Traded Funds) .
Both track an index like Nifty or Sensex, but the way they work is different.
Let’s break them down so you know which one suits you better.
1. What are Index Funds?
Index funds are mutual funds that replicate a market index like Nifty 50.
You can invest directly through SIP or lump sum, just like other mutual funds.
They don’t trade on the stock exchange; instead, you buy/sell via the fund house.
NAV is calculated once a day, you get units at that day’s NAV.
2. What are ETFs?
ETFs also track an index like Nifty or BankNifty, but they trade like stocks on the exchange.
You need a demat account to buy/sell ETFs.
You can trade them intraday, just like shares.
Price changes throughout the day as they trade live in the market.
3. Key Differences You Must Know
Liquidity: ETFs depend on exchange volumes. Index funds are more stable since you transact with the AMC.
Ease of Use: Index funds are simpler for beginners (no demat needed). ETFs suit traders who want flexibility.
Costs: ETFs usually have lower expense ratios, but you pay brokerage. Index funds may have slightly higher costs but no brokerage.
Investment Style: Index funds are great for long-term SIPs. ETFs are better for those who want intraday liquidity or tactical entries.
Rahul’s Tip:
If you’re just starting and prefer SIPs without worrying about trading, go for index funds.
If you’re comfortable with demat and want real-time flexibility, ETFs give you more control.
Conclusion:
Index funds and ETFs both are powerful tools for retail investors.
The “better” choice depends on your style, simple and steady with index funds, or flexible and active with ETFs.
This educational idea By @TraderRahulPal (TradingView Moderator) | More analysis & educational content on my profile
If this post made the difference clear for you, like it, drop your choice in comments, and follow for more simple investing insights!
19 Sep 2025 - Nifty's long stance has given an incredible 448ptsNifty Stance Bullish 🐂
My last post-mortem report was on September 6th, as I was unable to send out the reports last week due to a personal engagement. Meanwhile, nothing significant happened that week, as the long-only stance remains valid.
The last crossover was on September 4th, and from then on, we had only a one-way trend, i.e., long-only. The points in unrealized profits = 448pts. As you know, we book profits/loss when the trend reverses direction, so as per the chart above, we require the yellow line (Fast EMA) to cut the blue line (Slow EMA) for bookings.
As it stands, even if the market falls badly on Monday, the bookings will still come at a profit. Technically, the yellow line widening out from the blue shows an accelerating trend, and if it's narrowing down, it means the trend is fading out.
A lot of macroeconomic news is coming in between that could create a whipsaw in the short term. It is best recommended to ride out the wave with a smaller position until we digest the trustworthy news instead of rumors.
The nearest support levels are 25219, 25003 and 24931. The nearest resistance is 25681. If we reverse the trend, I will let you know via the TradingView minds section. Be sure you are following to get my email or notifications.

Nifty50 - Set to March towards 30KNifty is showing strong bullish momentum backed by multiple signals
Trendline Breakout from consolidation
Cup & Handle Formation indicating continuation
Three White Soldiers Candles
Reversal from Crucial Support near 24,300
Multi-Timeframe Alignment (Daily, 4H, Weekly)
Entry: 25,670
With strong confluence of bullish signals, Nifty50 looks set to march towards the 30K in Next 5-6 Months

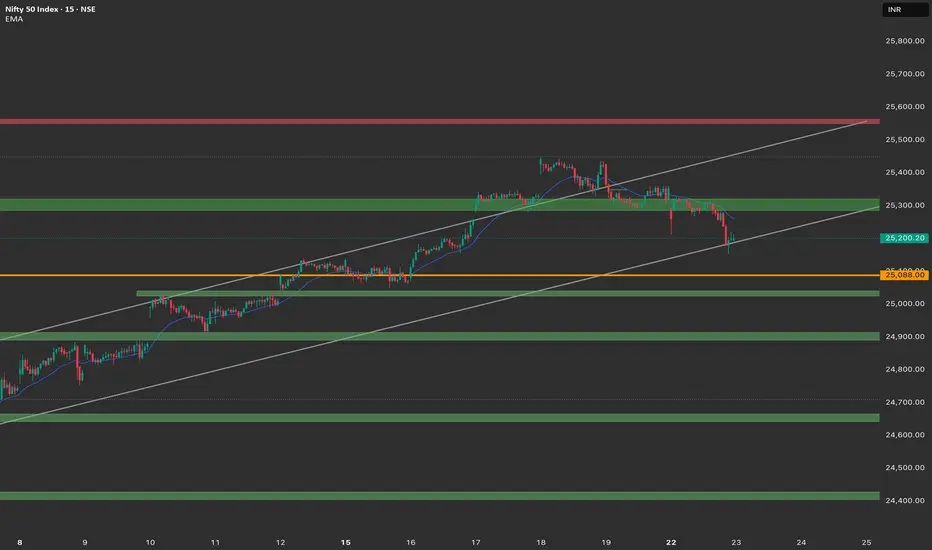
Nifty - Weekly Analysis Sep 22 - Sep 26The price is moving within a channel and is testing an important support level at 25350. It can give good movement by sustaining above 25350.
Buy above 25350 with the stop loss of 25290 for the targets 25400, 25460, 25500, 25560, 25620, 25680, and 25740.
Sell below 25240 with the stop loss of 25280 for the targets 25200, 25160, 25100, 25040, 25000, 24960, and 24920.
As per the hour chart, 25300 is a strong support. Any strength around this level can make the price to move towards 25800.
Always do your analysis before taking any trade.

Understanding SQRT in Stock Indexes (NIFTY)SQRT plays a key role in financial modeling for stock indexes—particularly in volatility scaling (via the "square root of time" rule) and price prediction (via the Square Root Theory). It's not used directly in calculating the index value itself (e.g., market-cap weighting), but in analyzing and forecasting index behavior.
I'll break it down step-by-step, with examples in this video.
