Nifty - 150 number LogicSir/Mam,
The market specially options are very hard to book profits as we have to be very clever of the NUMBERS GAME - 150
Let me make it clear as we all know the Nifty closing 26068.15. We need to keep 26050 CE and PE in your watchlist. Buy when both calculated value comes 150 or below (CE + PE) for e.g. now it is - 116+92 = 208 wait until it comes near - 150. Maybe it will come on Monday or Tuesday, you will have chunk of profit of sure.
Option trading is just a number which we need to capture it perfectly. The chart is just to make traders distract from the fear of upside or downside. The real trading is in the value which you buy and sell.
Agree that some make profit and loss. But when you have the correct number caught up then it is hard to get loss in it.
Now let's jump to Chart what we can visualize from that is,
26200 - Sell Zone
26050 - Not to Trade Zone
25900 - Support Zone
The above is levels where all traders get panic. So, we have to be smart to buy CE and PE as discussed above. When market comes to that level the values changed horribly as the value keep on changing to know the interest of the buyers and sellers at this point only levels get running upside or downside.
Sharing this idea, which is beyond logic, but this is best way to earn profit and to stay in Option Trading for coming days.
Hope you will like this idea.
Thanks for taking time.
Trade ideas

Crucial weeks ahead - NIFTYNIFTY seems to be retesting its ATH zones with the Q3 looming near , we can expect some interesting movements happening in the market. Trade/invest with caution :)

NIFTY- VCP BreakoutThe Setup: Low-Risk Launchpad
The Nifty 50 Index has formed the Volatility Contraction Pattern (VCP) at its all-time high. A strong close above the pivot is required for further trend confirmation.
VCP Structure: The index formed a large base (similar to a Cup-with-Handle) that demonstrated several phases of tightening volatility, culminating in a very tight, low-risk consolidation (the final VCP/Handle) just below the ₹26,282 pivot.
Breakout Confirmation: The price has decisively cleared the ₹26,000 resistance, and the subsequent minor consolidation is occurring above this pivot, confirming the former resistance as new strong support.
Structural Health: The index remains above all rising major moving averages, indicating exceptional underlying strength and institutional control.
The Strategy
The primary strategy is to maintain a bullish bias and use minor pullbacks as opportunities to add to leading stocks.
Actionable Zone: The current consolidation area, just above the ₹26,282 breakout level, is the re-entry window.
Continuation Pivot: A decisive weekly close above ₹26,068 (the recent high) would signal the acceleration of the momentum.
Risk Management: The immediate risk point is the breakdown of the former pivot. Place a structural stop for market hedges or portfolio risk management below ₹25,250 - ₹25,500.
Conclusion
The Nifty 50 is technically poised for sustained upside into new price discovery territory, with the VCP breakout providing strong conviction in the continuation of the primary trend.

Part 8 Trading Master Class With ExpertsOptions Trading Styles in Markets
1. Intraday Option Trading
Fast movements
High leverage
Requires quick decision-making
2. Positional Options Trading
Holding for days or weeks
Less stressful than intraday
3. Weekly Expiry Trading (India-specific)
NIFTY & BANK NIFTY weekly options
Very popular among retail traders
Weekly options bring rapid time decay, which benefits option sellers but hurts buyers.

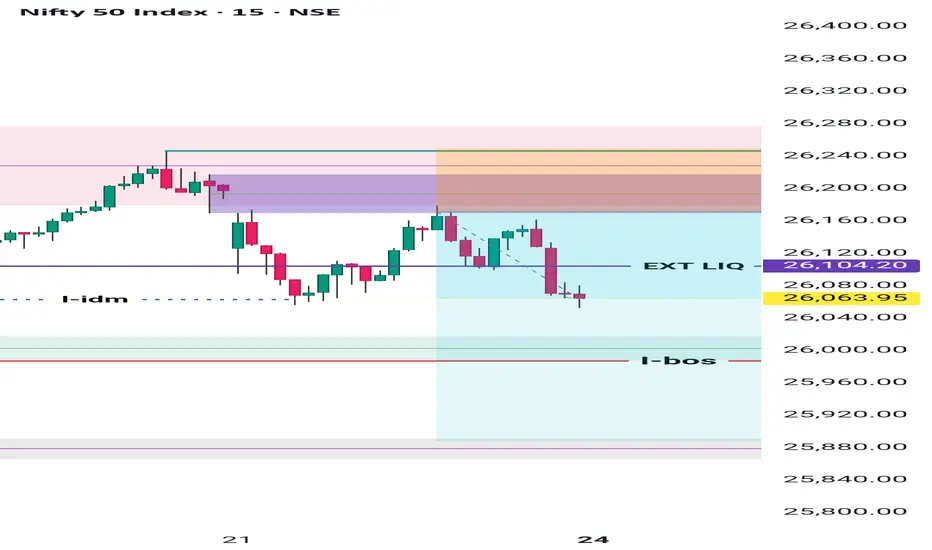
Nifty in corrective zoneWell as per proce action and ICT..there is a short correction may appear Tommorow n further for few days..as per my analysis it may take exterior liquidity and then may continue to bullish form and make a new high and shift structure to bullish side
Nifty 50 Structural Analysis [24/11/2025: Monday]Nifty 50 Structural Analysis for 24th of November 2025
Monthly Time Frame Structure:
Green Candle. The trend is upward rising. Back-to-back 3-months positive move. Formation of a Cup-and-handle pattern. Signs of Bullish continuation. Stay bullish.
Weekly Time Frame Structure:
Net bullish week. But there is selling pressure at 26200. The view is bullish to indecisive.
Daily Time Frame Structure:
Selling pressure with a red candle at the top of the trend. We have to remain bullish until level 26000 is decisively breached. Not the time to bet bearish trades yet. Institutional bias (35 EMA) is upward sloping. Bullish trend, but I'm indecisive.
60-Minute Time Frame Structure:
There is selling pressure at the 26200 and 26150 levels. Level 26100 is also becoming a stronger resistance. Level 26000 is a good psychological support point. There is a high chance that the price will touch the 26000 level again. Institutional bias (35 EMA) is bullish to flatish. The view is bullish to indecisive.
30-Minute Time Frame Structure:
Price structure is forming a lower lows and lower highs structure. No sign of taking a bullish trade. Level 26100 is a major resistance, while level 26000 is a major support. Institutional bias (35 EMA) is flat to bearish. Price is in a mean reversion structure. Kind of either flat or downward consolidation. High chance that price will try to reach 100 EMA and 200 EMA. The view is indecisive to bearish.
Trade Condition for Bullish Set-Up:
(i) Price sustains above the opening price.
(ii) Price builds a higher highs and lower lows structure above 26100.
Trade Condition for Bearish Set-Up:
(i) Price sustains below the opening price.
(ii) Price decisively sustains below the level 26000.
No Trading Zone (N.T.Z.):
{ 26100 - 26000 }
Event: No major event. No expiry. But Tuesday is the monthly expiry. Expecting volatility.
Note:
"Mark your points. Trade your points. Price is God. Anything can happen. Therefore, trade what you see, not what you believe."
Happy Trading!

21 Nov 2025 — Nifty’s Long coming to an end? Weekly PostmortemNifty Stance Bullish 🐂
On 12th November, we went bullish after the EMA crossed over. If you observe the price action from 11 AM on 11/11/25 you can notice the massive recovery that came in Nifty.
Even though the EMAs crossed over in the last minute on 11th, the trading system actually gave the signal only during the opening minutes of 12th, Wednesday.
From there, the markets hit a new ATH of 26246 and then cooled off a bit. Actually, we were on track to take out 26400, if we hadn't got that crazy move on S&P500 on 20th Nov. SPX fell 3.49% from its intraday high to intraday low and this really took a toll on Nifty the next day.
Nifty is still long, but the EMAs are converging, which could signal a reversal if we stay flat or drop in points. The nearest supports are at 25906 and 25681, and you may already be aware that we do not have a resistance.

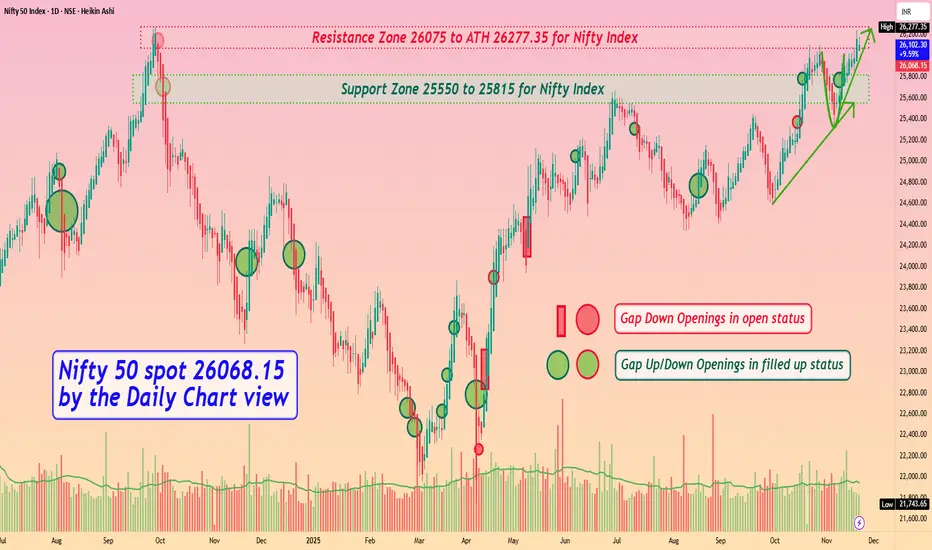
Nifty 50 spot 26068.15 by the Daily Chart view - Weekly updateNifty 50 spot 26068.15 by the Daily Chart view - Weekly update
- Support Zone 25550 to 25815 for Nifty Index
- Resistance Zone 26075 to ATH 26277.35 for Nifty Index
- Nifty keeping off to create ATH by Domestic and Geo Political events
- Bullish momentum intact but general Global paleness keeps New ATH distant
Nifty AI Tool report showing upmove will continue next week Parameters Data
Asset Name : Price 🟥 Nifty Futures (Nov) : 26,074.00
Price Movement 🟩 Upmove will continue to 26,195, 26,270 if break 26,270 then breakout Until 26,000 not break if break then 25,950, 25,850 possible.
Reason 🟩 Strong DII Buying & Put Writing: Strong domestic support aur derivative data mein high Put OI major downside ko limit kar raha hai. 🟥 FII Selling & Global Cues: FIIs ki cash segment mein selling aur mixed global signals upside ko rokte hain.
Confidence 🟩 Bullish 19/30 Bullish , Avoid , Bearish (63.33% score Above 60% hai, isliye Green.)
Probability 🟩 70% Upside/Continuation: Index ka key technical levels aur strong OI support ke upar hold karna bullish trend continuation ka sanket deta hai.
R:R 🟩 Favorable (Upside Potential R2 tak strong hai, SL ₹26,000 ke neeche rakha ja sakta hai.)
FNO Data 🟩 Strong Put Writing & PCR: PCR 1.50 par hai, indicating high bullish conviction.
Liquidity Zones 🟩 Strong Demand Zone: ₹25,950 - ₹26,000 (High Put OI) 🟥 Supply Zone: ₹26,200 - ₹26,270 (Previous Highs / Call Writing)
Max Pain 🟨 25,950 (Nov Expiry)
DEMA Levels 🟩 20 DEMA: ₹26,043 50 DEMA: N/A 100 DEMA: N/A 200 DEMA: N/A 250 DEMA: N/A (Price short-term DEMA ke upar hai, bullish.)
Supports 🟩 S1: ₹26,000 S2: ₹25,950 S3: ₹25,850
Resistances 🟥 R1: ₹26,195 R2: ₹26,270 R3: ₹26,500
ADX/RSI/DMI 🟩 Momentum Positive: RSI (58-60 range mein) positive hai.
Market Depth 🟩 Buy-biased (Overall market structure is bullish)
Volatility 🟨 INDIAVIX: 12.1 (Low/Moderate Volatility)
Source Ledger 🟩 NSE / Investing.com / 5paisa (Verified sources used)
OI 🟩 High OI (Futures) & OI Chg (+4.67%): Long Build-up ka sanket.
PCR 🟩 1.50 (High PCR, strongly Bullish)
VWAP 🟨 Neutral (Price ke aas-paas)
Turnover 🟩 High (High Volume, strong participation)
Harmonic Pattern 🟨 N/A
IV/RV 🟨 IV: 11.3 (ATM IV moderate hai.)
Options Skew 🟩 Bullish Skew: Upside ki options ki demand zyada hai.
Vanna/Charm 🟨 N/A (Advanced Greeks data not available)
Block Trades 🟨 N/A (No immediate major Block Trades reported)
COT Positioning 🟩 Long Heavy (FIIs ka Index Futures mein net long bias (61% long vs 39% short) maintain hai.)
Cross‑Asset Correlation 🟨 Neutral: US Bond Yields se correlation stable hai.
ETF Rotation 🟩 Positive Flow (Domestic Equity ETFs mein strong inflows.)
Sentiment Index 🟩 Cautious Greed
OFI 🟨 N/A (Order Flow Imbalance data not explicitly available)
Delta 🟨 N/A (Options Delta data not explicitly available)
VWAP Bands 🟨 Price near VWAP (Neutral)
Rotation Metrics 🟨 N/A
Nifty Intraday Analysis for 21st November 2025NSE:NIFTY
Index has resistance near 26400 – 26450 range and if index crosses and sustains above this level then may reach near 26650 – 26700 range.
Nifty has immediate support near 26000 – 25950 range and if this support is broken then index may tank near 25800 – 25750 range.

Nifty Technical view 21-11-2025
- Market open gap down, wait for price action.
- Took sell side trade after IRL breakdown, but there
was a trap. hit stoploss.
- wait for price traded premium zone OR break IRH.
- After 13:05 market form FTC , took sell side trade . wait with 38+ points.
-Market retest again and form a DT. took sell side trade and got good return. took trade with RSI combination to confirm bearish divergence.
thats it for today.

Nifty Technical view 21-11-2025Nifty Technical view 21-11-2025
- Market open gap down, wait for price action.
- Took sell side trade after IRL breakdown, but there
was a trap. hit stoploss.
- wait for price traded premium zone OR break IRH.
- After 13:05 market form FTC , took sell side trade . wait with 38+ points.
-Market retest again and form a DT. took sell side trade and got good return. took trade with RSI combination to confirm bearish divergence.
thats it for today.

Nifty Big update ready for buy tgt 30900if nifty close above 26300 for 2days then entry for fresh buying and tgt is 30900 for positional
please maintain stoploss 25300

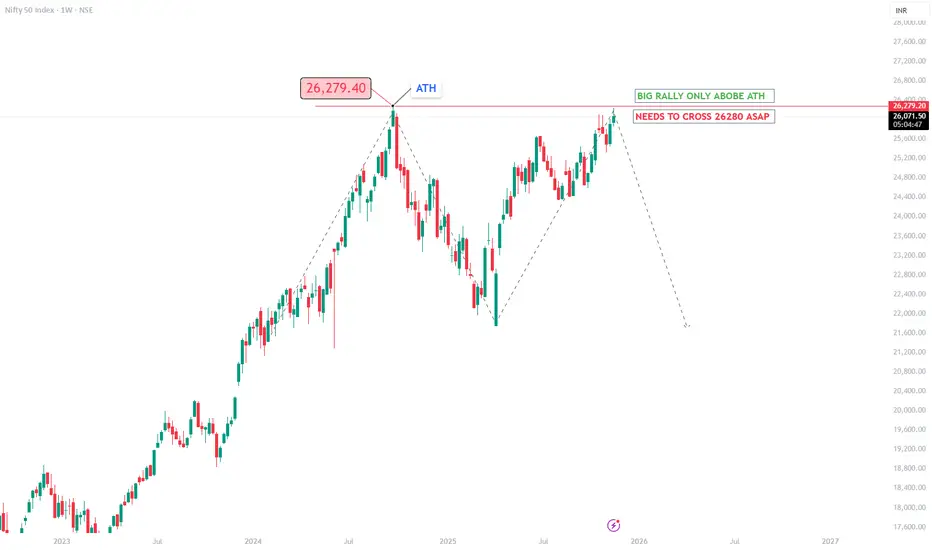
NIFTY 50 – At the Doorstep of ATH RESISTANCE📈 NIFTY 50 – At the Doorstep of ATH Resistance | Make of Break Levels
🧠 Educational Analysis
NIFTY 50 is once again testing its All-Time High (ATH) zone around 26,279.
This level has acted as a major ceiling in the past, triggering a large correction previously.
Currently, price has retraced back into this crucial level after forming a higher structural swing, showing significant buying strength.
However, no major breakout can be confirmed until NIFTY closes decisively above 26,280.
This chart serves as a clear example of how markets behave around psychological levels and previous ATH zones.
🔍 Technical Highlights
26,279 – All-Time High (ATH) & will act as Strong resistance zone where sellers previously pushed price down sharply.
Big Rally can begin only above ATH, as marked on the chart.
Dotted Path Downside Demonstrates possible retracement path if NIFTY fails to break ATH.
📘 Educational Purpose
This chart is shared only for educational analysis, to illustrate:
How ATH zones act as major decision points
How markets create two-sided scenarios (breakout vs. rejection)
How higher-timeframe structures influence trend continuation
Learners can use this as a real-world study of structure, ATH behavior, and confirmation setups.
⚠️ Disclaimer
This analysis is not financial advice.
All observations are shared purely for technical education and learning purposes.
Always do your own research or consult a financial advisor before making any trading decisions.
Nifty sell trade logic !Nifty sell side trade reason behind it:
*Nifty open gap down, so my todays plan was sell. but when to sell
-- After market open it goes up like rocket.
-- i want structure shift in smller time frame.
-- In 1 min time frame i got it near 09:39 and i need to slight pullback in FVA and -ve poi there.
-- Bearish rejection candle give us chance to trade with good R:R, stop loss must required. bz market mere bolne se nahi chalta. so i need to put sl.
-- As u know target would be swing low.
--And we got target luckillly...

NIFTY KEY LEVELS FOR 21.11.2025NIFTY KEY LEVELS FOR 21.11.2025
Timeframe: 3 Minutes
If the candle stays above the pivot point, it is considered a bullish bias; if it remains below, it indicates a bearish bias. Price may reverse near Resistance 1 or Support 1. If it moves further, the next potential reversal zone is near Resistance 2 or Support 2. If these levels are also broken, we can expect the trend.
When a support or resistance level is broken, it often reverses its role; a broken resistance becomes the new support, and a broken support becomes the new resistance.
If the range(R2-S2) is narrow, the market may become volatile or trend strongly. If the range is wide, the market is more likely to remain sideways
please like and share my idea if you find it helpful
📢 Disclaimer
I am not a SEBI-registered financial adviser.
The information, views, and ideas shared here are purely for educational and informational purposes only. They are not intended as investment advice or a recommendation to buy, sell, or hold any financial instruments.
Please consult with your SEBI-registered financial advisor before making any trading or investment decisions.
Trading and investing in the stock market involves risk, and you should do your own research and analysis. You are solely responsible for any decisions made based on this research.

#NIFTY Intraday Support and Resistance Levels - 21/11/2025Nifty is expected to open flat today, indicating a neutral start without any immediate directional push. A sustained move above the 26050–26100 zone will activate the long setup, aiming for upside targets of 26150, 26200, and 26250+.
If the index manages to break above the major resistance at 26250, the next bullish leg may extend toward 26350, 26400, and 26450+. On the downside, a reversal short opportunity will come only if Nifty rejects the 26250–26200 zone, where targets toward 26150, 26100, and 26050- become active.
Since the opening is flat, price action around these key levels will decide the trend for the day, and the market may remain range-bound initially until either side breaks decisively.

NIFTY Levels for Today
Here are the NIFTY's Levels for intraday (in the image below) today. Based on market movement, these levels can act as support, resistance or both
Please consider these levels only if there is movement in index and 15m candle sustains at the given levels. The SL (Stop loss) for each BUY trade should be the previous RED candle below the given level. Similarly, the SL (Stop loss) for each SELL trade should be the previous GREEN candle above the given level.
Note: This idea and these levels are only for learning and educational purpose.
Your likes and boosts gives us motivation for continued learning and support.

Nifty Trading Strategy for 21st November 2025📌 Nifty Intraday Trading Plan (15-Minute Candle Strategy)
This trading plan is based on a breakout strategy using the high and low of the 15-minute candle. Wait for the candle to close beyond the level before taking any entry. Always use strict risk management.
🔵 BUY SETUP (Bullish Bias)
Condition:
Enter a buy trade only if a 15-minute candle closes above 26,273 (the high of the reference candle).
📈 Entry:
Buy above: 26,273 (after candle close confirmation)
🎯 Targets:
Target 1: 26,300
Target 2: 26,323
Target 3: 26,353
🛑 Suggested Stop-Loss (SL):
Below the breakout candle low OR
A fixed SL of 40–60 points, depending on volatility.
⚠️ Notes for Buy Setup:
Ensure the breakout candle has above-average volume.
Avoid buying if the breakout is caused only by a news spike without follow-through.
Trail stop-loss once Target 1 is hit.
🔴 SELL SETUP (Bearish Bias)
Condition:
Enter a sell trade only if a 15-minute candle closes below 26,140 (the low of the reference candle).
📉 Entry:
Sell below: 26,140 (after candle close confirmation)
🎯 Targets:
Target 1: 26,100
Target 2: 26,068
Target 3: 26,038
🛑 Suggested Stop-Loss (SL):
Above the breakdown candle high OR
A fixed SL of 40–60 points, depending on volatility.
⚠️ Notes for Sell Setup:
Breakdown should happen with strong bearish momentum.
Avoid selling during sideways or choppy conditions.
Trail stop-loss once Target 1 is reached.
📌 Risk Management & Practical Guidelines
Do not enter the trade without candle close confirmation.
Stick to your stop-loss—never average a losing position.
Risk only 1–2% of your capital per trade.
Follow your plan strictly—avoid emotional trading.
If the entry happens near a major news event, wait 5–10 minutes for stability.
⚠️ Disclaimer
This is not investment advice.
I am not a SEBI-registered analyst.
All information provided is for educational and study purposes only.
Trading in the stock market involves risk.
Please consult your financial advisor before making any trading decisions.

Daily Macro, Market Mood Swings, & the Stories Behind the NoiseThe Stale Jobs Report Nobody Asked For
The much-delayed US September jobs report finally arrived yesterday —only to reveal that its insights are about as fresh as leftovers forgotten in the office fridge. Not only are the numbers too “stale” to be useful, but even if we pretend they’re not, the report still refuses to shed meaningful light on where the labor market actually stands. In short: lots of data, very little enlightenment, and definitely no peace treaty for the Federal Reserve’s ongoing internal policy debate.
Shutdown Fog and the Market Mood Swing
Adding to the confusion, the BLS has now said the November NFP print won’t drop until after the December FOMC meeting. Combine that with a government-shutdown haze apparently scheduled to lift sometime in 2026, and markets did what markets do best—panic elegantly. US equities went from hopeful green to tragic red faster than you can say “data dependency.”
Fed Officials: United in Caution, Divided in Direction
With just weeks until the Fed’s final meeting of the year, policymakers are broadcasting a delightful mix of caution, hesitation, and the occasional rate-cut cheerleading. Goolsbee, Hammack, and Cook are all expressing varying shades of “let’s not rush this,” while Waller is enthusiastically waving the December-cut flag. The collective mood reinforces Powell’s recent reminder that a December cut is “not a foregone conclusion,” and judging by the chatter, the “no” camp seems to be gaining momentum.
The Dollar Puts on Its Superhero Cape
Meanwhile, the US Dollar is out here having a fantastic week. Fuelled by fading expectations of a December Fed rate cut—and boosted by a surprisingly strong September NFP reading showing 119K new jobs—the Greenback marched to six-month highs. The DXY even broke past the 100 mark, flexing its muscles despite falling Treasury yields
A Data-Packed Day Ahead
If all that wasn’t enough, today’s global data calendar is busier than a central banker at a press conference. We’ve got PMI prints from the Eurozone, UK, and US; UK retail sales; ECB President Lagarde holding court; and a parade of Fed speakers including Williams, Barr, Jefferson, and Logan. Throw in the U-Michigan Consumer Sentiment Index, and you’ve got a full economic buffet—with plenty of opportunities for markets to overreact yet again.

Nifty50 - Wave 4 Flat in Play, Triangle on the HorizonNifty’s prior correction completed as a W–X–Y, with Wave Y ending in a rare truncation — a sign of exhaustion before the next impulse began.
The following rise is unfolding into a clean 5-wave sequence. Wave 4 now appears as a flat correction but, per alternation, could stretch into a sideways triangle while holding above the 0.382–0.5 zone.
Once complete, Wave 5 may challenge and possibly clear the ATH line.
Disclaimer: This analysis is for educational purposes only and does not constitute investment advice. Please do your own research (DYOR) before making any trading decisions.

Nifty 50 On UP Trend for 2026Nifty has formed a channel pattern for the past 1 year and in Nov 2025 it has broken the channel and has also done a retracement. Based on the height of the channel, we can expect Nifty to touch 29000, but maybe it can go beyond that and touch 30K by end of 2026 or early 2027.
Disclaimer: Kindly check with your financial advisor before taking any trade.

NIFTY : Trading levels and Plan for 20-Nov-2025📊 NIFTY TRADING PLAN — 20 NOV 2025
(Reference: 15-min chart structure & key intraday levels)
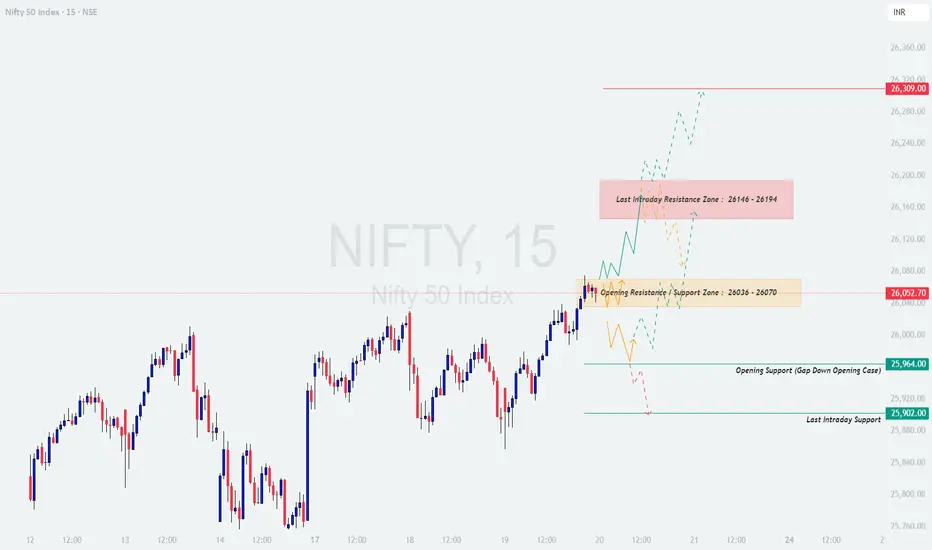
Nifty closed around 26,052, sitting just above the Opening Resistance / Support Zone (26,036 – 26,070). Price action is now heading toward a crucial supply area above 26,140–26,194, and short-term structure suggests volatility around the opening price.
Here are the major actionable levels for 20 Nov 2025:
🟧 Opening Resistance / Support Zone: 26,036 – 26,070
🟥 Last Intraday Resistance Zone: 26,146 – 26,194
🟥 Major Resistance: 26,309
🟩 Opening Support (Gap-down case): 25,964
🟩 Last Intraday Support: 25,902
Below is the complete plan for all opening scenarios 👇
🟢 SCENARIO 1 — GAP-UP OPENING (100+ Points)
If Nifty opens around 26,150–26,200, this places price directly inside or just under the Last Intraday Resistance Zone (26,146–26,194).
If price sustains above 26,194 for 10–20 minutes with strong volume →
⭐ Upside targets → 26,245 → 26,280 → 26,309
If price rejects 26,146–26,194, expect a correction toward:
➡️ 26,100 → 26,070
A bullish retest at 26,070 with reversal candles offers a safe long entry.
Avoid buying immediately at open — gap-ups near resistance often trap traders.
📘 Educational Note:
Gap-ups work best only when price makes higher lows after the open. A flat or weak first candle at resistance often signals exhaustion.
🟧 SCENARIO 2 — FLAT OPENING (Near 26,020–26,070)
A flat open places Nifty inside the Opening Resistance / Support Zone (26,036–26,070) — a decision region.
A clean breakout above 26,070 →
Targets → 26,110 → 26,146 → 26,194
If price breaks below 26,036, expect a drop to:
➡️ 25,964 (Opening Support)
Avoid trading inside the 26,030–26,070 zone until direction is clear.
Best trades will be:
— Breakout → Retest → Continuation
— Support bounce from 25,964
💡 Educational tip:
Flat openings are ideal for trend identification. The first 15-min candle usually gives strong directional clues — don’t rush in.
🔻 SCENARIO 3 — GAP-DOWN OPENING (100+ Points)
A gap-down below 25,970 puts price directly into the Opening Support zone (25,964).
If 25,964 holds with bullish wick rejection →
Upside targets → 26,020 → 26,070 → 26,110
If price breaks 25,964 decisively, next support zone:
➡️ 25,902 (Last Intraday Support)
A strong bounce from 25,902 can provide an excellent low-risk long entry.
If 25,902 breaks with momentum, downside expands to:
➡️ 25,860 → 25,820
📘 Educational Note:
Gap-downs into support often give the strongest reversal trades of the day — but only after confirmation.
💼 RISK MANAGEMENT TIPS FOR OPTION TRADERS 💡
Avoid trading the first 5–10 minutes after market opens.
Use ATM or ITM options for directional trades.
Define your stop loss BEFORE entering — never adjust it emotionally.
Avoid averaging in losing positions.
When VIX is low → option buying works better.
When VIX is high → prefer hedged option selling strategies.
Book partial profits — don’t wait for full target if momentum weakens.
⚠️ Golden Rule:
Your objective is to survive long enough to catch the big moves — protect your capital first.
📌 SUMMARY
Bullish above → 26,070
Target zone → 26,110 → 26,146 → 26,194 → 26,309
Bearish below → 25,964
Target zone → 25,902 → 25,860 → 25,820
Key No-Trade Areas:
— 26,036–26,070 (Flat opening zone)
— 26,150–26,194 (High-risk supply zone)
🧾 CONCLUSION
Nifty is trading near a heavy resistance cluster, and the market’s reaction to the 26,070 level will define the day’s trend.
The cleanest and safest trades will come from:
✔️ Breakout & retest above 26,070
✔️ Reversal from 25,964
✔️ Momentum breakout above 26,194
Avoid trading inside choppy zones and let the market reveal its direction.
⚠️ DISCLAIMER
I am not a SEBI-registered analyst . This analysis is for educational purposes only . Please consult a certified financial advisor before making any trading or investment decisions.