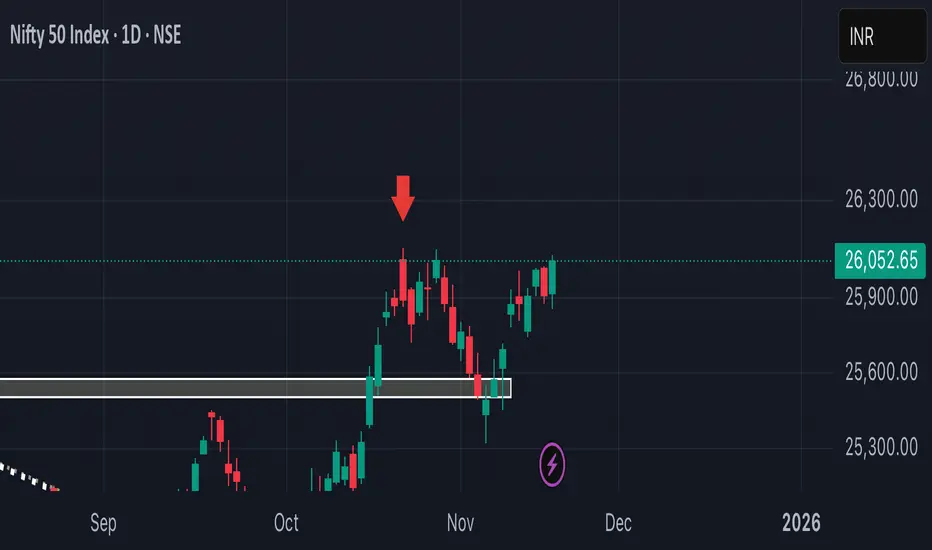
Nifty 50 On UP Trend for 2026Nifty has formed a channel pattern for the past 1 year and in Nov 2025 it has broken the channel and has also done a retracement. Based on the height of the channel, we can expect Nifty to touch 29000, but maybe it can go beyond that and touch 30K by end of 2026 or early 2027.
Disclaimer: Kindly check with your financial advisor before taking any trade.
Trade ideas

NIFTY : Trading levels and Plan for 20-Nov-2025📊 NIFTY TRADING PLAN — 20 NOV 2025
(Reference: 15-min chart structure & key intraday levels)
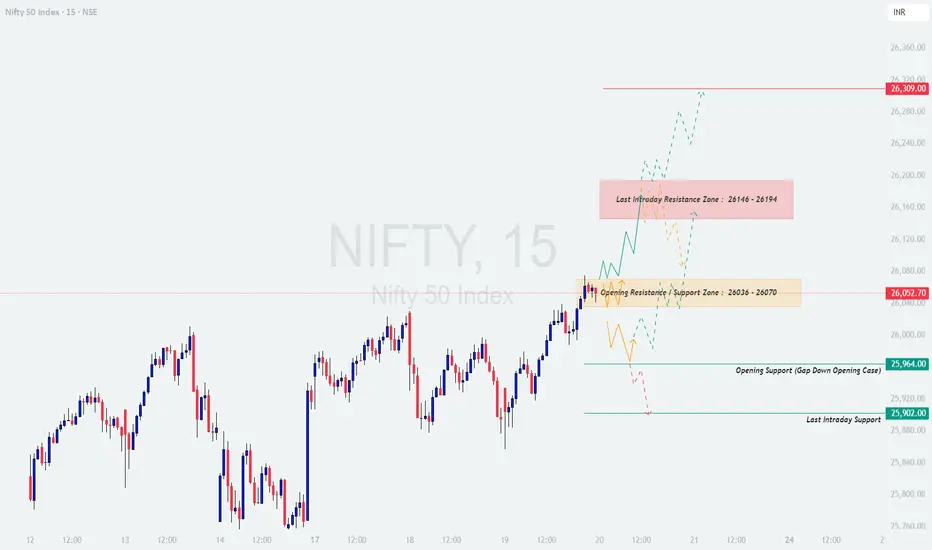
Nifty closed around 26,052, sitting just above the Opening Resistance / Support Zone (26,036 – 26,070). Price action is now heading toward a crucial supply area above 26,140–26,194, and short-term structure suggests volatility around the opening price.
Here are the major actionable levels for 20 Nov 2025:
🟧 Opening Resistance / Support Zone: 26,036 – 26,070
🟥 Last Intraday Resistance Zone: 26,146 – 26,194
🟥 Major Resistance: 26,309
🟩 Opening Support (Gap-down case): 25,964
🟩 Last Intraday Support: 25,902
Below is the complete plan for all opening scenarios 👇
🟢 SCENARIO 1 — GAP-UP OPENING (100+ Points)
If Nifty opens around 26,150–26,200, this places price directly inside or just under the Last Intraday Resistance Zone (26,146–26,194).
If price sustains above 26,194 for 10–20 minutes with strong volume →
⭐ Upside targets → 26,245 → 26,280 → 26,309
If price rejects 26,146–26,194, expect a correction toward:
➡️ 26,100 → 26,070
A bullish retest at 26,070 with reversal candles offers a safe long entry.
Avoid buying immediately at open — gap-ups near resistance often trap traders.
📘 Educational Note:
Gap-ups work best only when price makes higher lows after the open. A flat or weak first candle at resistance often signals exhaustion.
🟧 SCENARIO 2 — FLAT OPENING (Near 26,020–26,070)
A flat open places Nifty inside the Opening Resistance / Support Zone (26,036–26,070) — a decision region.
A clean breakout above 26,070 →
Targets → 26,110 → 26,146 → 26,194
If price breaks below 26,036, expect a drop to:
➡️ 25,964 (Opening Support)
Avoid trading inside the 26,030–26,070 zone until direction is clear.
Best trades will be:
— Breakout → Retest → Continuation
— Support bounce from 25,964
💡 Educational tip:
Flat openings are ideal for trend identification. The first 15-min candle usually gives strong directional clues — don’t rush in.
🔻 SCENARIO 3 — GAP-DOWN OPENING (100+ Points)
A gap-down below 25,970 puts price directly into the Opening Support zone (25,964).
If 25,964 holds with bullish wick rejection →
Upside targets → 26,020 → 26,070 → 26,110
If price breaks 25,964 decisively, next support zone:
➡️ 25,902 (Last Intraday Support)
A strong bounce from 25,902 can provide an excellent low-risk long entry.
If 25,902 breaks with momentum, downside expands to:
➡️ 25,860 → 25,820
📘 Educational Note:
Gap-downs into support often give the strongest reversal trades of the day — but only after confirmation.
💼 RISK MANAGEMENT TIPS FOR OPTION TRADERS 💡
Avoid trading the first 5–10 minutes after market opens.
Use ATM or ITM options for directional trades.
Define your stop loss BEFORE entering — never adjust it emotionally.
Avoid averaging in losing positions.
When VIX is low → option buying works better.
When VIX is high → prefer hedged option selling strategies.
Book partial profits — don’t wait for full target if momentum weakens.
⚠️ Golden Rule:
Your objective is to survive long enough to catch the big moves — protect your capital first.
📌 SUMMARY
Bullish above → 26,070
Target zone → 26,110 → 26,146 → 26,194 → 26,309
Bearish below → 25,964
Target zone → 25,902 → 25,860 → 25,820
Key No-Trade Areas:
— 26,036–26,070 (Flat opening zone)
— 26,150–26,194 (High-risk supply zone)
🧾 CONCLUSION
Nifty is trading near a heavy resistance cluster, and the market’s reaction to the 26,070 level will define the day’s trend.
The cleanest and safest trades will come from:
✔️ Breakout & retest above 26,070
✔️ Reversal from 25,964
✔️ Momentum breakout above 26,194
Avoid trading inside choppy zones and let the market reveal its direction.
⚠️ DISCLAIMER
I am not a SEBI-registered analyst . This analysis is for educational purposes only . Please consult a certified financial advisor before making any trading or investment decisions.
NIFTY : Trading levels and Plan for 21-Nov-2025📊 NIFTY TRADING PLAN — 21 NOV 2025
(Reference: 15m chart structure & mapped zones)
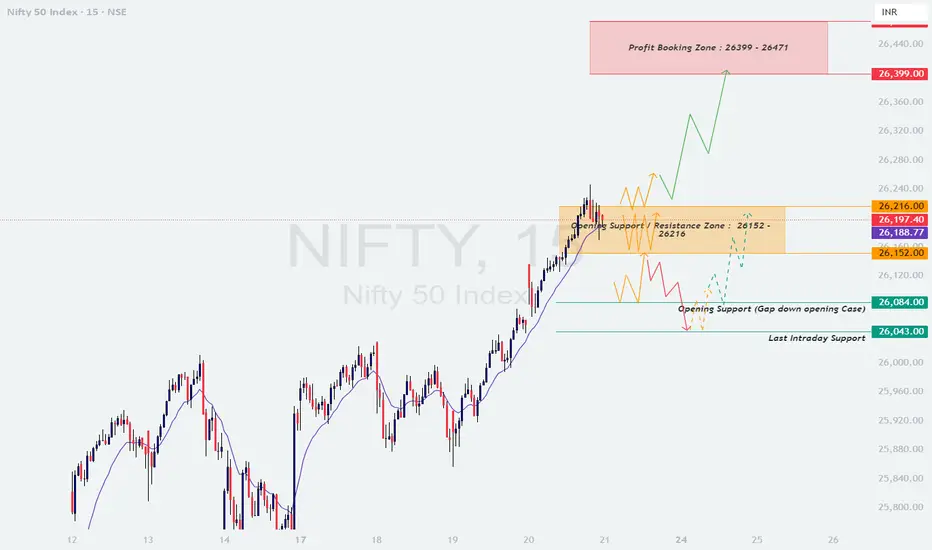
Nifty closed around 26,197, right inside the Opening Support / Resistance Zone (26,152 – 26,216).
Price is consolidating after a strong uptrend, and the market is testing a critical decision zone before attempting either a breakout toward 26,300+ or a pullback toward intraday supports.
Here are the major actionable zones for 21 Nov 2025:
🟧 Opening Support / Resistance Zone: 26,152 – 26,216
🟥 Profit Booking Zone: 26,399 – 26,471
🟩 Opening Support (Gap-down case): 26,084
🟩 Last Intraday Support: 26,043
🟢 SCENARIO 1 — GAP-UP OPENING (100+ Points)
If Nifty opens around 26,260–26,320, price opens above the decision zone and heads closer to resistance.
If price sustains above 26,216 with strong volume →
🎯 Targets → 26,260 → 26,310 → 26,399
Once price enters the Profit Booking Zone (26,399 – 26,471), expect volatility & selling pressure.
💡 Safe to book profits in this region.
If gap-up gets rejected from 26,260–26,300, expect:
➡️ Pullback to 26,216 → 26,180
A bullish reversal at 26,180–26,216 gives a safe continuation long.
📘 Educational Note:
Gap-ups near major resistance can trap buyers. Always wait for confirmation (higher low or retest breakout) before entering.
🟧 SCENARIO 2 — FLAT OPENING (Near 26,150–26,210)
A flat opening places Nifty directly in the Opening Support / Resistance Zone (26,152–26,216) — a “no-direction” zone.
A breakout above 26,216 →
Targets → 26,260 → 26,310
A breakdown below 26,152 →
Targets → 26,120 → 26,084
Avoid trading between 26,152–26,216 until clear breakout or breakdown occurs.
Best trades will be:
✔️ Breakout → Retest → Long
✔️ Breakdown → Retest → Short
💡 Educational Tip:
Flat opens require patience — the first 15-minute candle usually sets the trend for the day.
🔻 SCENARIO 3 — GAP-DOWN OPENING (100+ Points)
A gap-down below 26,120 pushes Nifty toward the Opening Support (26,084) or lower.
If 26,084 holds with a wick-rejection →
Upside targets → 26,150 → 26,180 → 26,216
If price breaks below 26,084, next support:
➡️ 26,043 (Last Intraday Support)
A strong bounce from 26,043 can give an excellent low-risk long entry.
If 26,043 fails, next downside targets expand to:
➡️ 25,990 → 25,950
📘 Educational Note:
Gap-downs into support can reverse sharply — but only when confirmation (reversal candle + volume) is present.
💼 RISK MANAGEMENT TIPS FOR OPTION TRADERS 💡
Avoid trading the first 5–10 minutes if volatility is high.
Prefer ATM or slight ITM options for directional moves.
Always place SL based on structure — not based on emotional comfort.
Don’t average losing positions — trend can continue longer than expected.
Scalp profits quickly during sideways markets.
In high VIX environments → prefer spreads or hedged strategies.
Trail stop-loss if momentum breakout happens.
⚠️ Golden Rule:
Protecting capital > Catching every move. Consistency beats aggression.
📌 SUMMARY
Bullish above → 26,216
🎯 Targets → 26,260 → 26,310 → 26,399 → 26,471
Bearish below → 26,152**
🎯 Targets → 26,120 → 26,084 → 26,043
Key No-Trade Area:
— 26,152–26,216 (opening chop zone)
🧾 CONCLUSION
Nifty is at a decision zone, and the move away from the 26,152–26,216 range will guide the day’s trend.
The safest opportunities will occur from:
✔️ Breakout above 26,216 → Retest → Long
✔️ Reversal from 26,399–26,471 (for intraday short)
✔️ Bounce from 26,084 or 26,043 in gap-down scenarios
Stay patient at the open, trade with confirmation, and avoid the noisy zones.
⚠️ DISCLAIMER
I am not a SEBI-registered analyst.
This analysis is purely for educational purposes.
Please consult your financial advisor before taking any trades.
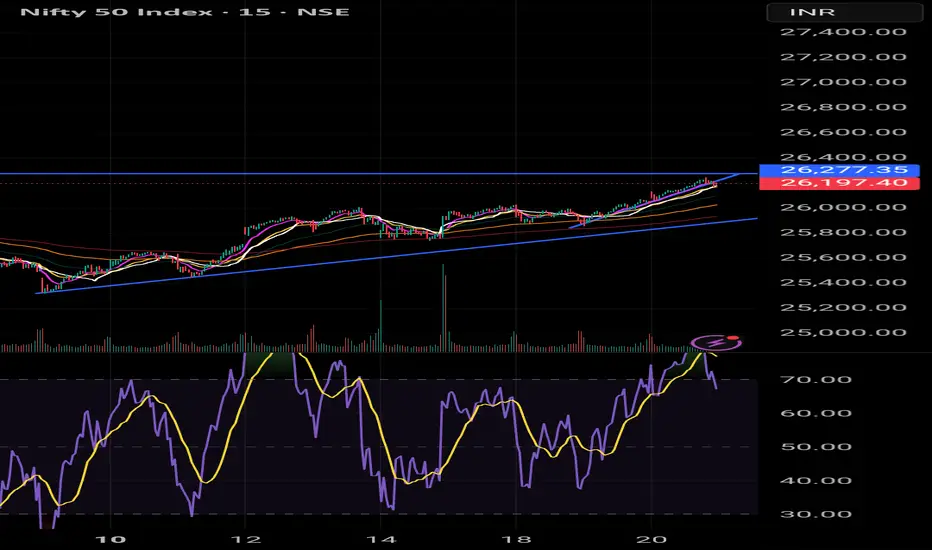
Unidirectional move is yet to come! As we can see NIFTY has finally broken above 26100 level and has managed to close itself above the given level. Moreover it has broken the neckline of inverted head and shoulders pattern showing signs of strong upmove so plan your trades accordingly and keep watching everyone.

Market Pulse — Nifty: structurally strong, tactically cautiousOn 20 November 2025, Indian markets once again displayed resilience despite mixed global cues. The intraday structure across the 5-minute and 1-hour charts remained decisively bullish. The market respected the short-term trade line that began on 19 November, repeatedly defended the 25,850–25,913 support band on lower timeframes, and closed near recent highs. Nvidia’s quarterly beat provided relief to global risk sentiment and temporarily eased concerns surrounding the AI sector. However, the larger structural risk remains the wave of unprofitable AI startups that depend on continuous funding. Domestically the market tone remains constructive; globally the environment remains fragile and highly sensitive to events.
Market Context — What Moved Price Today
• Global markets reacted positively to stronger-than-expected results from a major AI-chip manufacturer, easing fears of a broader technology-led shock.
• Indian markets absorbed early weakness and showed buying at previously tested short-term supports around 25,850–25,913. Multiple sessions without a clean breakdown below this area have turned it into a reliable demand zone.
• Volatility remained driven by events. Options positioning and volume spikes revealed aggressive institutional adjustments around major index levels, especially between 26,100–26,300 on the call side and 25,800–26,000 on the put side.
Technical Read — Structure, Levels and What to Watch
High-Level Bias: Daily and Weekly
• The trend remains bullish. Daily and weekly charts show higher highs and higher lows, with the index trading above important moving averages after recently breaking out of a multi-month consolidation.
• Weekly support sits around 25,400–25,600. A break below this region would indicate participation from broader sellers.
Intraday Structure: 1-Hour and 15-Minute
• The upward-sloping trade line from the 19 November low continues to guide short-term momentum. Sustaining above 26,100–26,120 keeps the bias positive.
• Immediate resistance lies at 26,200–26,300. A strong hourly close above 26,300 increases the likelihood of a move to record highs.
• Immediate support rests at 26,050–26,100, followed by 25,850–25,913, a zone that has been protected for several sessions.
• A daily close below 25,700–25,650 would weaken the overall structure and open the possibility of a deeper retracement towards 25,350–25,400.
5-Minute Micro Structure
• The market has been building a sequence of higher lows since 19 November. A clear 5-minute breakdown below the trade line or below 25,913 may trigger a quick intraday fade.
• Upward impulses have been supported by strong volume. Watch for volume divergence near resistance, which would suggest waning momentum.
Options and Positioning
• Options interest remains concentrated between 26,200–26,300 on calls and 25,900–26,000 on puts. This creates a zone where market-makers hedge aggressively, increasing intraday volatility.
• With expiry approaching, option decay accelerates. Significant moves can cause rapid repricing of options.
• Conservative strategies or defined-risk spreads are preferable to naked options during such conditions.
Macro and Fundamental Overlay
• Domestic fundamentals remain supportive. Recent data shows easing inflation, firm consumption trends, and steady policy direction. This backdrop has encouraged domestic investors to buy dips even when global markets show weakness.
• Foreign investor flows have been inconsistent, but domestic institutions and mutual funds have consistently provided depth and absorbed selling pressure. This dynamic keeps India relatively stable, though not immune to global risk-off phases.
• A major sector rotation risk remains in global technology. The rapid flow of capital into AI-linked assets has left valuations stretched. As large global companies report results, any slowdown in momentum can trigger broader de-risking.
Risk Map — What Could Destabilize the Rally
1. A slowdown in funding for unprofitable AI startups, leading to leveraged unwinding and reduced demand for hardware.
2. Weak US data or unexpected central bank shifts that affect global risk appetite.
3. Negative developments in India-US trade discussions or unfavourable geopolitical moves.
4. Domestic macro surprises or policy issues that disrupt the current liquidity environment.
Practical Trading Framework
Short-Term Intraday (5-Minute / 15-Minute)
• Long trades are favourable if price sustains above 26,100 with stops below 26,050. Upside targets lie around 26,300 and 26,400.
• Short trades become valid if price breaks below 25,913 on a 5-minute close, with targets near 25,850 and 25,700. Position sizing should remain controlled.
Swing Outlook (1 Day to 2 Weeks)
• Dips into 25,850–25,700 remain opportunities for staggered long entries, with stops below 25,600.
• Exposure to highly valued AI and tech names should be moderated. Prefer sectors reinforced by domestic fundamentals such as financials, cyclicals and consumption-linked names.
Options and Hedging
• Portfolio hedges using put options near major supports can help if volatility suddenly rises.
• Defined-risk bullish call spreads offer upside exposure without excessive premium outlay.
Psychology and Positioning
• The extended AI rally created concentration risks in global portfolios. When sentiment shifts, exits tend to be correlated across the same sector.
• Diversification and disciplined sector exposure limit this risk.
• Indian investors have taken a measured approach, using volatility as opportunity rather than reacting with fear.
Levels and News to Monitor
• Daily close above 26,300 indicates bullish continuation.
• Daily close below 25,650 signals broad structural weakness.
• Intraday: 26,100–26,150 as support; 26,200–26,300 as resistance.
• Flows: monitor daily FII/DII activity and mutual fund allocations.
• Domestic macro releases: inflation, consumption indicators, policy commentary.
• Global cues: US technology earnings, commentary from major AI-related firms, US bond yields, and developments in India-US trade discussions.
Conclusion
Indian markets remain structurally strong. Buyers continue to defend support zones, short-term trade lines remain intact, and price action reflects confidence rather than complacency. The global landscape, however, remains sensitive due to stretched AI valuations and key technology earnings. The prudent stance is to maintain a positive bias while managing risk carefully. Buying into well-defined support zones, trimming exposure to overheated segments, and hedging when necessary remain sensible strategies. Any deep correction driven by global factors would likely offer strong long-term opportunities in fundamentally sound, domestically aligned sectors.
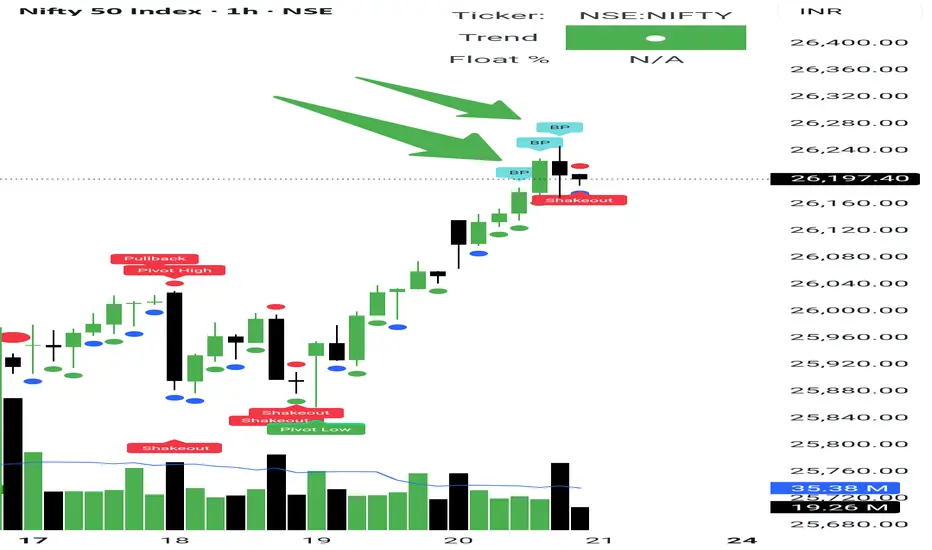
Nifty Hits Our 26250 Target — Now Time to ObserveNifty Hits Our 26250 Target — Now Time to Observe
NSE:NIFTY has been moving exactly the way we planned.
The target we marked — 26250 — got achieved today.
I’m more than satisfied trading this entire 300-point move in the index, especially when swing setups weren’t matching my environment.
Nifty still isn’t too stretched to say a proper pullback is here, but a small squat can’t be ruled out.
My indicator is already showing “BP” — meaning weekly traders may start profit booking.
I want to see if that reflects on the daily chart the same way it showed up on the hourly.
So tomorrow I won’t trade aggressively. I’ll just observe and prepare for next week’s structure.
Here are the levels for tomorrow:
Support: 26132
Resistance: 26250 — above this, the next move can push towards 26303
Market breadth has dropped, so I won’t be focusing on stock picking for now.
My eyes will stay on the index and a few large-cap FnO setups only.
That will be all for the day.
Take care. Have a profitable tomorrow.
Nifty and BNF View for 21-11-2025Nifty and BNF View for 21-11-2025
* where to trade?
*what will be the buying zone?
educational purpose only

Nifty reached 26300 already post chart for education purposeNifty reached 26300 already post chart for education purpose

Nifty Intraday Analysis for 20th November 2025NSE:NIFTY
Index has resistance near 26225 – 26275 range and if index crosses and sustains above this level then may reach near 26450 – 26500 range.
Nifty has immediate support near 25900 – 25850 range and if this support is broken then index may tank near 25700 – 25650 range.
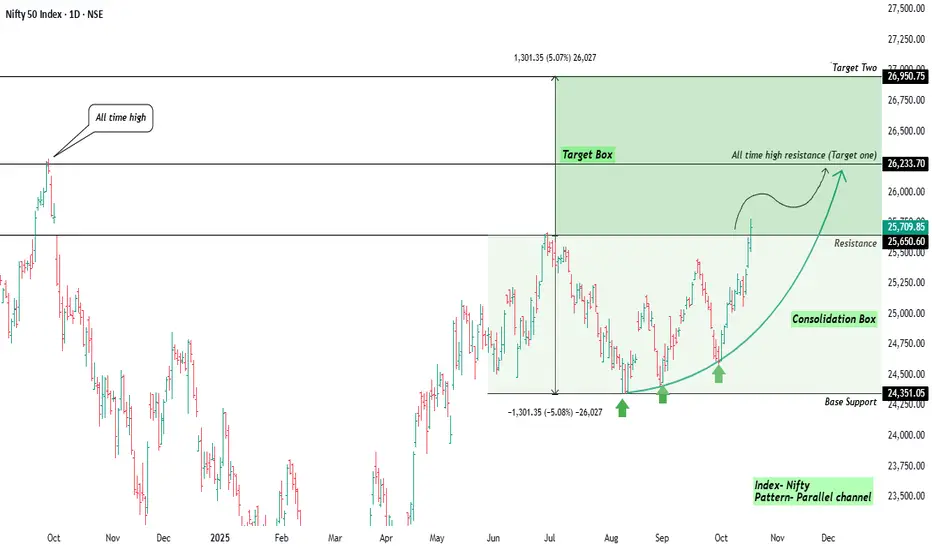
Nifty From Consolidation to Momentum🪔Wishing everyone in the TradingView community a prosperous and bright Diwali 🎇
May this festival bring you clarity like a clean chart, and profits that trend higher with discipline and peace of mind.
Description / Post Body (Technical Analysis View)-:
After a few months of sideways movement, Nifty has finally shaped up into a strong parallel channel pattern.
The index built a solid base near 24,350, where price found repeated buying interest forming the foundation of the current up-leg.
The latest breakout above the 25,650 resistance zone now opens a clean path toward the All Time High resistance (around 26,233) which is marked as Target One.
If momentum sustains, the measured move symmetry projects a possible extension toward 26,950 shown as Target Two / Target Box.
The price structure is supported by higher lows, showing renewed strength and confidence from buyers. The curved projection hints that the market might pause slightly near the previous top before any decisive breakout.
This view focuses on chart behaviour and structure, not short-term trading signals — it’s more about understanding how market psychology unfolds through patterns.
Key Observations-:
Pattern: Parallel Channel Breakout
Base Support: ~24,350
Immediate Resistance (Broken): ~25,650
All-Time High / Target 1: ~26,233
Target 2 Zone: 26,950 ±50
Bias: Positive while above 25,000
Regards Amit, Happy Diwali!
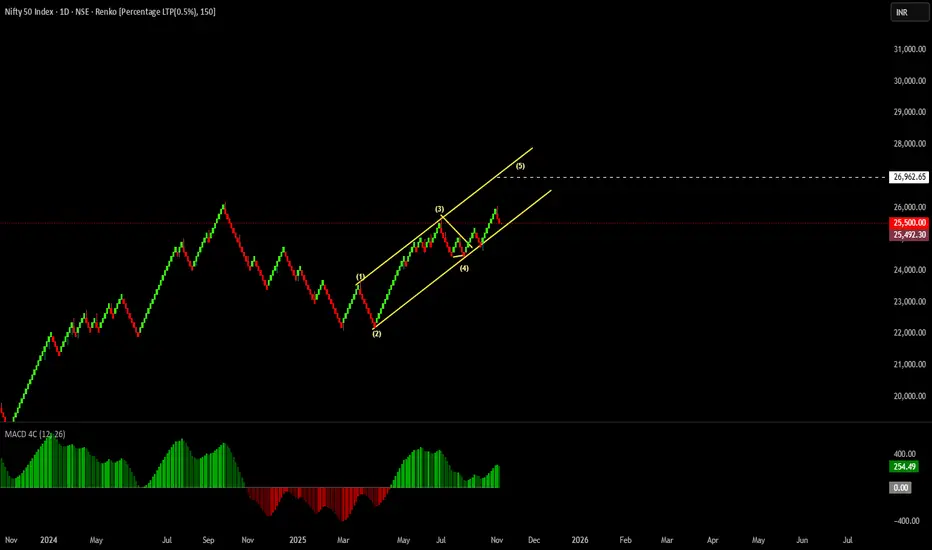
Noise Less Charting Method Friends I have made an visual representation of where the Nifty would be heading based on the
Method i follow as wave theory
Interesting to note the price is in the channel or representation of channel fits the price movement
Also You can note i have selected 0.50 % Box size in Ranko Bars , which represents the movement in harmonic or linear movements based on fixed price bars
Now i have applied wave theory which represents the methods i follow as Analyst
Wave 2 Represents sharp correction
Wave 4 Represents Complex Running Flat Pattern leaving second leg correction fell short to represent the urgency in the Movement
Now I have forecasted it with mathematical calculations which may represents an measured move method to take Profits
All this is an education content
I hope you understand it and then hit the like button
Good luck
[long] NIFTY 50 Peak Touch Tone1. Found that proper support zone.
2. Trendline occured very well.
3. Pinbar at trendline.
4. Fibonacci Retracement @ 50%
Results will peak at high marked area.

Pivot Points - Traditional🔎 Overview
Traditional Pivot Points are widely used reference levels derived from the previous session’s High, Low, and Close.
They help traders identify equilibrium , short-term trend direction , and key reaction zones where price may bounce or reverse.
The central Pivot Point (P) acts as the day’s balance line, while Resistance (R1–R5) and Support (S1–S5) levels map out potential price behavior for the current session.
---------------------------------------------------------------
📊 What the Levels Represent
🔹 Pivot Point (P)
1. A pre-calculated central level reflecting market equilibrium.
2. Price above P → bullish bias.
3. Price below P → bearish bias.
🔹 Resistance Levels (R1, R2, R3…)
• Highlight potential upside reaction zones.
• Useful for spotting breakout targets, continuation levels, or reversal points.
🔹 Support Levels (S1, S2, S3…)
• Mark potential downside reaction zones.
• Identify areas where buyers may step in or momentum may slow.
---------------------------------------------------------------
🟩 Bullish Bias
1. Price opens above Pivot Point (P) → early buyer control.
2. Long Opportunity (Pullback) : A retest and bounce from the Pivot confirms support.
3. Strong Momentum : A breakout above R1 strengthens the bullish structure.
4. Trend Continuation : Sustained price action above R2 reflects strong upside momentum.
---------------------------------------------------------------
🟥 Bearish Bias
1. Price opens below Pivot Point (P) → early seller control.
2. Short Opportunity (Pullback) : A retest and rejection from the Pivot confirms resistance.
3. Strong Momentum : Breakdown below S1 signals rising bearish pressure.
4. Trend Continuation : Consistent action below S2 suggests a short-term downside trend.
---------------------------------------------------------------
📝 Summary
• Pivot Points offer a structured roadmap for short-term price behaviour.
• P = balance line; R-levels = upside targets; S-levels = downside zones.
• Bias depends on where price opens relative to P.
• Helpful for traders using structure, pullbacks, and breakout confirmation in lower timeframes.
---------------------------------------------------------------
⚠️ Disclaimer
📘 For educational purposes only.
🙅 Not SEBI registered.
❌ Not a buy/sell recommendation.
🧠 Purely a learning resource.
📊 Not Financial Advice.

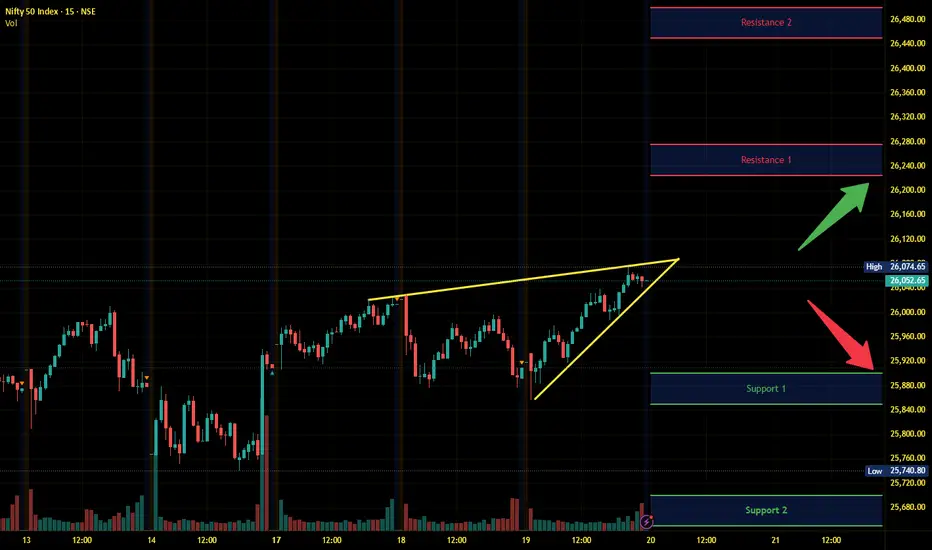
Daily Analysis Nifty: 20/11/25A quick analysis of Nifty levels as the market is under pressure on both sides. To make it clear, I have mentioned the levels of both sides. Mostly, I am waiting for a downside breach of the ranging zone between 26151-26100. But as RSI is giving hints of a higher-side breakout, the upper levels are also mentioned.

Nifty Is on track !We are in good shape looking at nifty's current price trend.
The middle of the channel around 26300 to 26500 is what I am expecting nifty to be by the end of november, further longs can only be done once we cross the middle of the channel otherwise we can see some correction. Look out for the middle of the channel.

Nifty Analysis for Nov 20, 2025Wrap-up:
As predicted Nifty breaks 26029 after taking support at 25857.
What I’m Watching for Nov 20, 2025 🔍
Short nifty only if it breaks 25785 SL above 25896 for a target of 25607-25545 and 25042-25167 (SL on 15 min. candle close).
Buy nifty only if takes support at 25896 only intraday with a sl below 25785.
Impulsive move is treated as completed once nifty breaks 25785.
Disclaimer: Sharing my personal market view — only for educational purpose not financial advice.

Nifty Trading Strategy for 20th November 2025📈 NIFTY Trading Plan (Intraday Based on 15-Min Candle Breakout Strategy)
(For Educational & Study Purpose Only)
🔵 BUY Setup (Long Entry Criteria)
You may consider a long (buy) position only if the following conditions are met:
A 15-minute candle closes above 26,135.
After this candle closes, place the buy order above the high of that same 15-minute candle.
This ensures a proper confirmation breakout and avoids false moves caused by wicks.
🎯 Upside Targets
Once the buy entry gets triggered, the following targets may be tracked:
Target 1: 26,165
Target 2: 26,199
Target 3: 26,230
🛑 Suggested Stop Loss (for Buy Setup)
A safe stop loss can be kept below the low of the breakout candle or below a nearby support level.
Adjust position size according to risk management rules.
🔴 SELL Setup (Short Entry Criteria)
You may consider a short (sell) position only if the following conditions are met:
A 15-minute candle closes below 25,965.
After the candle closes, place the sell order below the low of that candle.
This method helps avoid premature entries and confirms downside momentum.
🎯 Downside Targets
Once the sell entry gets triggered, the following targets may be tracked:
Target 1: 25,930
Target 2: 25,900
Target 3: 25,865
🛑 Suggested Stop Loss (for Sell Setup)
SL can be placed above the high of the breakdown candle or above a nearby resistance area.
📘 Important Notes
Always wait for the candle to close, not just touch the levels.
This strategy works best when:
Market has strong trend or momentum
There is clarity in direction (avoid choppy markets)
Follow strict risk management and avoid over-leveraging.
⚠️ DISCLAIMER (Please Read Carefully)
This analysis is strictly for educational, informational, and study purposes only.
I am not a SEBI-registered analyst or advisor.
This is not investment, trading, or financial advice.
Markets are risky; please consult with a certified financial advisor before making any trading decisions.
You are solely responsible for your profits and losses.

NIFTY KEY LEVELS FOR 20.11.2025NIFTY KEY LEVELS FOR 20.11.2025
Timeframe: 3 Minutes
If the candle stays above the pivot point, it is considered a bullish bias; if it remains below, it indicates a bearish bias. Price may reverse near Resistance 1 or Support 1. If it moves further, the next potential reversal zone is near Resistance 2 or Support 2. If these levels are also broken, we can expect the trend.
When a support or resistance level is broken, it often reverses its role; a broken resistance becomes the new support, and a broken support becomes the new resistance.
If the range(R2-S2) is narrow, the market may become volatile or trend strongly. If the range is wide, the market is more likely to remain sideways
please like and share my idea if you find it helpful
📢 Disclaimer
I am not a SEBI-registered financial adviser.
The information, views, and ideas shared here are purely for educational and informational purposes only. They are not intended as investment advice or a recommendation to buy, sell, or hold any financial instruments.
Please consult with your SEBI-registered financial advisor before making any trading or investment decisions.
Trading and investing in the stock market involves risk, and you should do your own research and analysis. You are solely responsible for any decisions made based on this research.

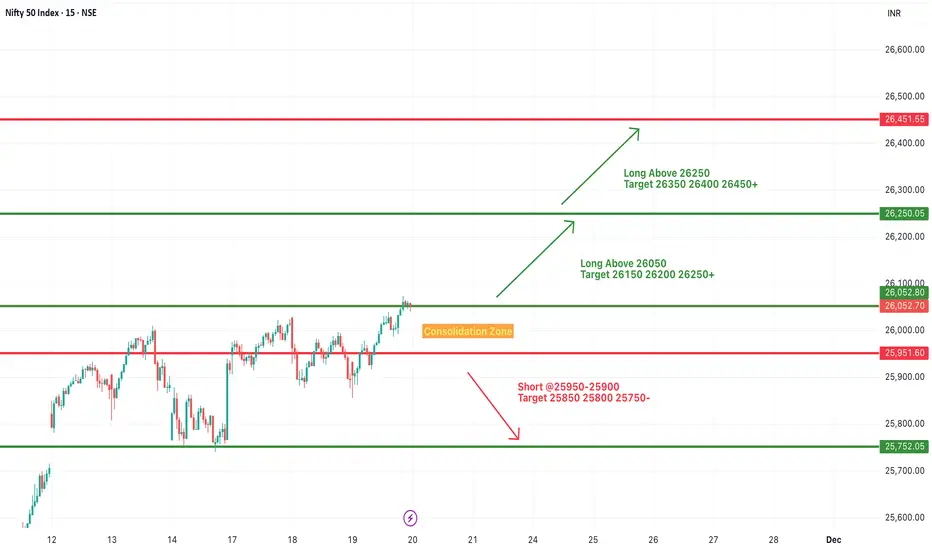
#NIFTY Intraday Support and Resistance Levels - 20/11/2025Nifty is expected to open with a gap-up, indicating continued bullish sentiment and strength above the immediate consolidation zone. If the index sustains above the 26050 level after the opening, it will activate the long trade setup with upside targets of 26150, 26200, and 26250+. A further breakout above 26250 may fuel the next bullish leg toward 26350, 26400, and 26450+.
On the downside, weakness will only come if Nifty slips below the 25950–25900 zone, where short opportunities open up with downside targets at 25850, 25800, and 25750-. For now, the structure remains positive, and the gap-up opening is likely to keep buyers in control as long as key support levels hold firm.
NIFTY Levels for TodayHere are the NIFTY's Levels for intraday (in the image below) today. Based on market movement, these levels can act as support, resistance or both
Please consider these levels only if there is movement in index and 15m candle sustains at the given levels. The SL (Stop loss) for each BUY trade should be the previous RED candle below the given level. Similarly, the SL (Stop loss) for each SELL trade should be the previous GREEN candle above the given level.
Note: This idea and these levels are only for learning and educational purpose.
Your likes and boosts gives us motivation for continued learning and support.

NIFTY- Intraday Levels - 20th November 2025If NIFTY sustain above 26088 above this bullish then around 26130/34/52 above this more bullish then 26223/28/46 or 75/85 strong level then above this wait
If NIFTY sustain below 26042 below this bearish then around 26016/10 or 25992/80 below this more bearish then below this wait more levels marked on chart
My view :-
Nifty is close to life time high will it breaks and sustain above this or we can see some pull back today or may be black Friday tomorrow?
"My viewpoint, offered purely for analytical consideration, The trading thesis is: Nifty (bullish tactical approach: buy on dip) as market is seeking for top for this expiry, We can expect both side movements,
This analysis is highly speculative and is not guaranteed to be accurate; therefore, the implementation of stringent risk controls is non-negotiable for mitigating trade risk."
Consider some buffer points in above levels .
Please do your due diligence before trading or investment.
**Disclaimer -
I am not a SEBI registered analyst or advisor. I does not represent or endorse the accuracy or reliability of any information, conversation, or content. Stock trading is inherently risky and the users agree to assume complete and full responsibility for the outcomes of all trading decisions that they make, including but not limited to loss of capital. None of these communications should be construed as an offer to buy or sell securities, nor advice to do so. The users understands and acknowledges that there is a very high risk involved in trading securities. By using this information, the user agrees that use of this information is entirely at their own risk.
Thank you.

Structure Shift: Nifty Eyes New Highs After Bullish Close📈 Failed breakdown: Nifty tried to slip below the previous low 25,876, but couldn’t sustain and was sharply rejected.
🧭 Structure flip: The 15‑min market structure turned bullish, with a close above resistance and the overhead gap.
Key levels and game plan
Flipped support: 26,000-26,030 - holding this zone keeps the breakout valid and momentum firm.
Demand retest: 25,930–25,980 — clean pullbacks here can offer continuation entries.
Momentum trigger: Above 26,050 — sustained acceptance can open a path toward prior highs and beyond.
Invalidation: Below 25,900 — strong supply here weakens the breakout and reopens the range.
Scenarios to watch
🚀 If support holds: Base-building can fuel a drive toward ATH.
🧯 If support fails: Expect a pullback into the prior range; reassess on the 15‑min.
Sharing my personal view — not financial advice.

Strong upmove coming up above 26100!As analysed, following the structure, we can still see NIFTY in more like an inverted head and shoulders pattern which is a strong bullish pattern. Hence now that it has managed to close above 26000 which has already been tested multiple times before can now show a very strong upmove above 26100 which is a neckline of the structure so one can go long if breaks above given level so plan your trades accordingly and keep watching everyone.